Month: January 2015

  • Charts I’m Watching: Jan 7, 2015

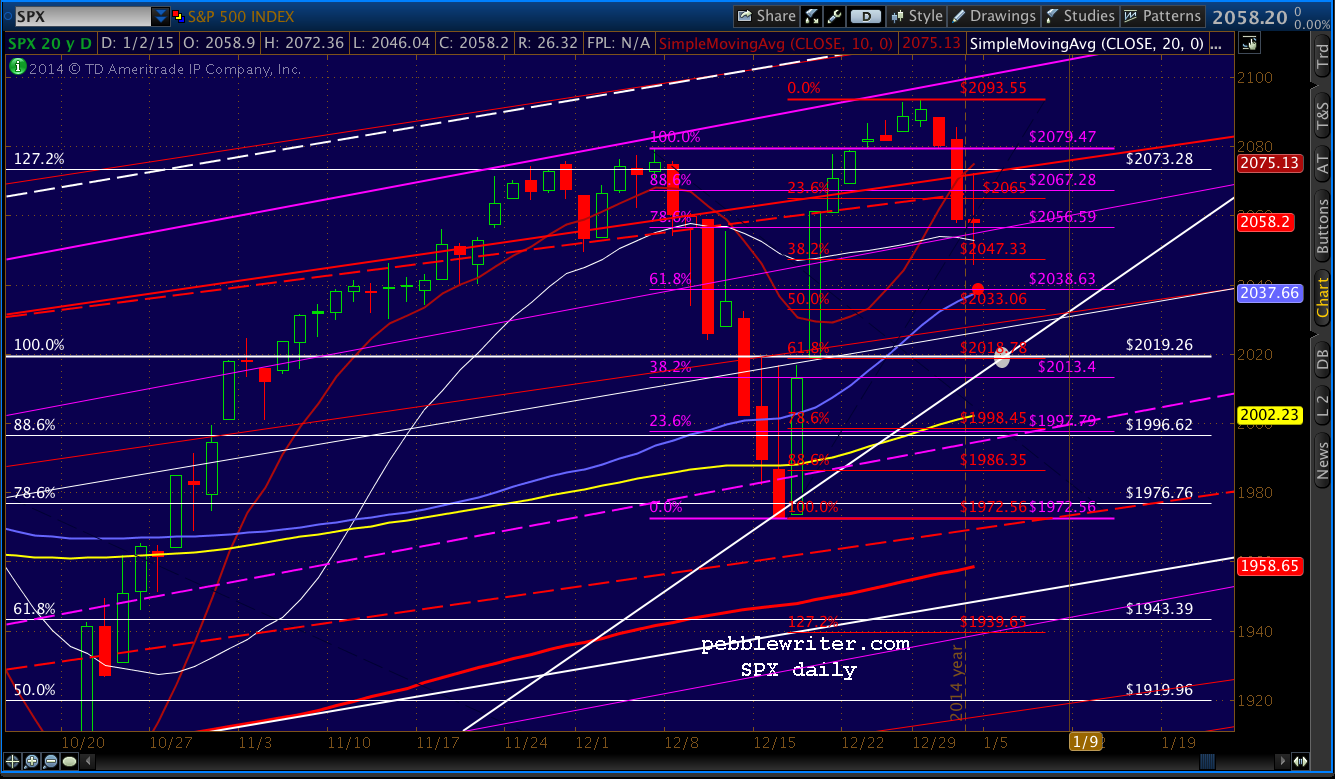
    After yesterday’s sharp intra-day reversal, we identified SPX’s SMA100 and the round number 2000 as downside targets.  It was touch and go, but SPX closed 2002.61 — just a smidge under the moving average.

    2015-01-07-SPX daily 0600As we’ve long maintained, the key to a bounce was USDJPY, which initially held key support — but ultimately broke down.    From yesterday:

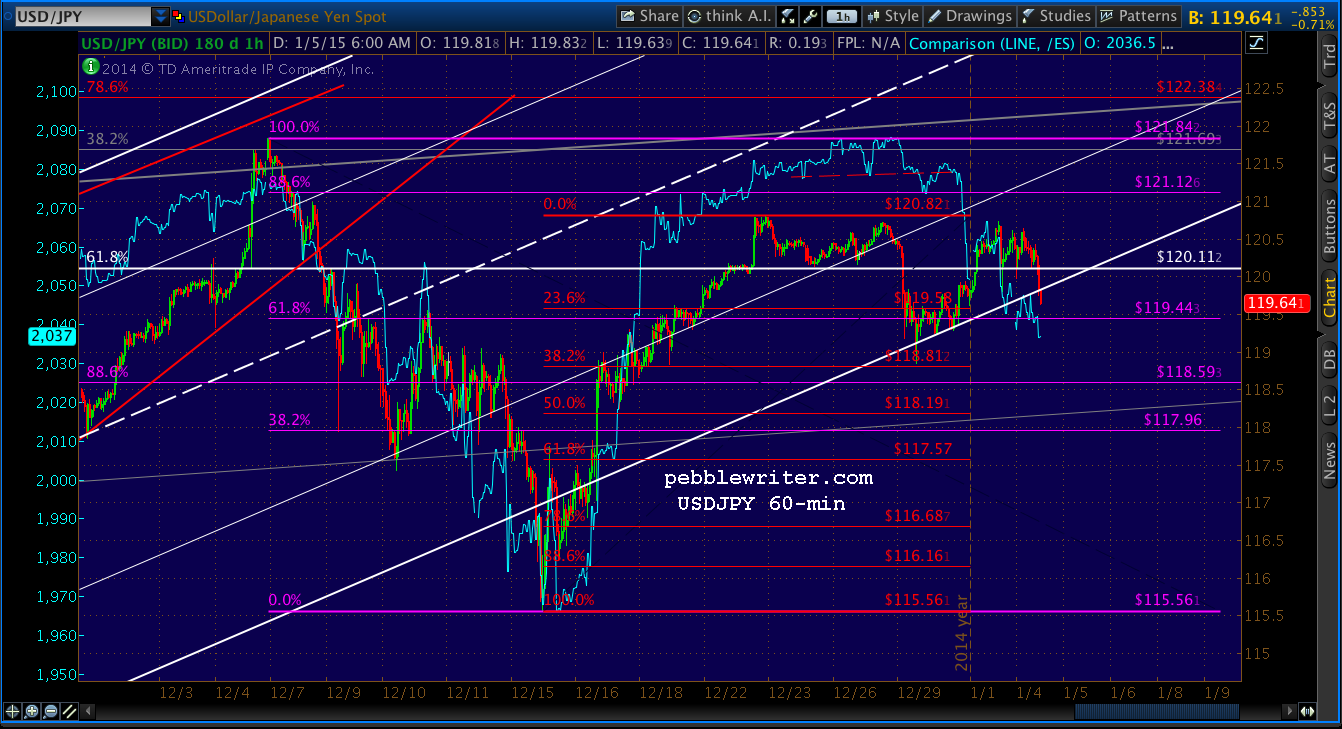
    The problem child is USDJPY, which has dropped below the purple .886 yet again.  It’s tough to tell when this highly-manipulated currency pair is producing a head fake or is legitimately in trouble.  Need we remind readers that the pair is now well below the key .618 at 120.11?  The next support is the red .500 at 118.18.

    Thankfully for the bulls, USDJPY snapped back to the rising white channel overnight.

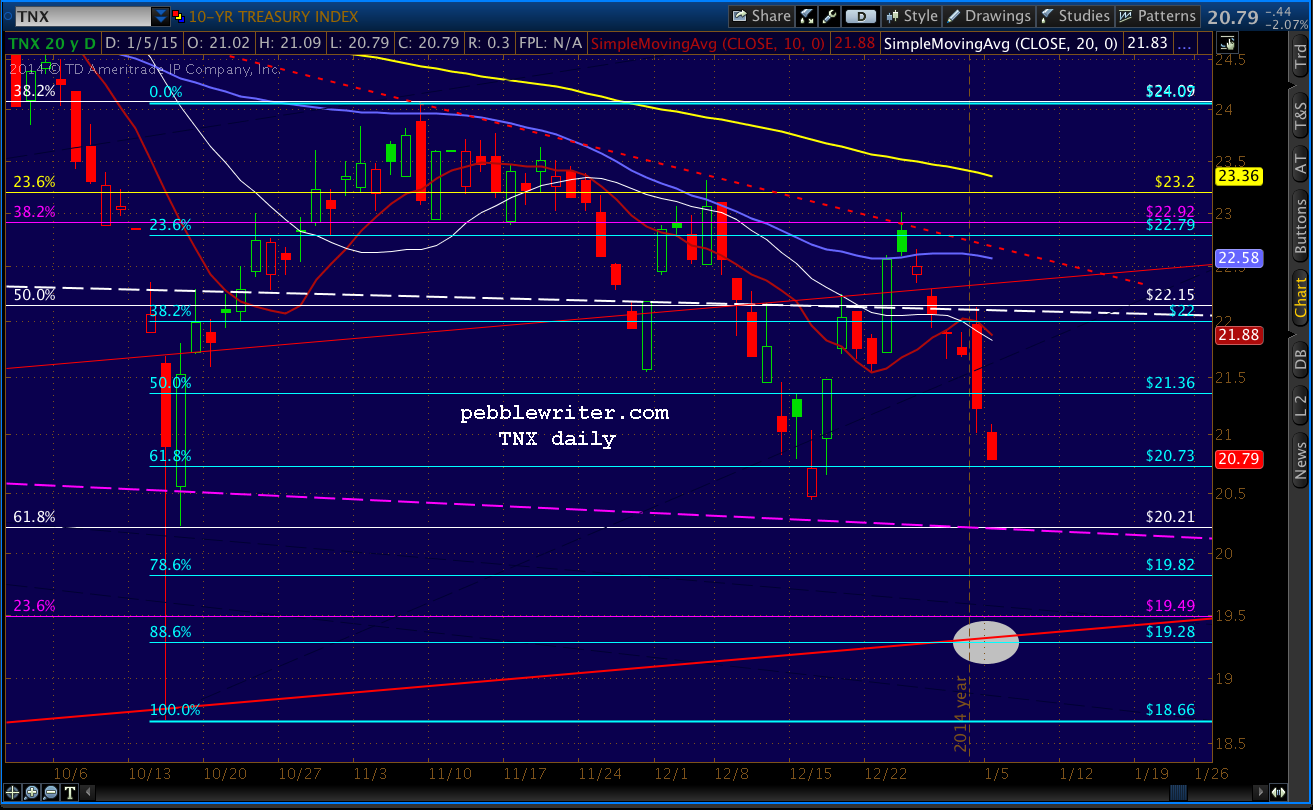
    2015-01-07-USDJPY 60 0615And, the 10-yr bounced as expected.

    2015-01-07-TNX 60 0600

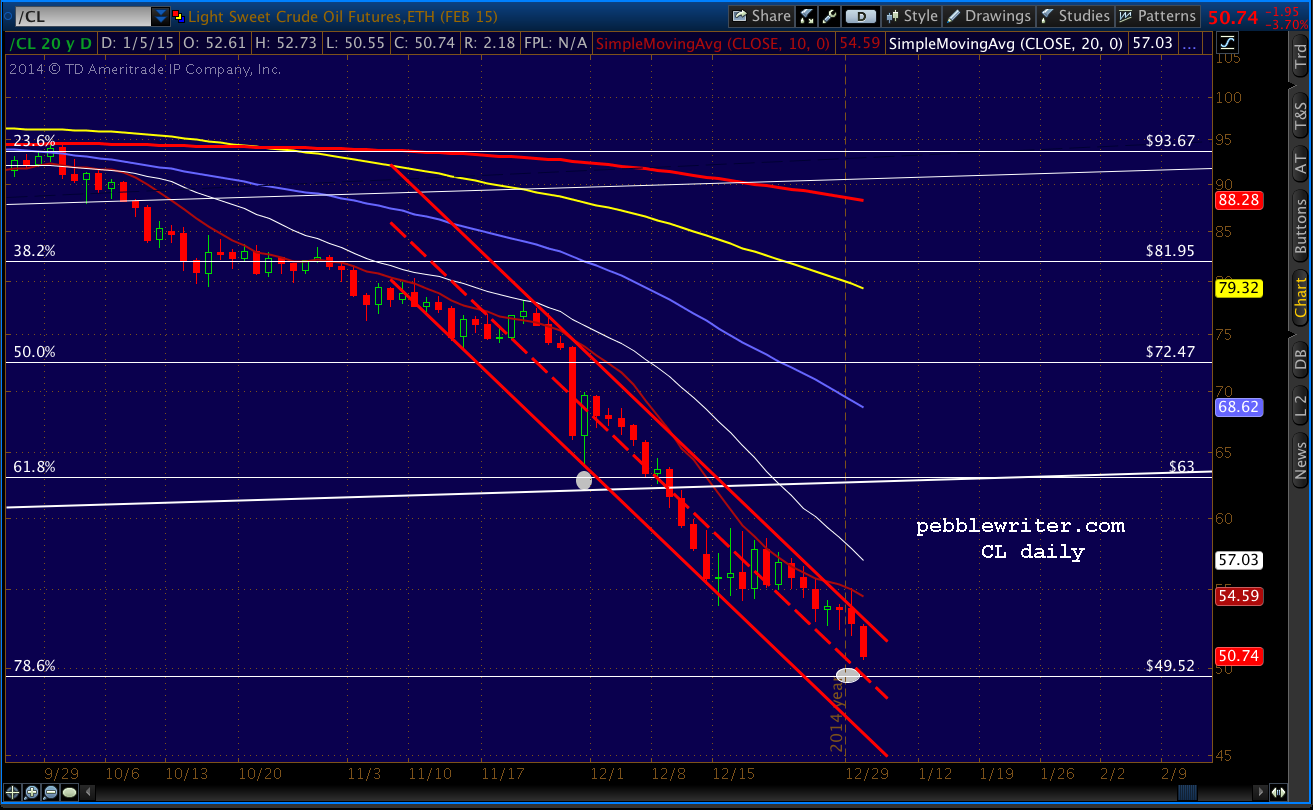
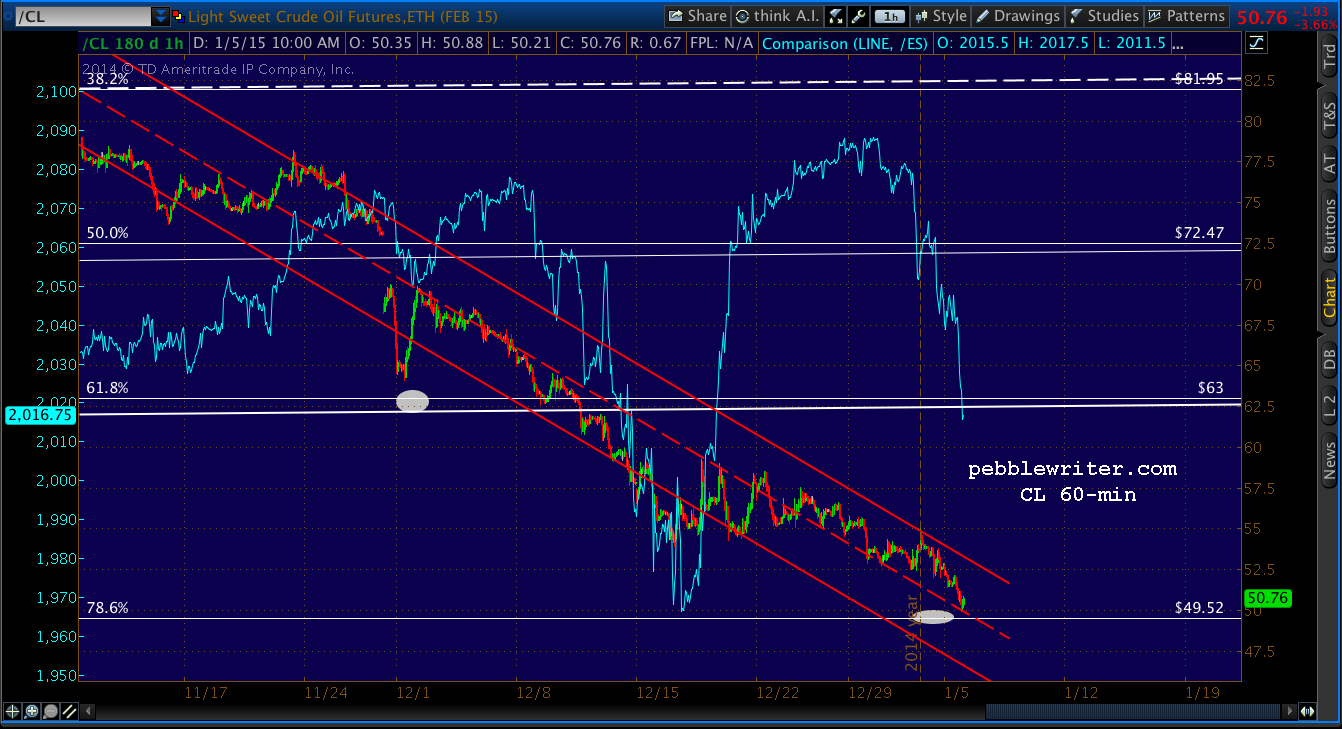
    Oil even rebounded overnight, though it didn’t quite reach the TL as drawn.  But, as discussed in yesterday’s post, there’s a certain margin of error when drawing a TL over a 20 year time span.  The key will be getting back above the white .786 at 49.52.

    2015-01-07-CL daily 0630As such, we’re looking at SPX’s bounce finally getting underway this morning.  But, it’s not out of the woods just yet.

    continued for members(more…)

  • Update on Oil: Jan 6, 2015

    A little over a month ago, we wrote that crude light (CL) had reached a two month-old target and what appeared to be a potential buying opportunity: the intersection of a key Fibonacci level and a long-term channel bottom.
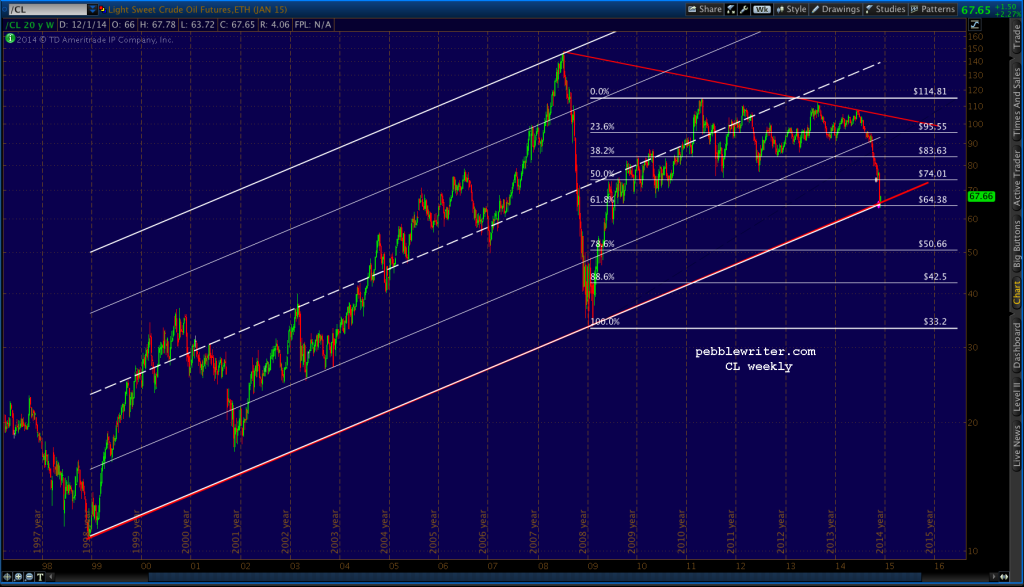
    2014-12-01-CL weekly 0800

    We were pleased with that call…until the rebound ran out of gas only a day later.

    Some say the continued decline is Saudi Arabia’s way of bringing US shale growth to a screeching halt.  Others suspect that it’s the US government at work, tanking Russia’s oil-dependent economy.  It’s also possible that that chart, for all its symmetrical beauty, was drawn in the wrong scale.  I’ll explain.

    I chart just about everything in logarithmic scale — particularly those charts that span a long period of time and contain large swings in price.  But, once in a while — for no particular reason — an arithmetic chart just makes more sense.

    Here’s the updated chart in logarithmic scale in all its channel-busting ugliness.

    2015-01-06-CL wkly log 1400Switching to arithmetic scale, it’s obvious that the white channel doesn’t even belong.  Before clicking back to that cat video, though, check out the alignment of the 1998, 2001 and 2009 lows — connected here by the yellow dotted trend line.

    2015-01-06-CL wkly arith 1400A trend line that goes back that far is certainly subject to placement error (to use the tails or not?)  But, simply connecting the Dec 12, 1998 and Jan 15, 2009 lows puts that TL at about 45-46 — a couple of points below today’s low — and, not too far from the white .786 Fib.

    Does it matter?  We’ll find out in the next few days.  If nothing else, it’s a good reminder to check out the alternative view from time to time.  A casual perusal of the blogosphere reveals plenty of folks who chart arithmetically.  Maybe this is one of those times when log scale wasn’t the best choice.

    Suppose CL drops below 46.  What then?

    We discussed the bleak channel and TL standpoint.  From a price Fibonacci standpoint, the next major support is another 13% lower — the white .886 at 41.49.  A time Fibonacci chart shows that the June 2014 highs (the red 1.618) were right in line with the major low in 1998 and high in 2008.  In other words…also bearish.

    2015-01-06-CL wkly arith 1430

    And, it’s probably not too crazy to start talking about the purple Fib lines.  If the 2009 low of 32.34 is broken, the purple .886 at 26.13 is pretty much the last line of defense until the 10.65 lows from the (drumroll, please) Last Century.

    Regardless of whether one looks at log or arith charts, the strong positive correlation between oil and stocks (SPX, in purple below) over the past 20 years is obvious.  It broke down this past year when stocks decoupled from, well… just about everything.

    But, given the level of financial institution involvement with the oil industry ($550 billion in bonds and loans since 2010), it’s probably safe to say that a continued slide in oil can’t help but leave a mark.

    2015-01-06-CL wkly arith 1440Stay tuned.

  • Charts I’m Watching: Jan 6, 2015

    USDJPY reached the bottom of the white channel — and then some — slightly overshooting our 119 target.

    2015-01-06-USDJPY daily 0615We identified 119.07 as the line in the sand, and it’s hovering right there this morning.  Meanwhile, SPX reached our 2018.78 target.  From yesterday morning’s post [members’ section]:

    As such, I’m looking for an initial bounce at the red .618 at 2038 (also just below the SMA50), followed by a dip to the white TL mentioned above (2018.78 if it happens today or tomorrow, otherwise 2030.)

    We called for a bounce there, and the rebound I’m expecting in USDJPY should accommodate one.  Keep an eye on 118.59 — the purple .886.

    On the oil front, CL reached our 49.52 target overnight. 2015-01-06-CL daily 0700And, TNX is nearing its ideal bounce point — the red .886 at 19.27 (though 19.79 would also work.)

    2015-01-06-TNX 60 0640But, currencies should rule the day.   EURUSD is still hovering above the Jun 2010 lows.  And, DX remains above our 90.272 target in what looks like a channel break out.

    Stay tuned.

    UPDATE:  11:00 AM

    That nice 13-pt bounce was just undone by lower rates, oil’s continued weakness and USDJPY’s drop through 118.59.  Note that PMI, ISM and factory orders all disappointed.

    2015-01-06-SPX 60 0800It’s possible the purple .382 will hold, but it will require a reversal by TNX and USDJPY.  The stronger support is at the SMA100 at 2003.77.

    2015-01-06-SPX daily 0800

    UPDATE:  11:50 AM

    TNX just reached our 19.27 target…

    2015-01-06-TNX 60 0847…at about the same time as SPX reached the SMA100 identified in the above update…

    2015-01-06-SPX daily 0847…and, VIX is nearing the purple channel midline.

    2015-01-06-VIX 60 0848The problem child is USDJPY, which has dropped below the purple .886 yet again.  It’s tough to tell when this highly-manipulated currency pair is producing a head fake or is legitimately in trouble.  Need we remind readers that the pair is now well below the key .618 at 120.11?  The next support is the red .500 at 118.18.

    2015-01-06-USDJPY 60 0848The bulls should be expected to try and hold SPX 2000, but it would require that all the above reverse muy pronto.  According to Bill Gross, who draws a slightly higher readership than yours truly, we shouldn’t hold our breath.  In his just-released annual outlook, he tells investors “the good times are over.”

    I certainly have no qualms with his macroeconomic and market fundamentals reasoning.  I’ve thought the same for quite some time.  But, IMHO, the “good times” can be extended for as long as central bankers are willing to continue shoveling moolah into the banking system (as opposed to “the economy”) and the BoJ is willing to continue trashing the yen.

    The rest is shoulda-coulda-woulda.

    continued for members(more…)

  • Charts I’m Watching: Jan 5, 2014

    The downturn we called for last week has exceeded our expectations — the most bullish target proposed on Dec 31.  Why?

    2015-01-05-SPX 0600Stocks can handle the troublesome economic news and sketchy geopolitical developments out of the euro zone.  They can even handle lower crude prices.  But a USDJPY that’s — again! — back below the key .618 we’ve been watching?  No way.

    2015-01-05-USDJPY v ES 60 0600The futures are currently down almost 10 points, which points to a retest of Friday’s lows at the very least.  Beyond that, we have to wonder whether USDJPY will remain in its rising channel.  The line in the sand looks like 119.07.

    TNX continues settling toward our Dec 31 target.

    2015-01-05-TNX daily 0640And, crude light is closing in on its next target.

    2015-01-05-CL daily 0646

    continued for members

    A failure to snap back above 120.11 at this point would be troubling to the bulls case, and most likely result in a dip to support at 2038 or 2019.  The channel picture is a mess at present, so we’ll stick with Fibs, daily moving averages and the white TL off the Dec 16 lows.

    As such, I’m looking for an initial bounce at the red .618 at 2038 (also just below the SMA50), followed by a dip to the white TL mentioned above (2018.78 if it happens today or tomorrow, otherwise 2030.)

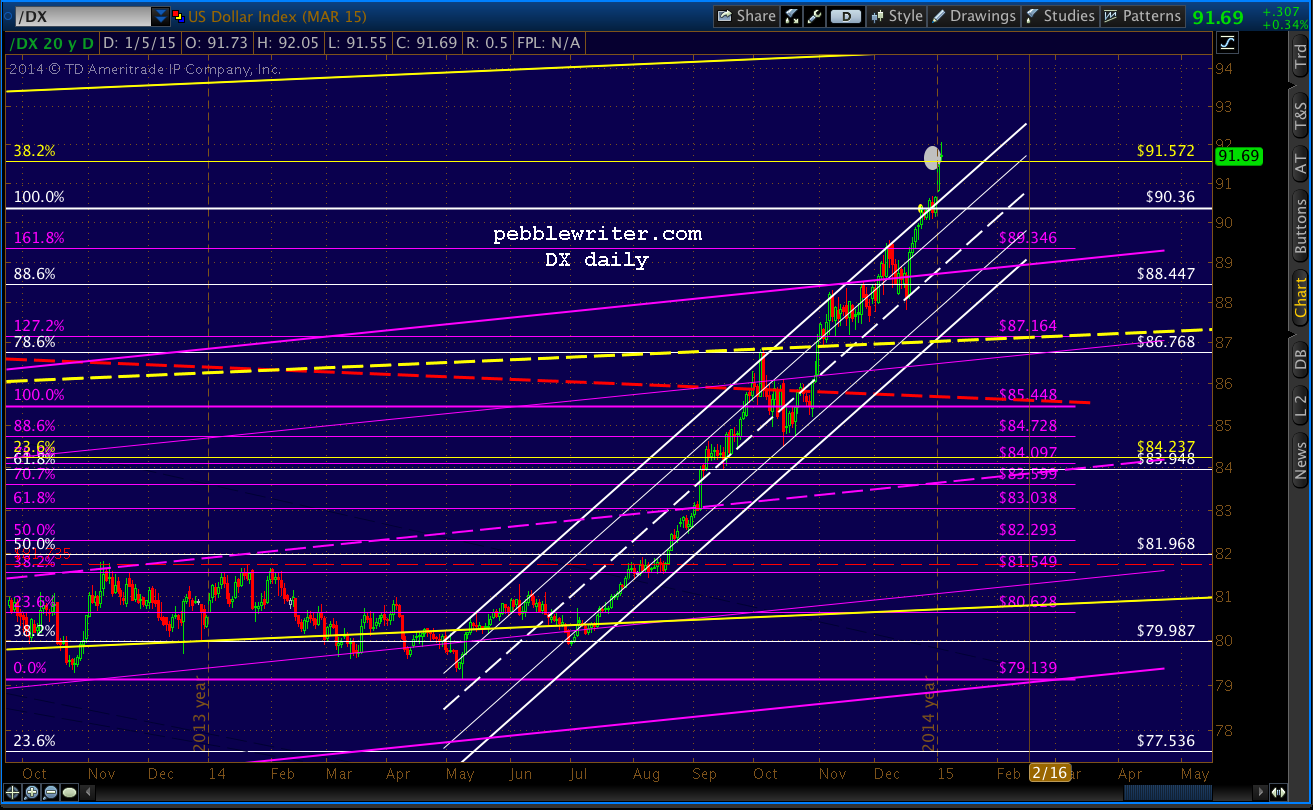
    The dollar is showing plenty of strength, shooting up past the .382 (adjusted for contract change.)

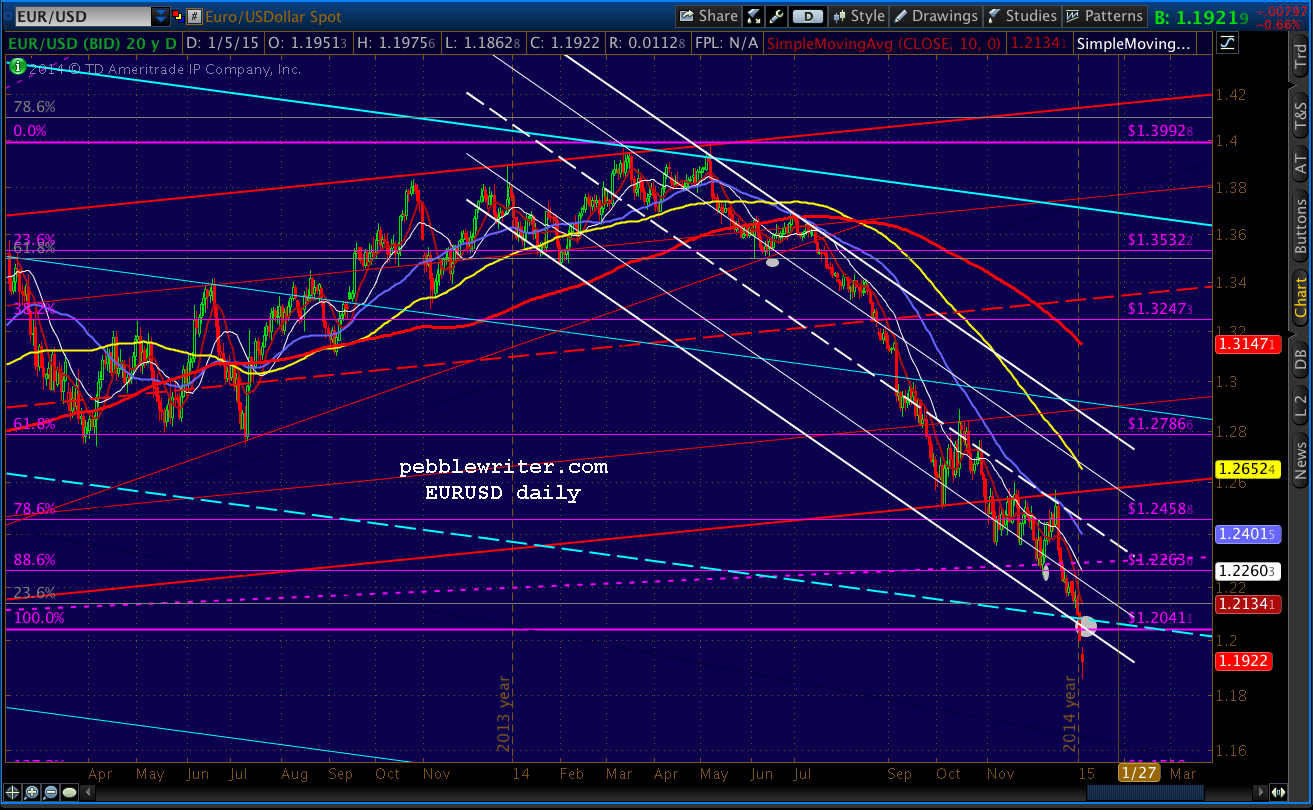
    2015-01-05-DX daily 0700It’s all on the back of the euro’s weakness — which does nothing for the yen carry trade crowd.  The EURUSD briefly dipped below its Jun 2010 lows this morning.

    2015-01-05-EURUSD daily 0646UPDATE:  1:30 PM

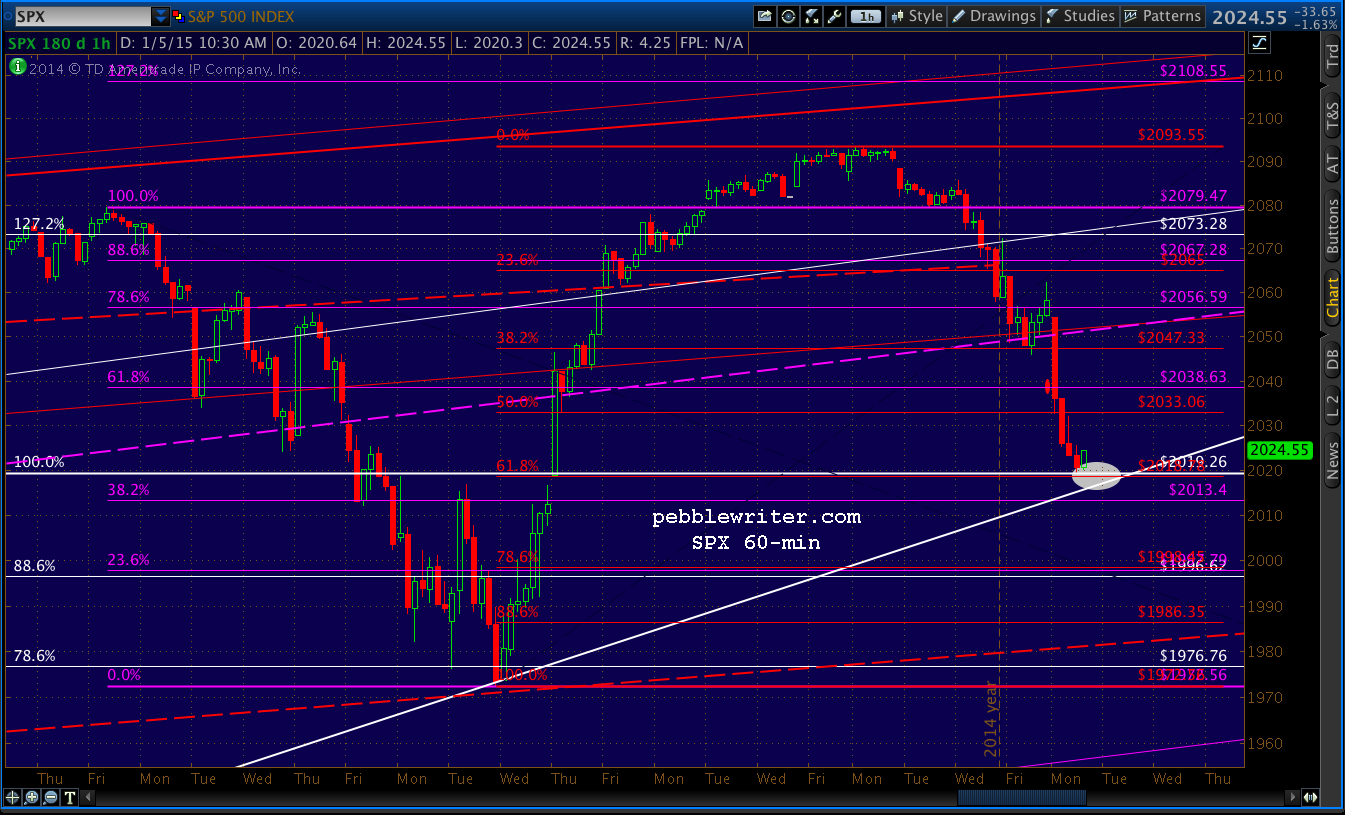
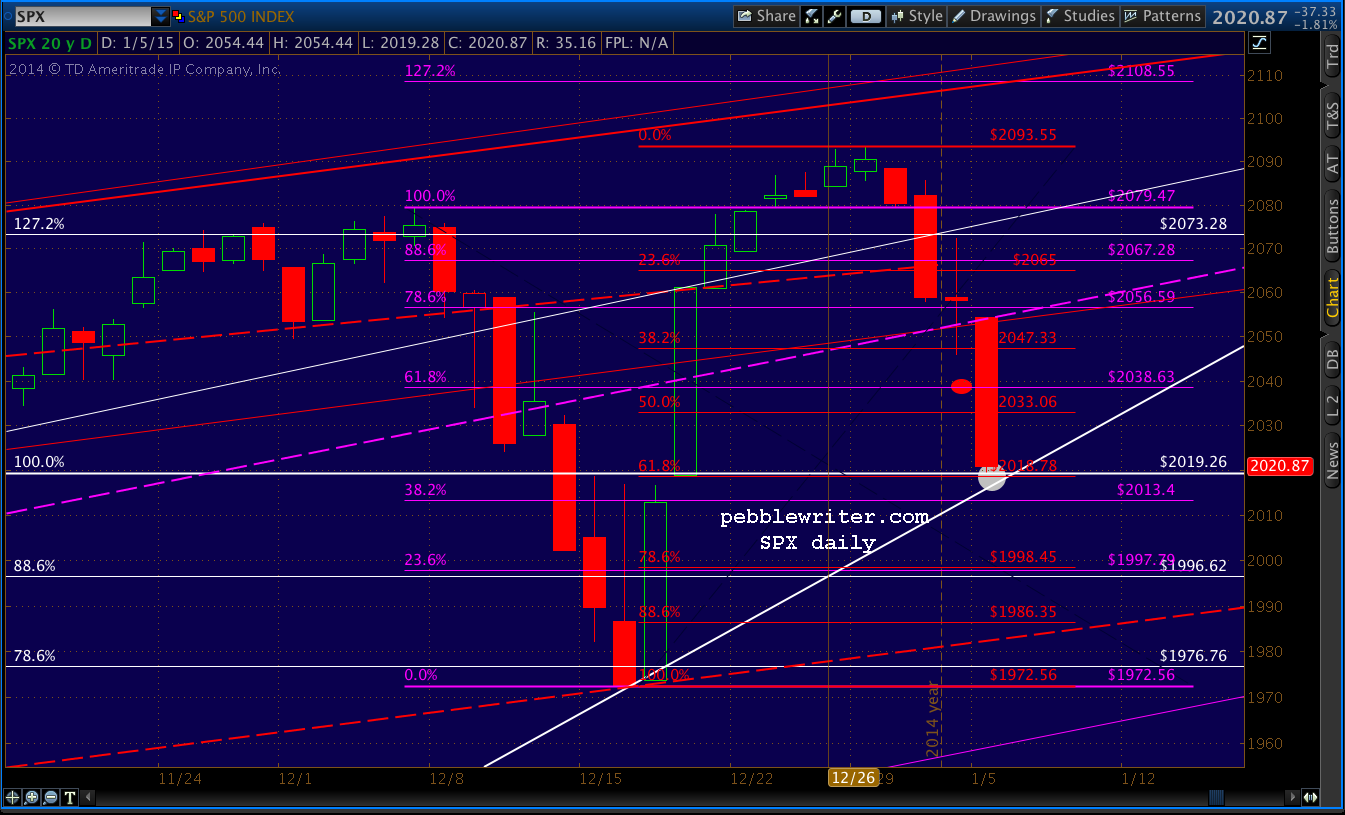
    SPX just tagged 2019.28, very close to our 2018.78 target.  We should get a nice bounce here.

    2015-01-05-SPX 60 1037 2015-01-05-SPX daily 1030CL hasn’t quite reached the .786.  A bounce in CL would support a more significant rebound in stocks.  A little more downside to 49.52 would help SPX with a more precise tag of the .618 at 2018.78.

    2015-01-05-CL 60 1042