

A reminder: From August 25-29, we’re offering Charter Annual Memberships at $950. It works out to about $2.60/day, less than most of us spend on a cup of coffee.
It’s $550 off a regular annual subscription (slated to be at $1,500 by the end of the year), and a whopping $1,150 off a monthly subscription at the current rate of $175/month (which will increase to $200/month.)
Best of all, your rate will never increase for the life of the site for as long as you remain a member. To sign up now, click HERE.
* * * * *
I chuckled when I read a headline on Zerohedge yesterday: “What if the Crash is as Rigged as Everything Else?” Charles Hugh Smith is one of my favorite financial writers and an excellent analyst, so I have no quibbles with his reasoning. It’s sound, as always.
But, given that we forecast last March the USDJPY’s decline to its SMA200, the effect it would have on stocks, and the reasons why TPTB would not only allow it but actually make it happen, I’m still shocked that so few analysts are picking up on the fact that of course it is!
We have several new members over these past few days, so it probably wouldn’t hurt to recap.
- the yen carry trade has driven the vast majority of stocks’ gains since 2011.
- Japan can’t continue devaluing the yen w/o repercussions, chiefly higher import prices
- SPX hit very heavy Fib resistance at 2138 in May (the Last Big Butterfly)
- the only path past 2138 is further yen devaluation
- because it will cost them, Japan needed to be sufficiently encouraged/threatened
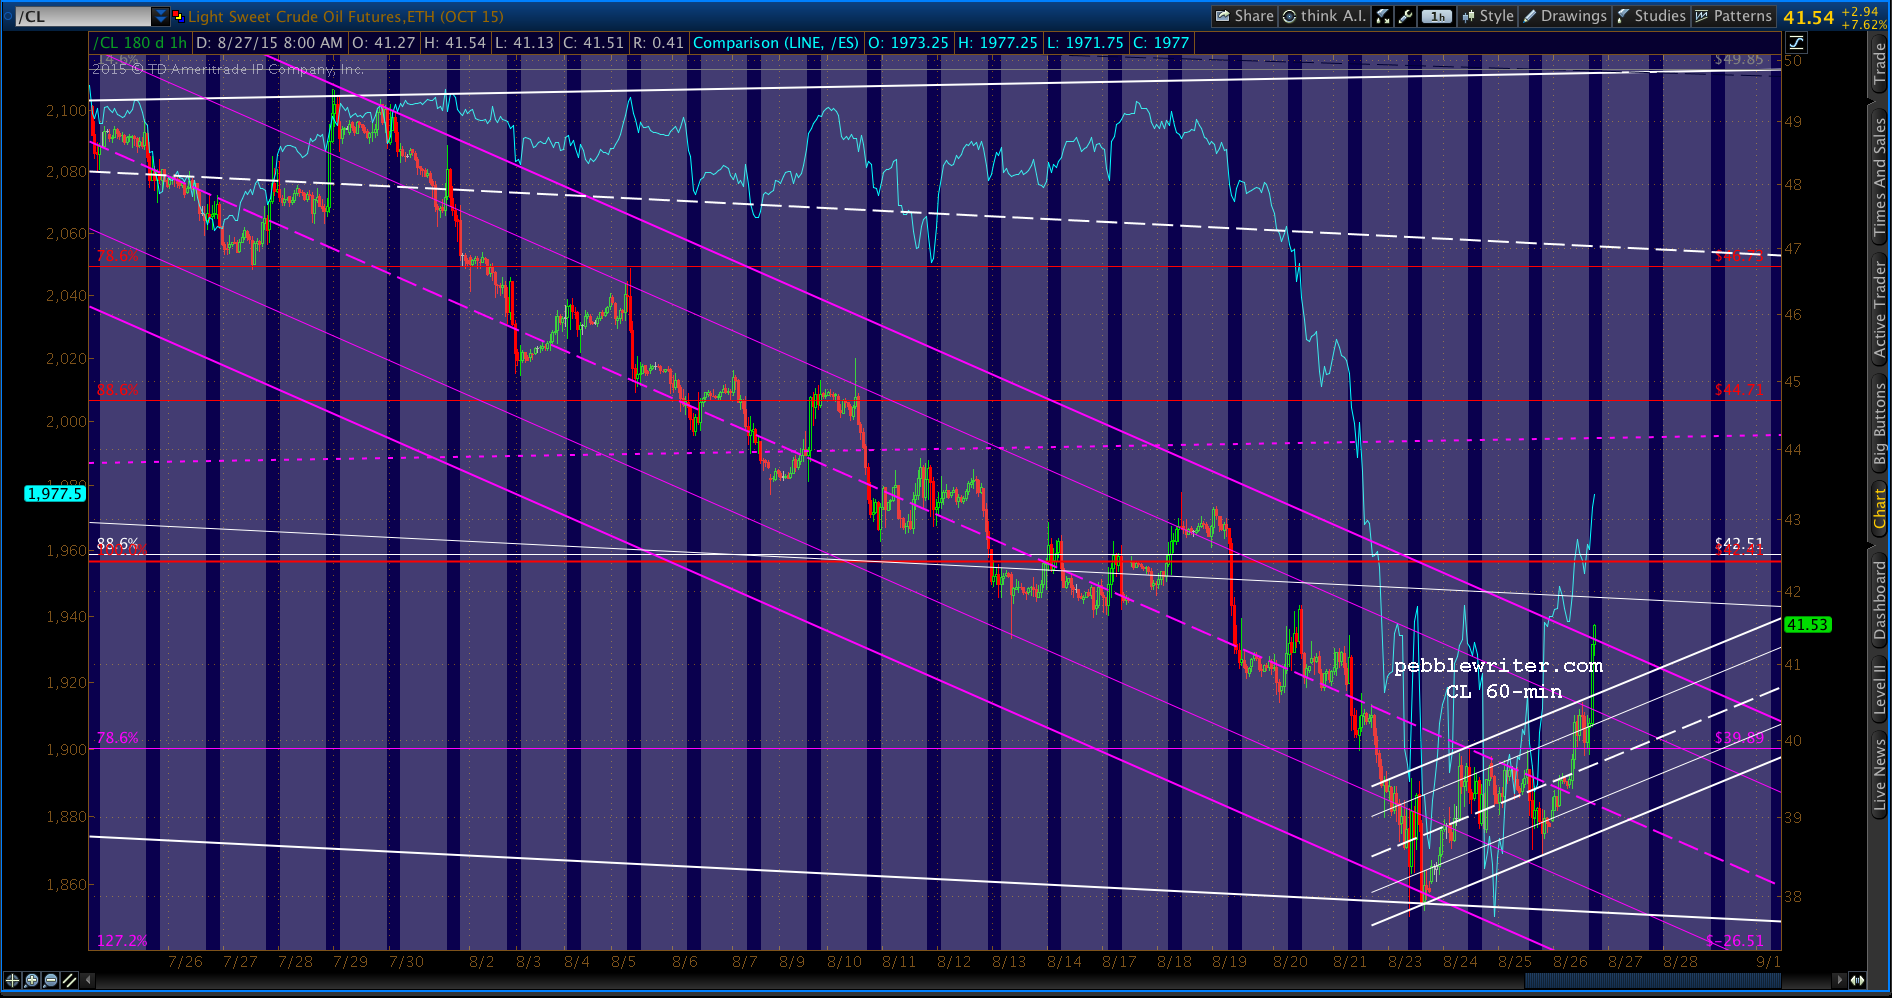
- crashing the oil market was the carrot, the very real risk of an equity trap is the stick
- the BOJ will eventually give in and expand QQE and/or further depreciate the yen
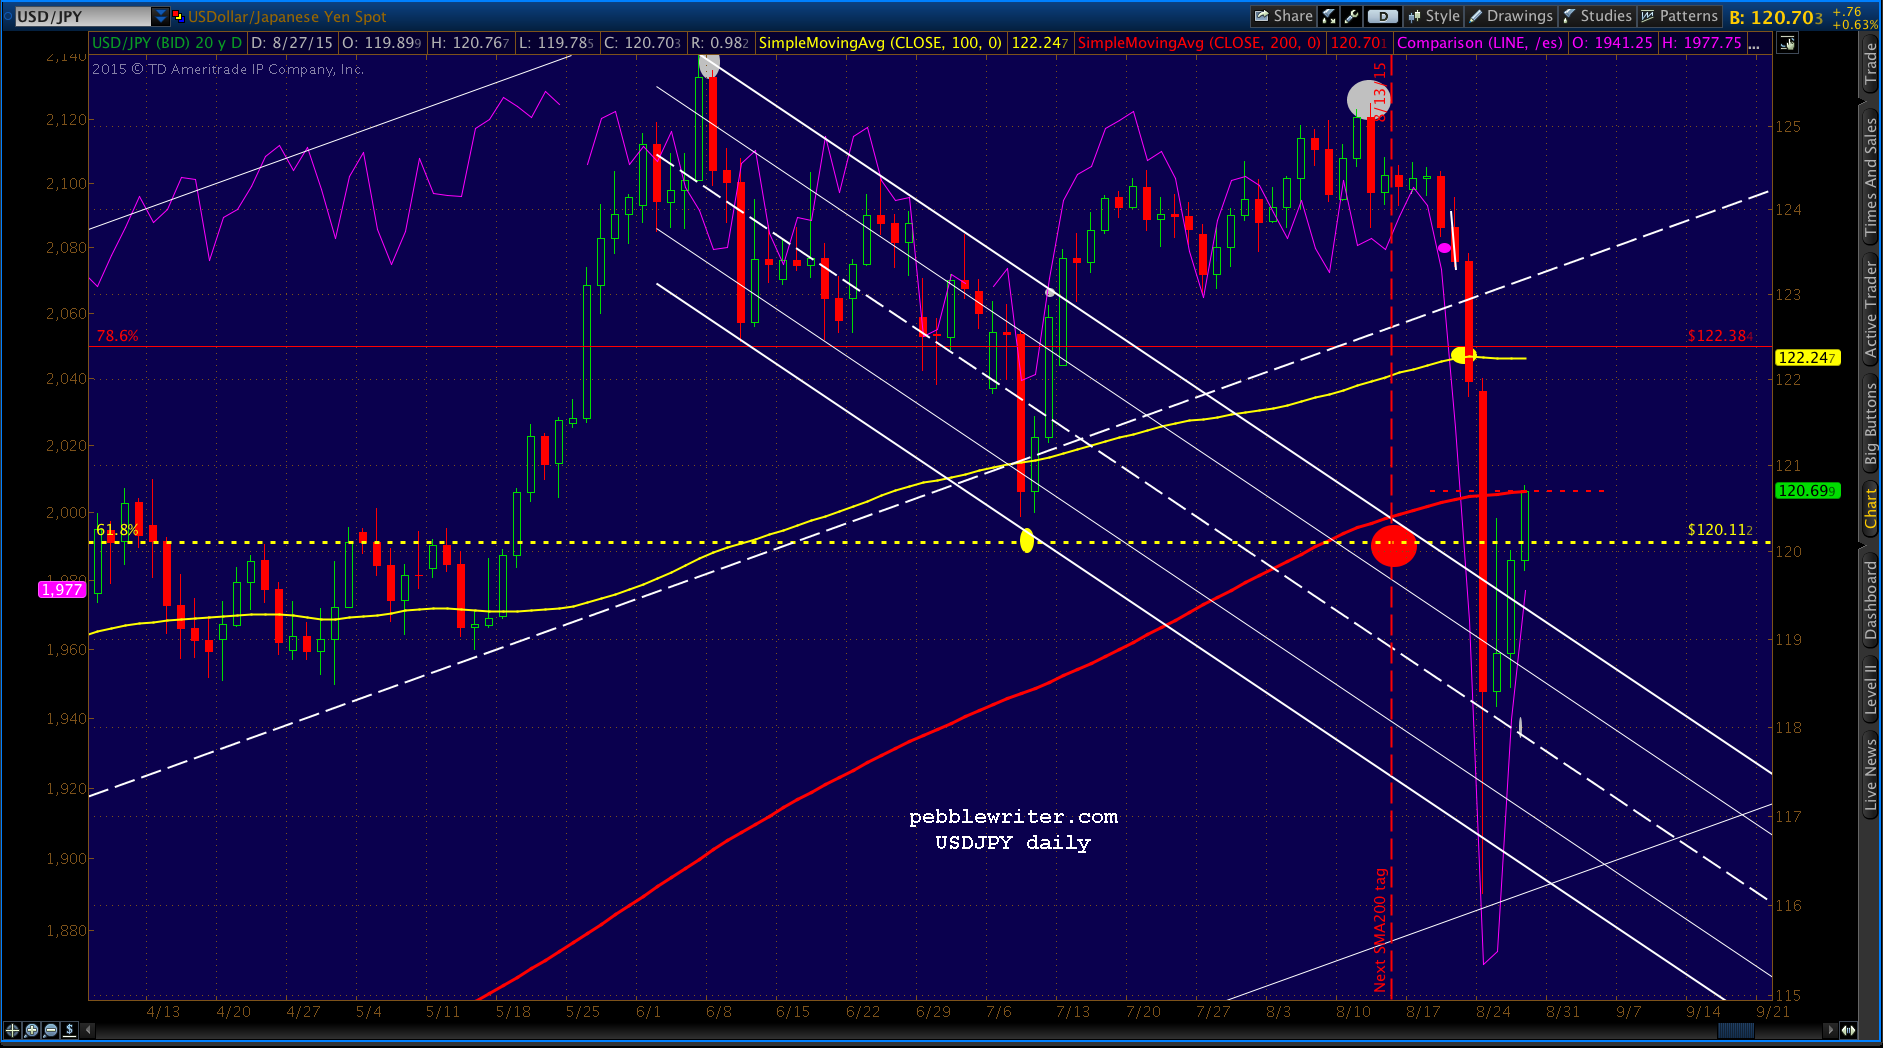
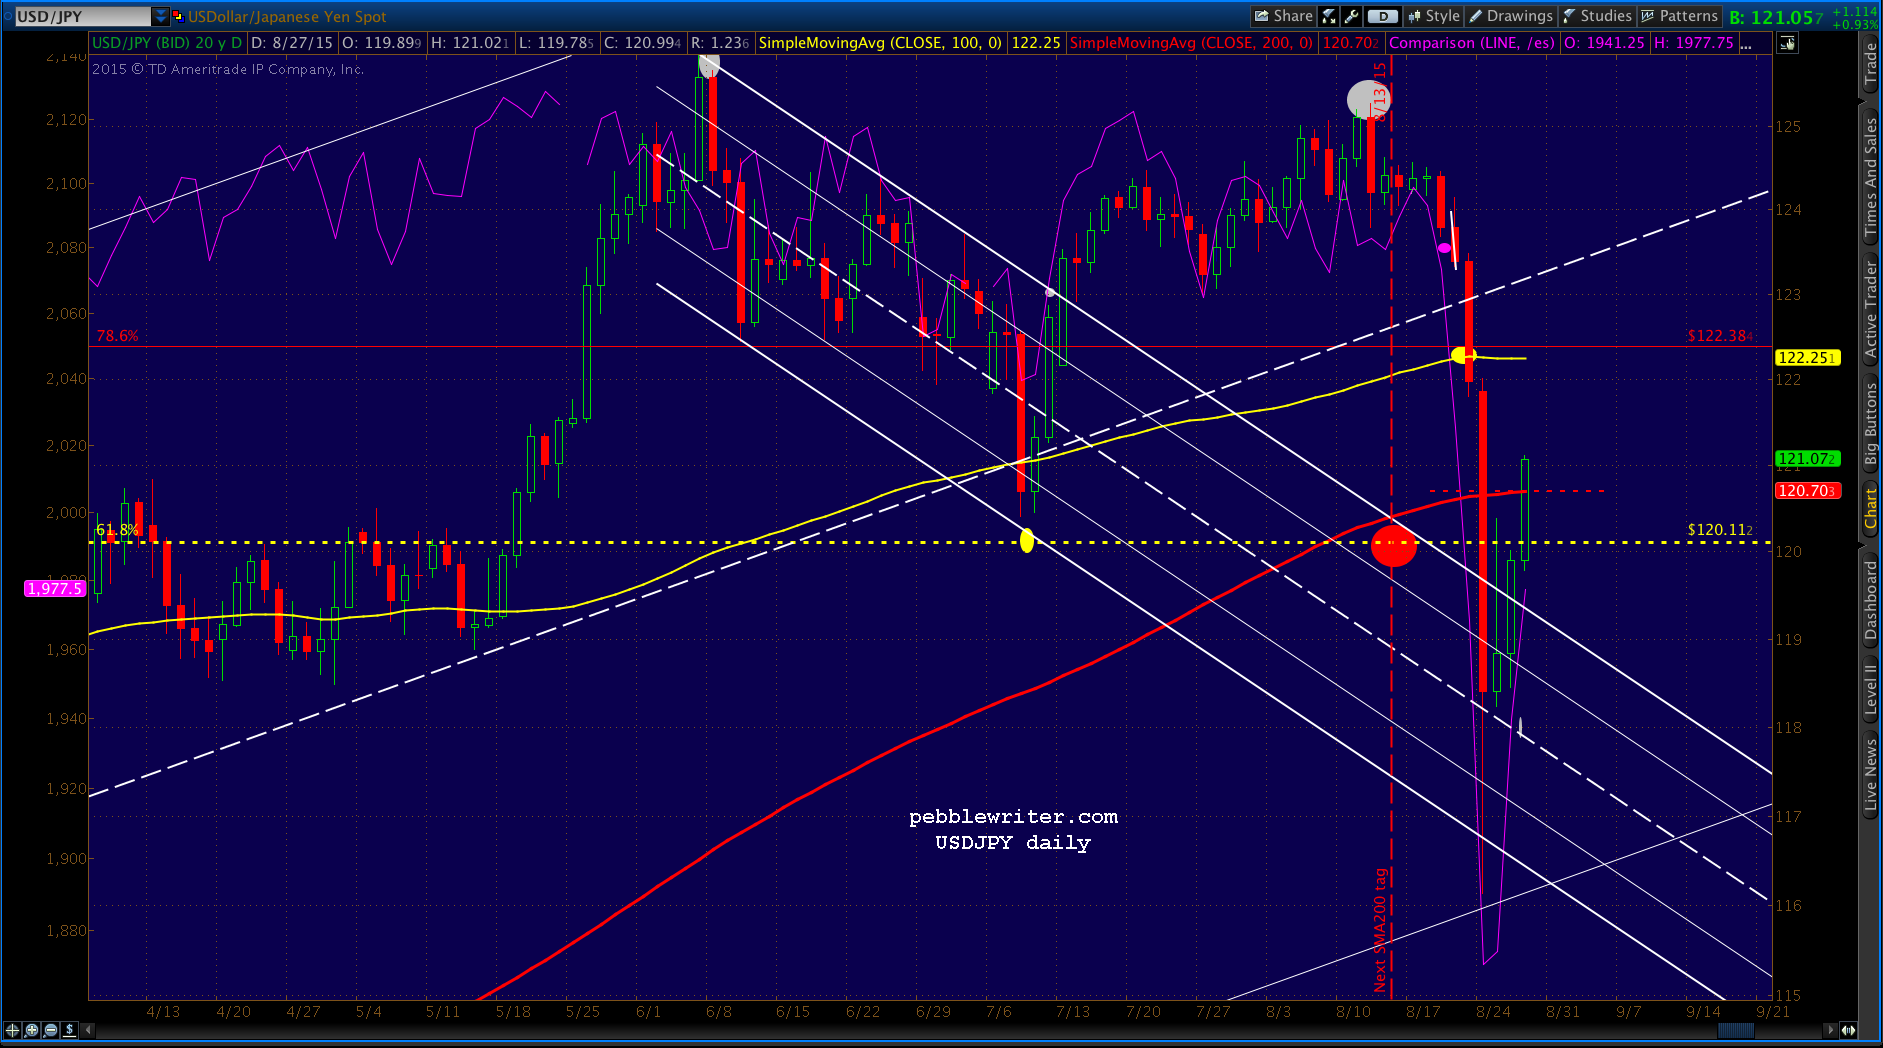
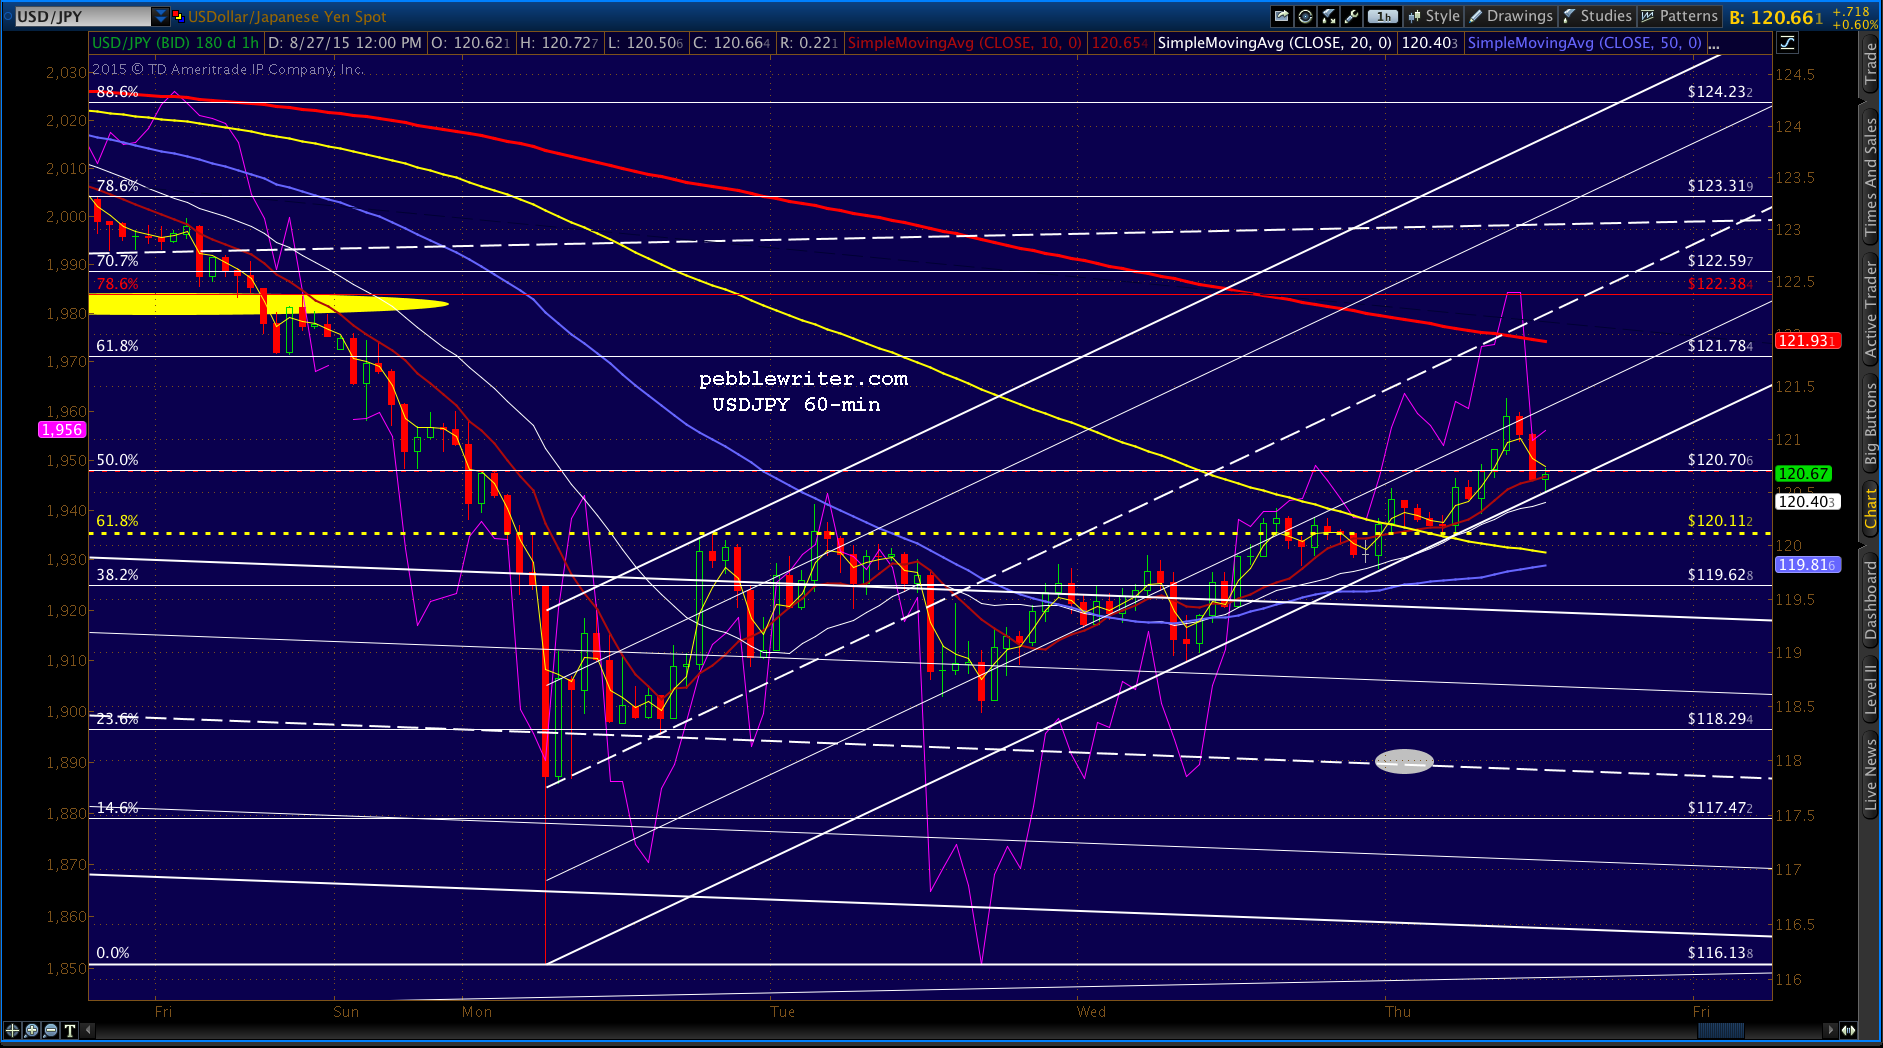
With NKD off 18% from its highs (about 2.4% of Japan’s GDP given the BoJ and GPIF holdings) on Monday, they no doubt felt sufficiently threatened. It has since recovered almost half of those losses, but is still languishing below its own SMA200. Did they get the message? Or, will another leg down be required in order to drive home the point? USDJPY has been returned to the safety of the .618 Fib at 120.11 (trips below it produce sell-offs, trips above produce rallies.) But, it hasn’t regained its SMA200 — and, obviously, won’t until further easing and/or yen devaluation commences.
 Our analog from March has done an excellent job of foretelling all of these events. It has conveniently explained why. But, it doesn’t explain “who.”
In speaking with an old college friend who cut his teeth at Goldman and is one of the more savvy Wall Street guys I’ve ever met, it occurred to me that we may never know who the players are who have orchestrated the entire scheme.
I’m fairly certain the Fed is at the center of it. I think the sheer size of the moves precludes one or two hedge funds getting together to manipulate the USDJPY, ES, CL, ZN, etc. on their own. That raises the question of the BoJ.
Abe and Kuroda have been quite open about their efforts to prop up their stock market. As discussed in Japan’s Equity Trap, there’s ¥80 trillion ($666 billion at 120 yen/USD) at stake between the BoJ and GPIF. That’s over 13% of Japan’s GDP and almost 17% of Japan’s aggregate public market cap in those two government coffers alone.
But, are they both in on the plan? Do they have the Diet’s approval, or are they pulling a Hank Paulson — acting bewildered and frightened for the country’s future in order to secure government and corporate approval for the next round of yen decimation? It’s hard to say.
And, I’m not sure it matters. Either way, it’ll happen. And, it’ll be further proof that the crashes are just as rigged as everything else.
Now, on to today’s forcast.
continued for members…
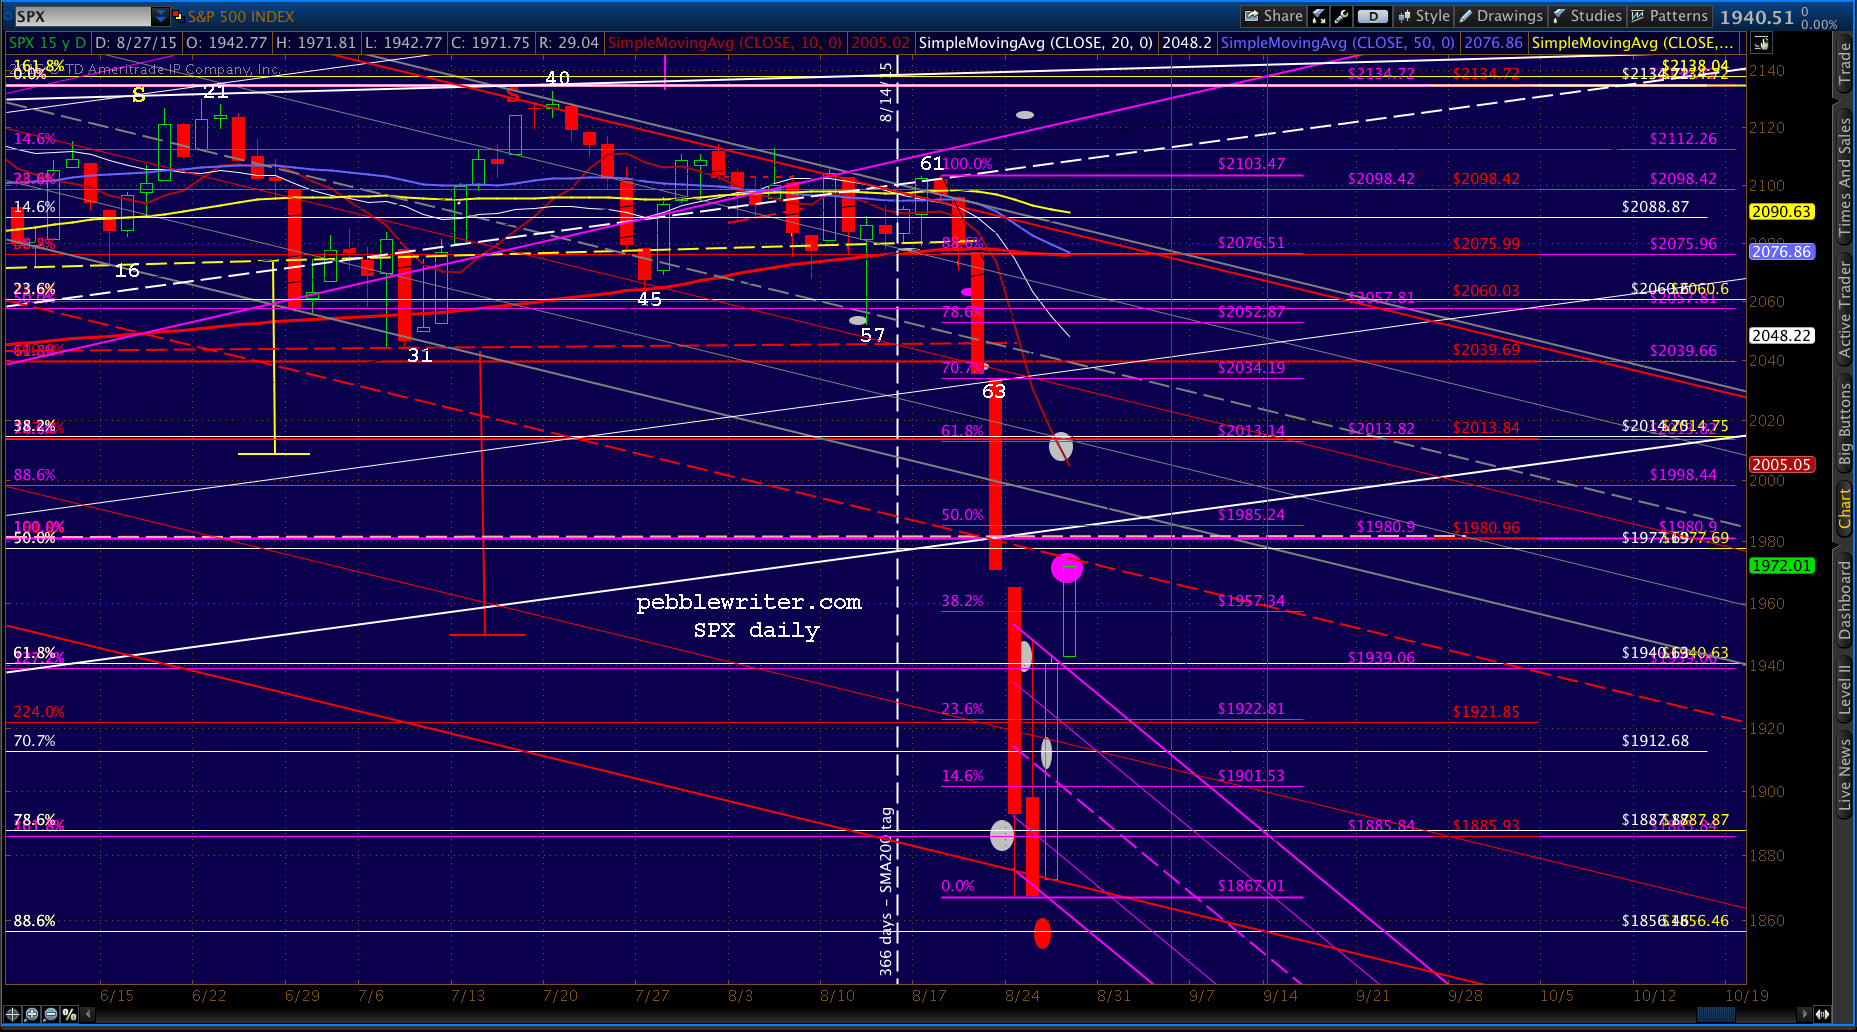
Bottom line: don’t chase the ramp job. SPX should close the gap at 1970.89, and then we’ll have to see. 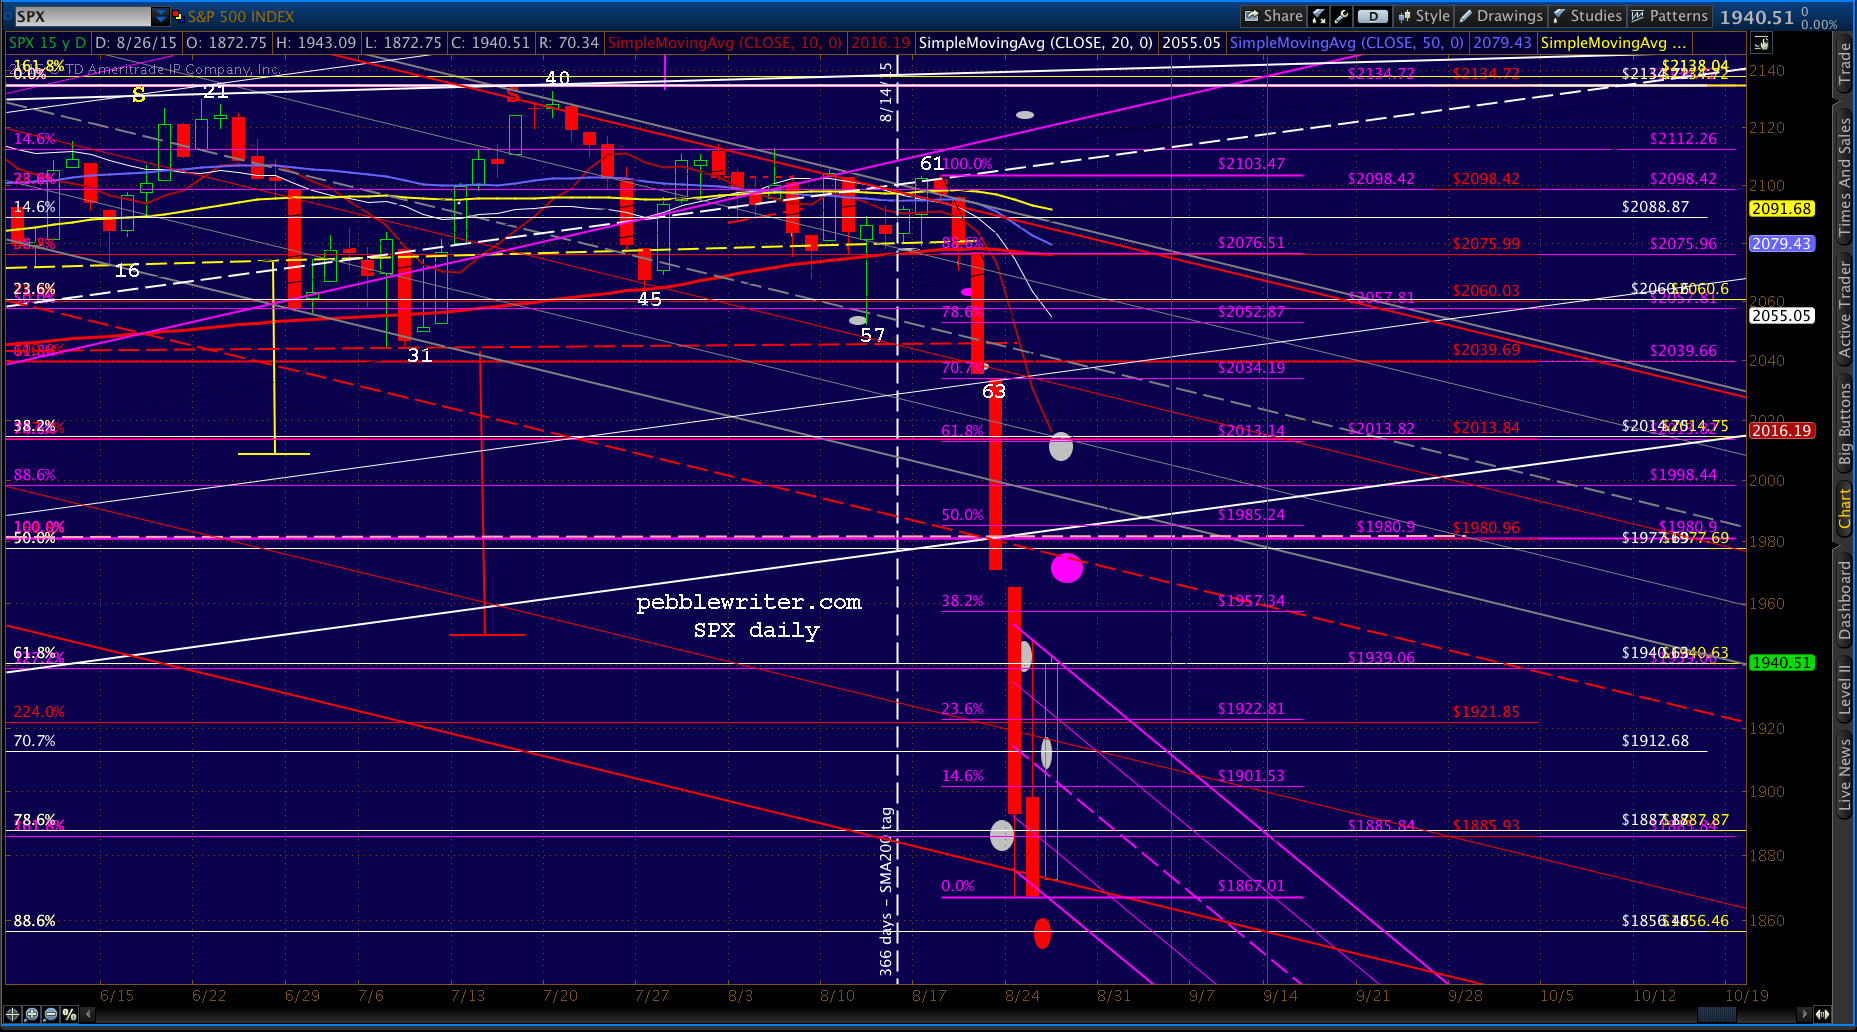 It’s hard to say for sure, but if I’ve drawn the falling red channel correctly, 1970.89 represents the channel’s midline. And, once the gap is closed, SPX might need to retrace some of those gains.
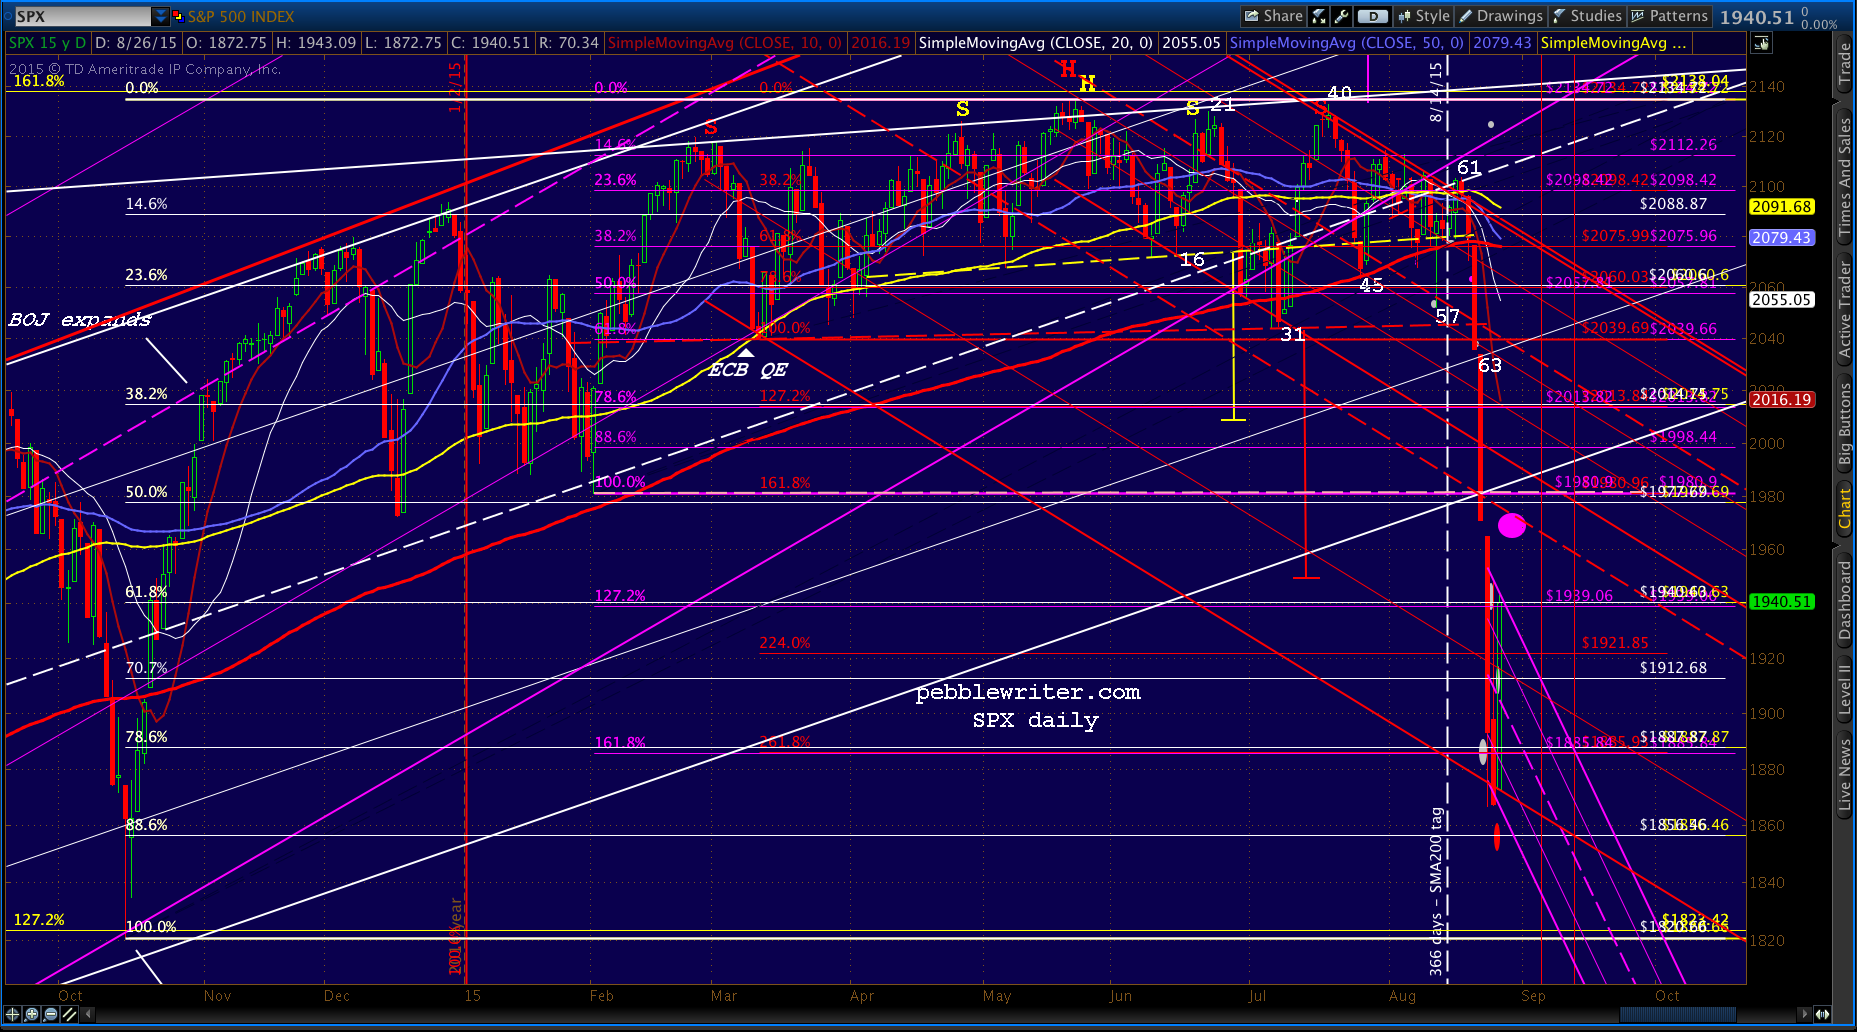 The reason: while USDJPY has indeed topped 120.11 during the night, it is now backtesting the SMA200. They key level is USDJPY 120.70.
I have no idea if they’re ready to go ahead and devalue the yen or this is just a boost to get things turned around as occurred in May. Kuroda has maintained that they won’t over the past two days, but actions speak louder than words.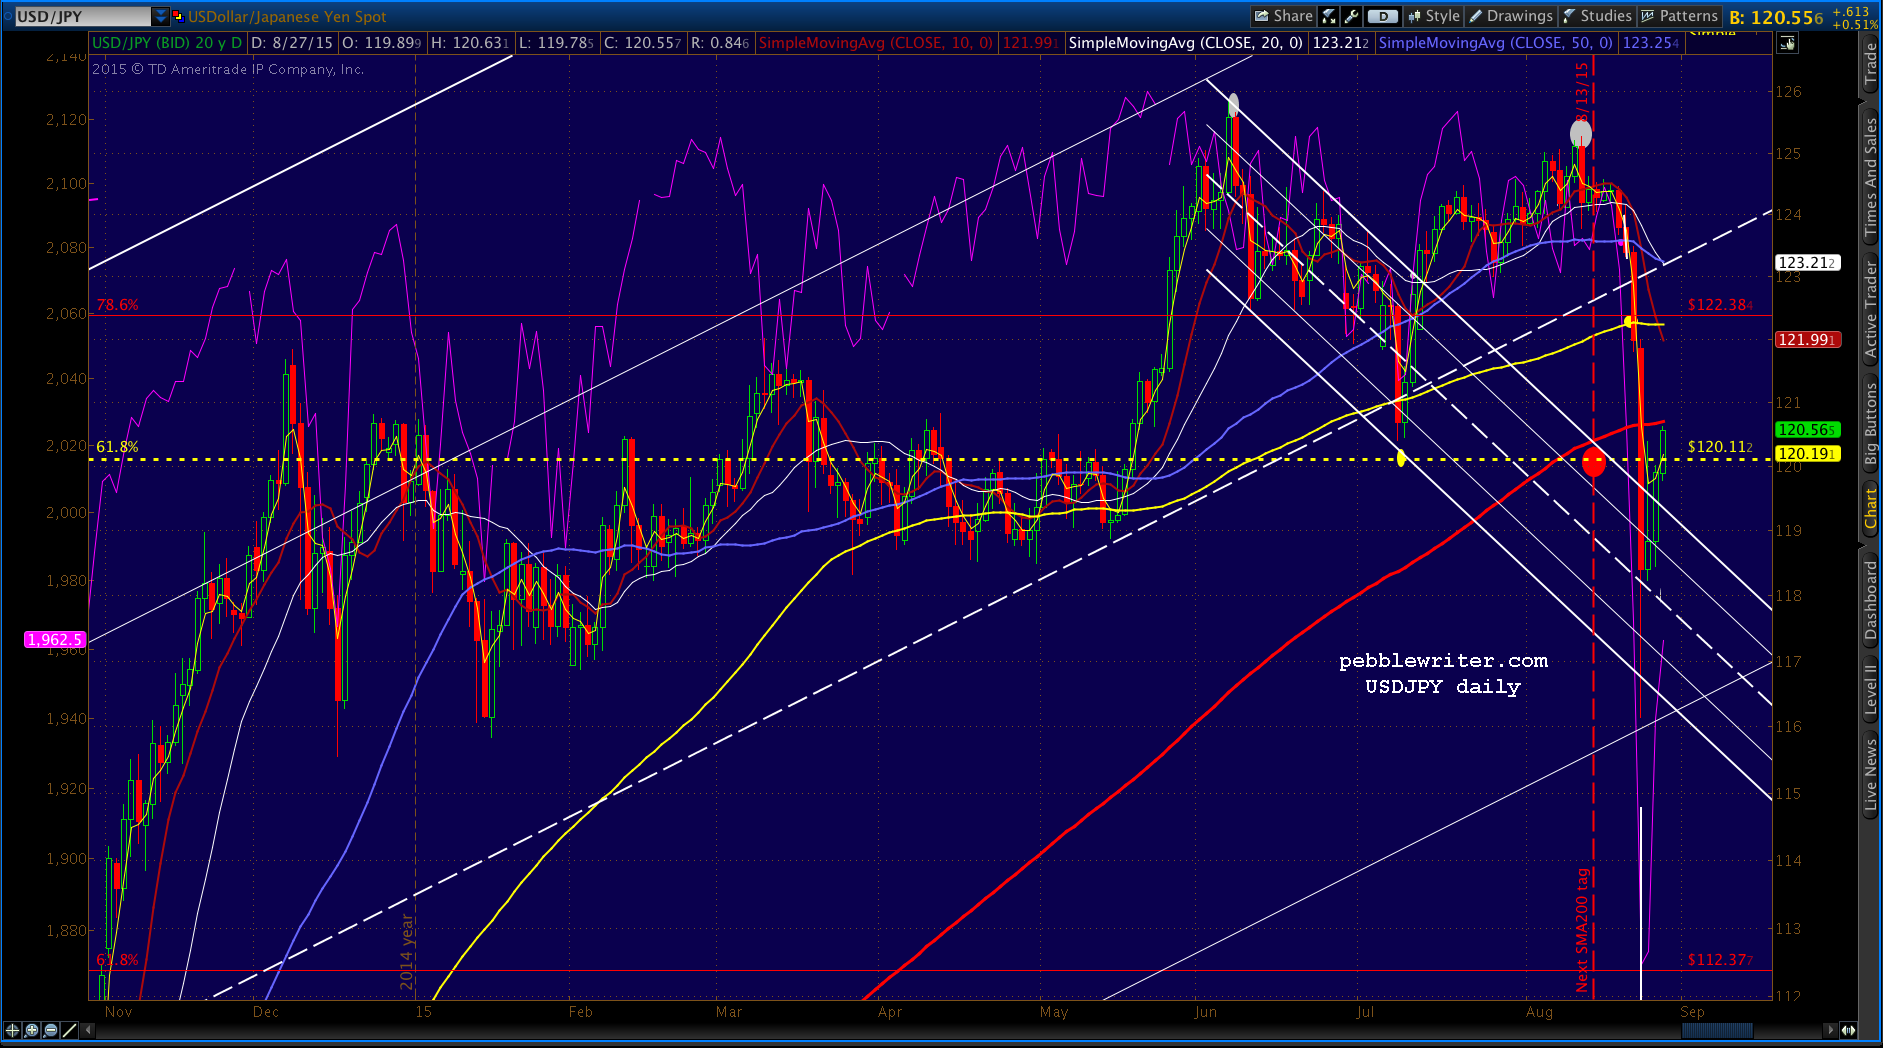
The daily chart since last December shows the relationship between SPX (thin purple line) and USDJPY’s .618 Fib (dotted yellow line) quite clearly. The SMA100 (yellow) and SMA200 (red) have also obviously figured quite prominently.
Note that DX is also approaching its channel midline.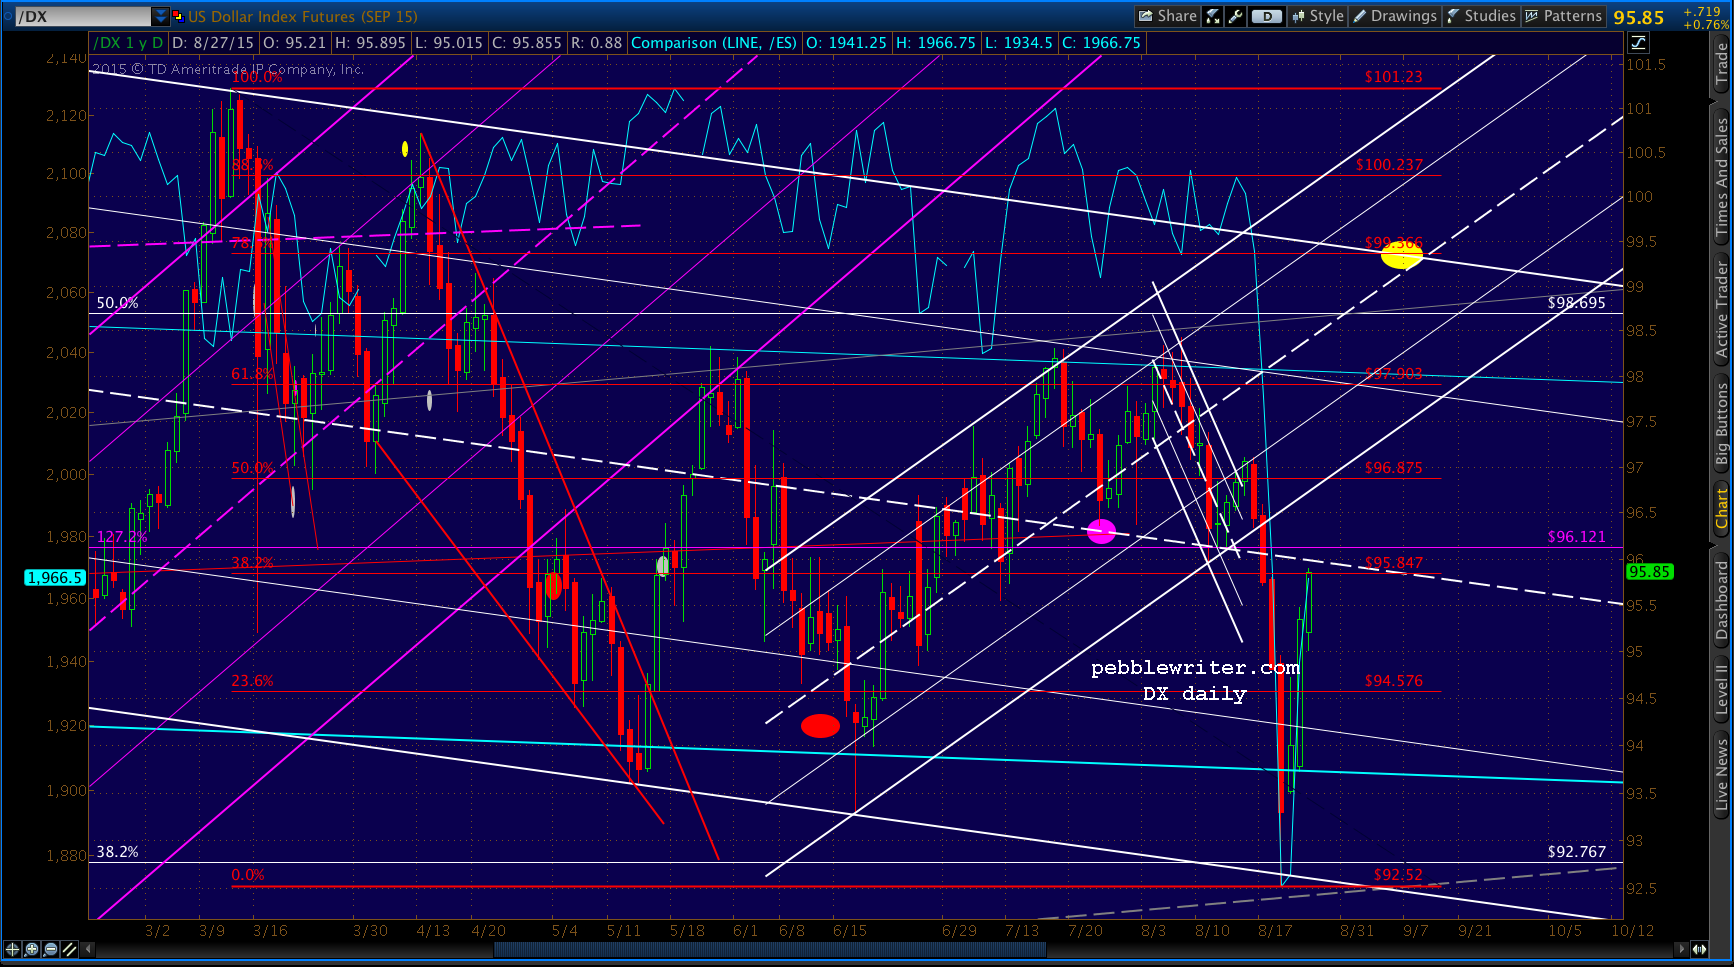 UPDATE: 9:42 AM
 UPDATE: 11:10 AM
 UPDATE: 12:06 PM
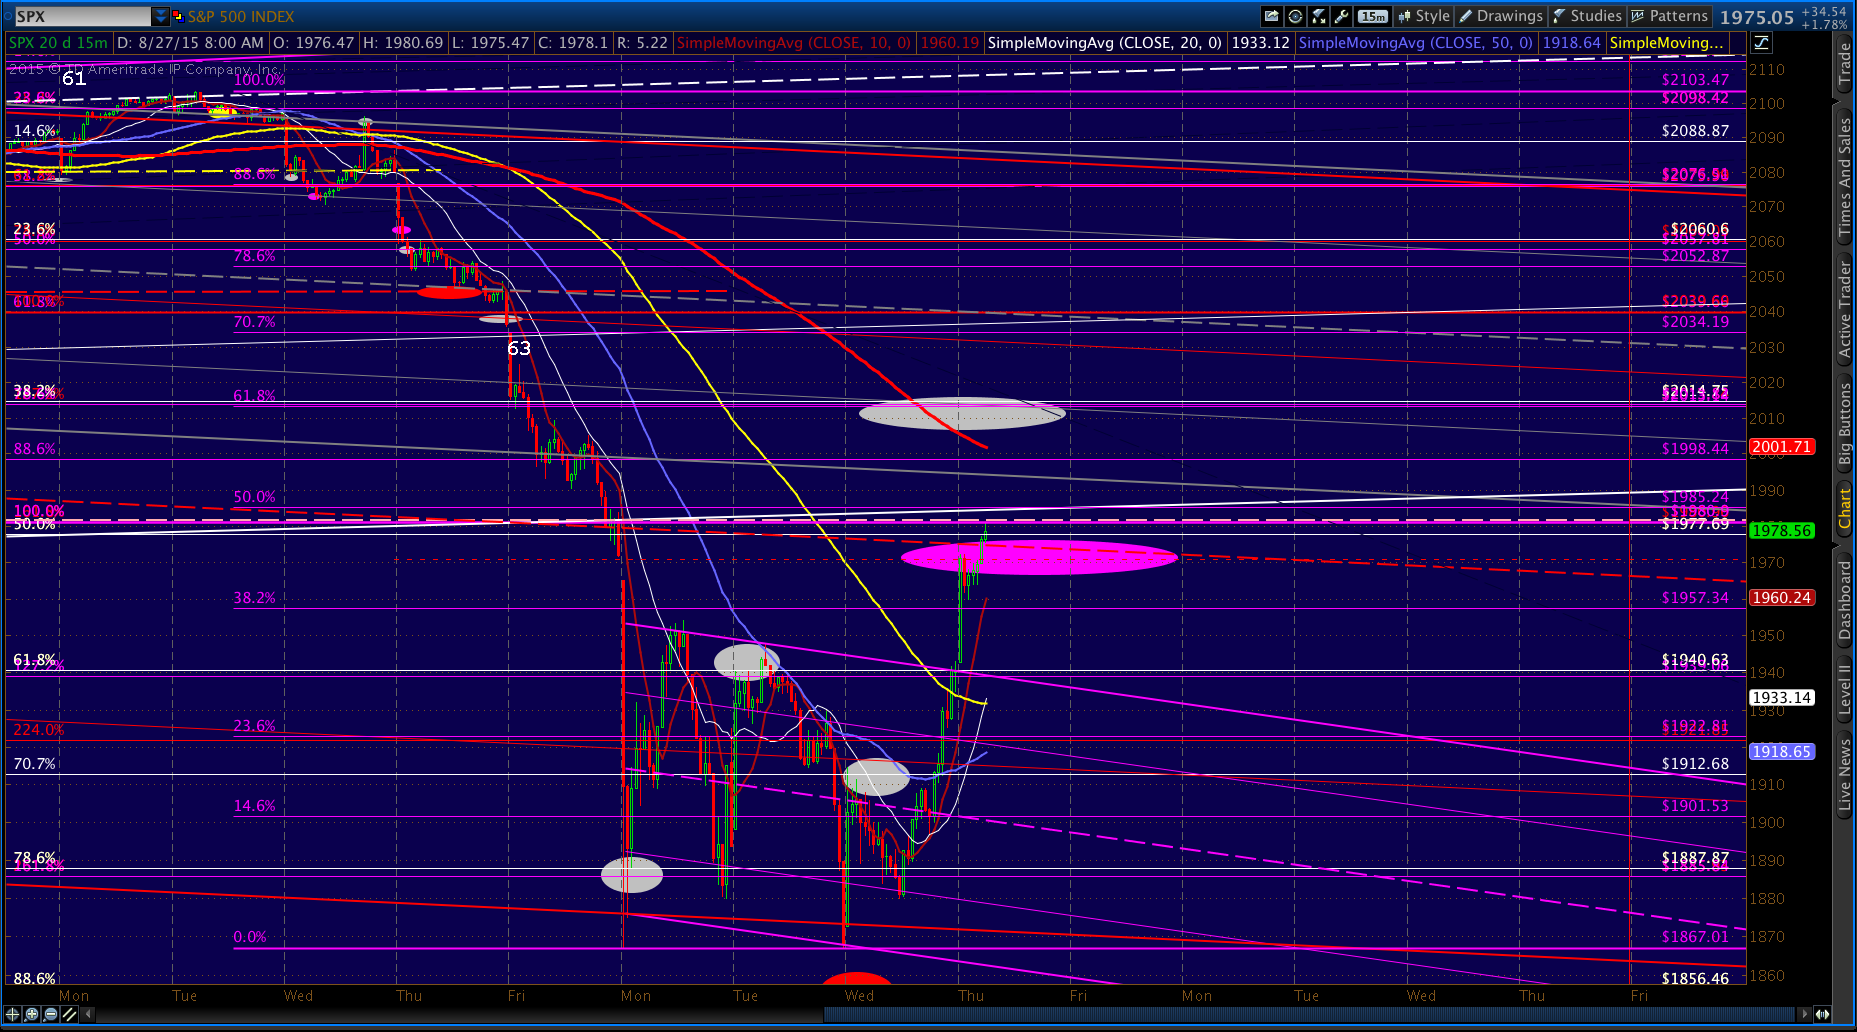
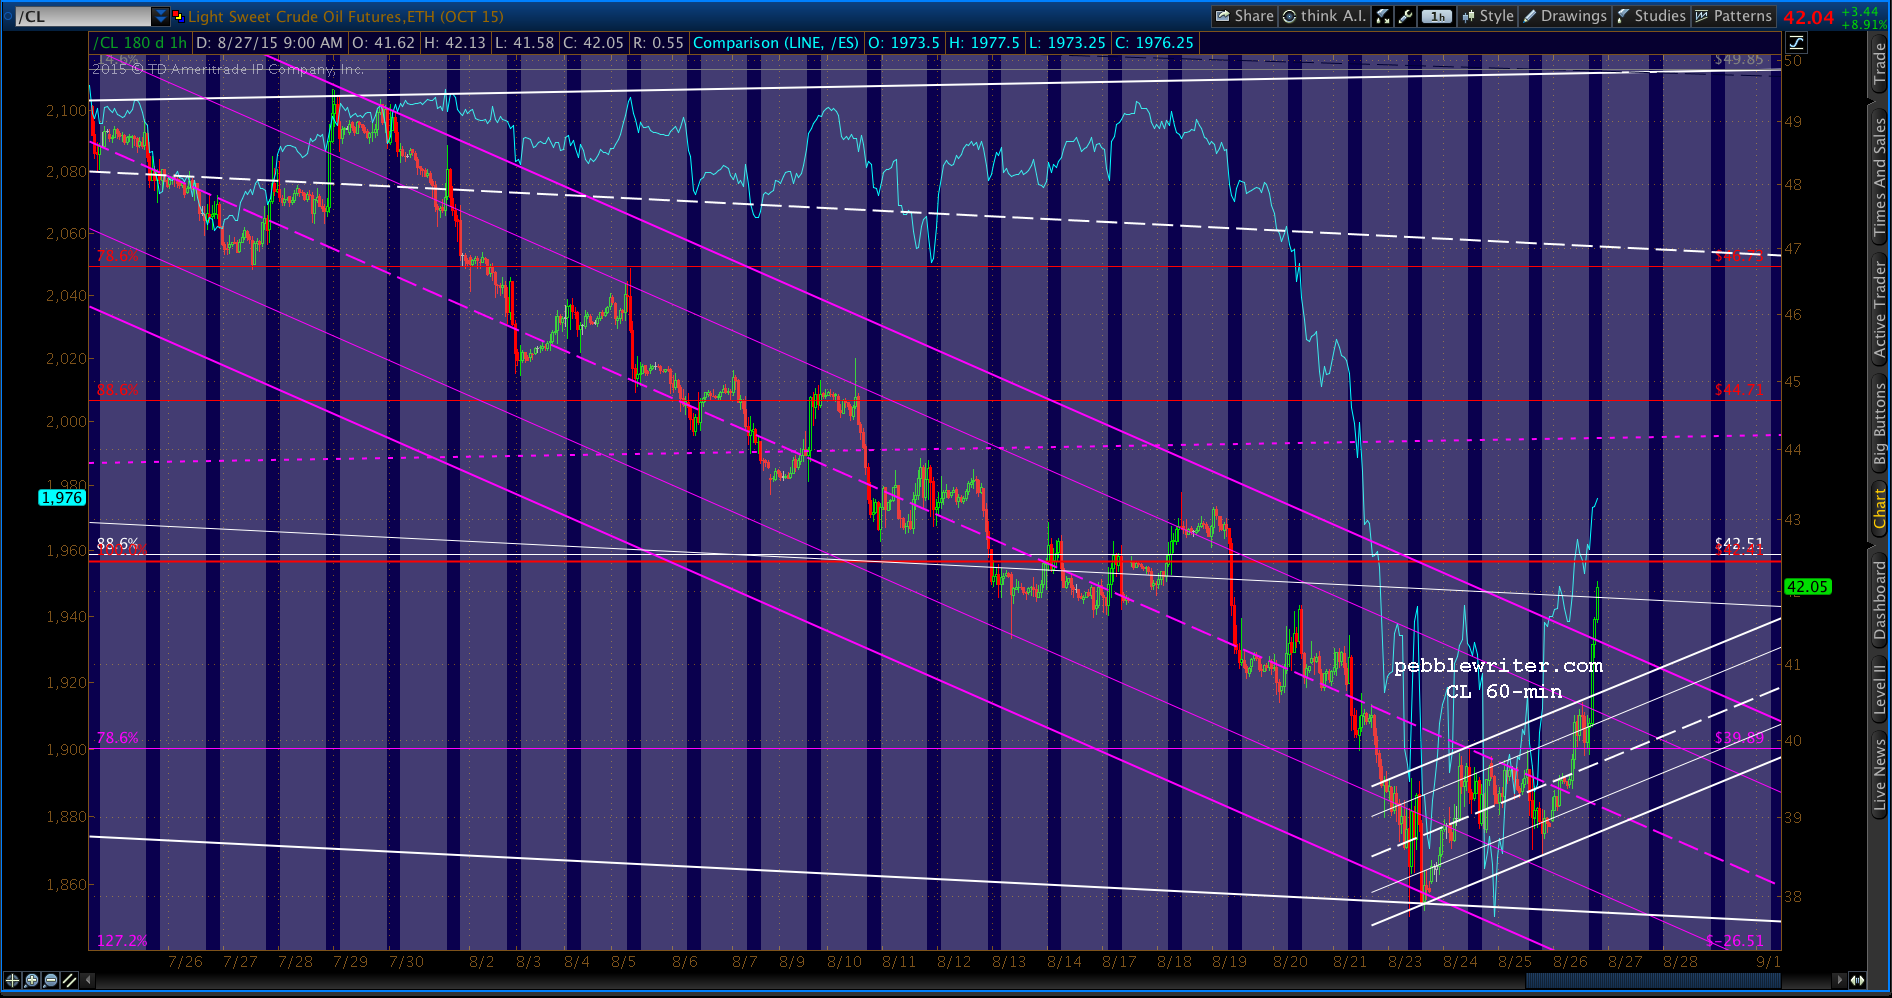
USDJPY continues to push higher, as does CL. They’re both running into overhead resistance, and will likely reverse after the close – if not sooner. But, for now, SPX is following along. Nervous/nimble types might wish to cut their losses here at 1980, but I think this move will probably run out of steam by 1985.24 — the .500 Fib.
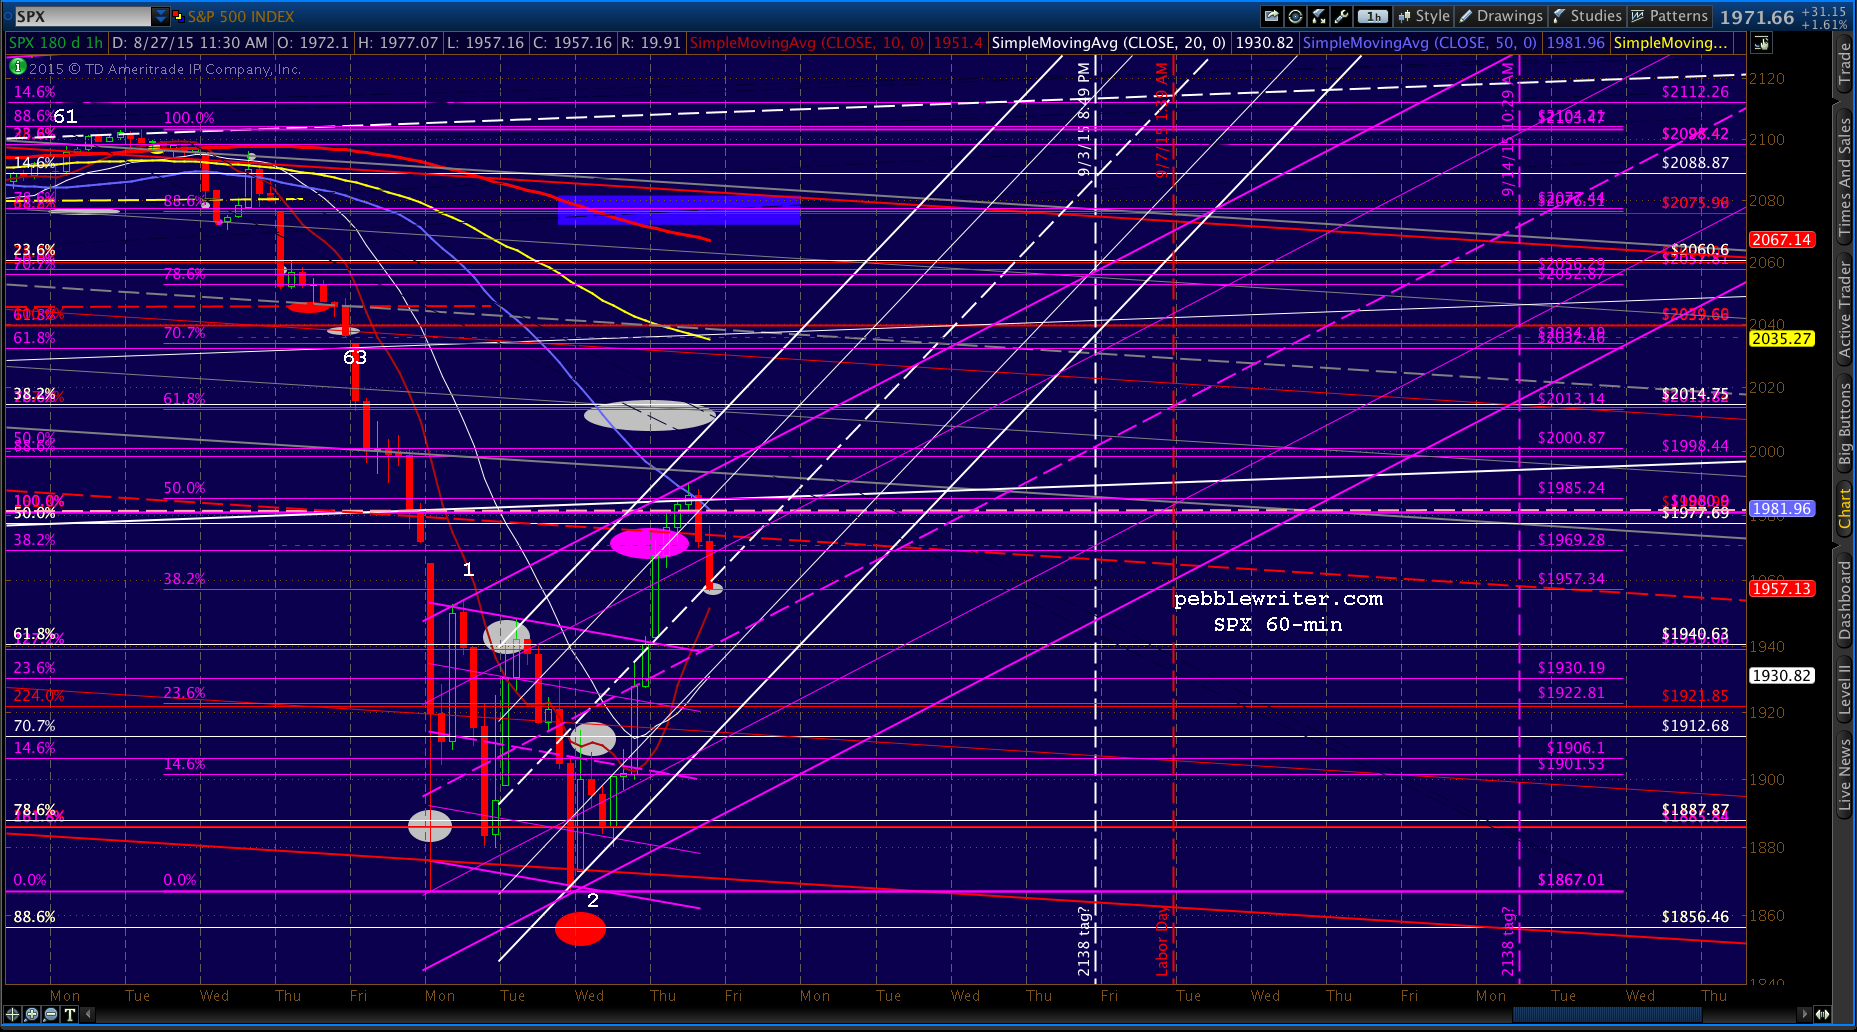
Note that I have drawn a couple of potential channels that get SPX to 2138 by 9/3 (white channel) and 9/11 (purple channel) — the two target dates we discussed a couple of days ago.
If 9/11 ends up being the correct date, then SPX just reached the top of the correct channel and should reverse. If it keeps going, it raises the odds of the white channel’s 9/3 being the correct timing for the 2138 tag.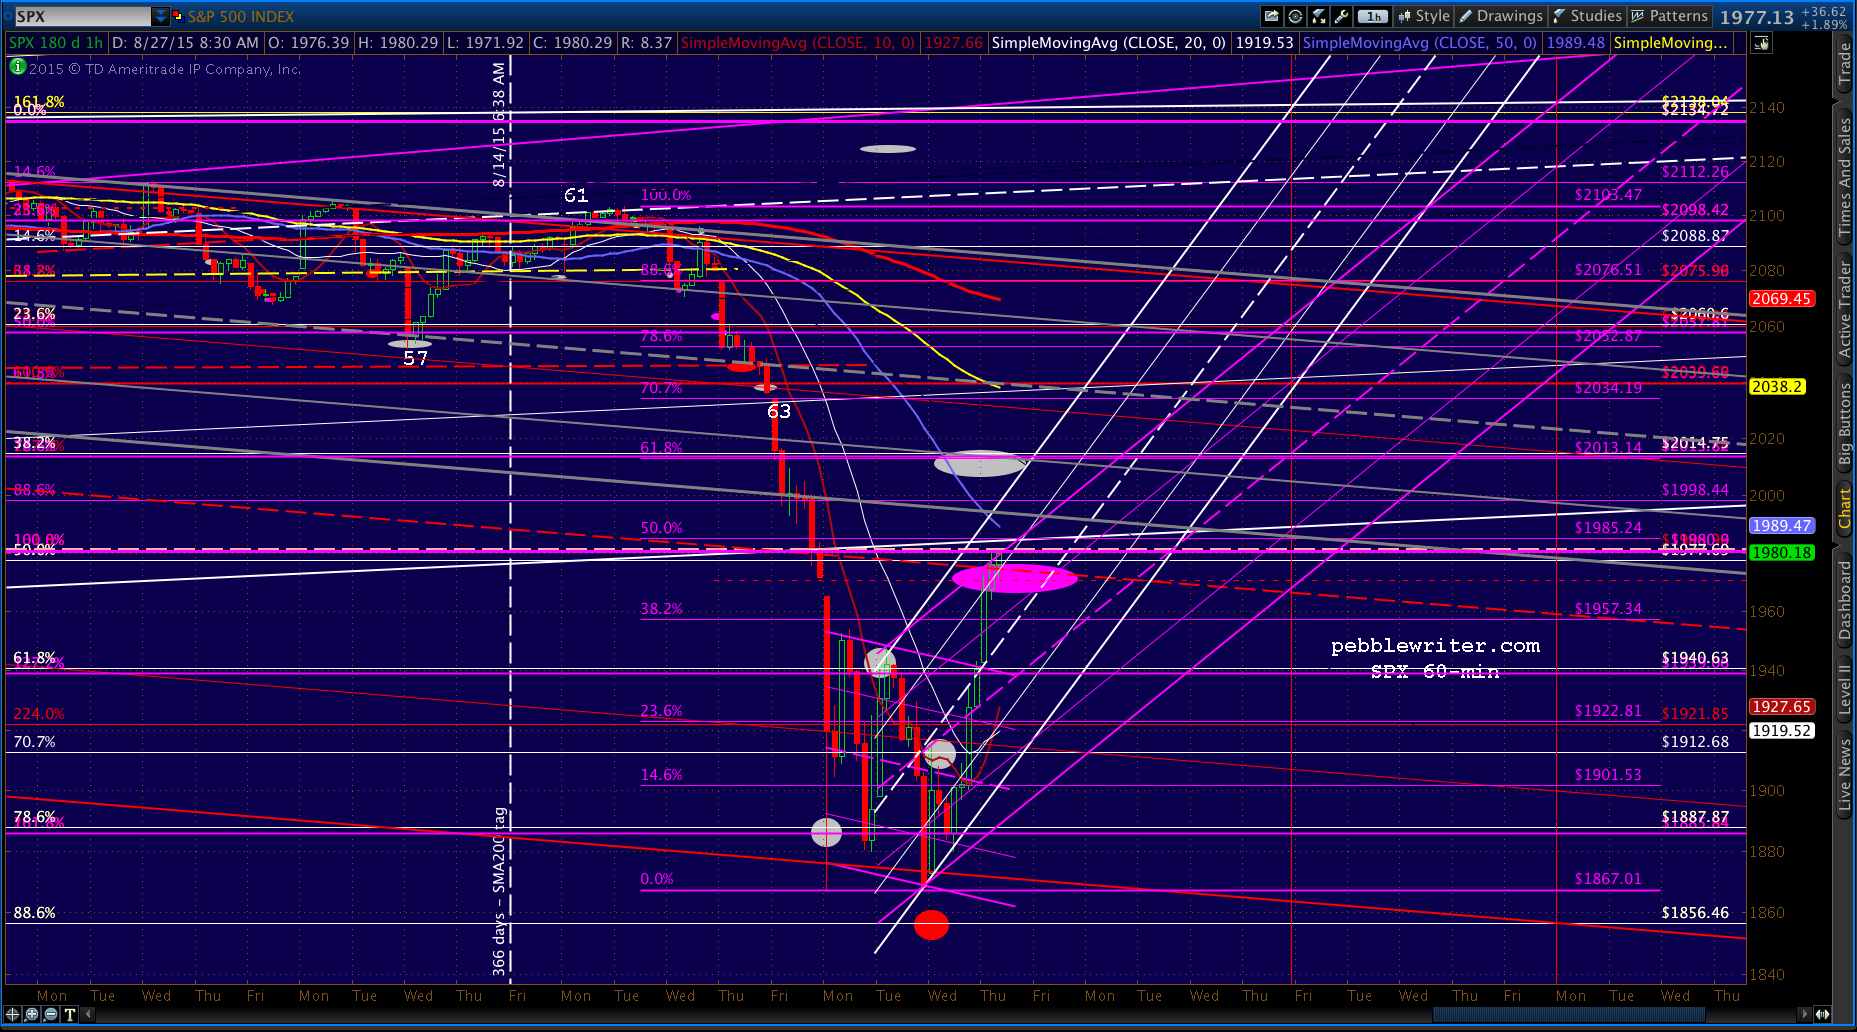
 UPDATE: 3:00 PM
 UPDATE: 3:20 PM
SPX broke down below the .382 at 1957.34 and appears likely to reach the 1940 target — perhaps with USDJPY’s backtest of 120.11.
I’d be short here at 1958, with an objective of 1940 and relatively tight stops.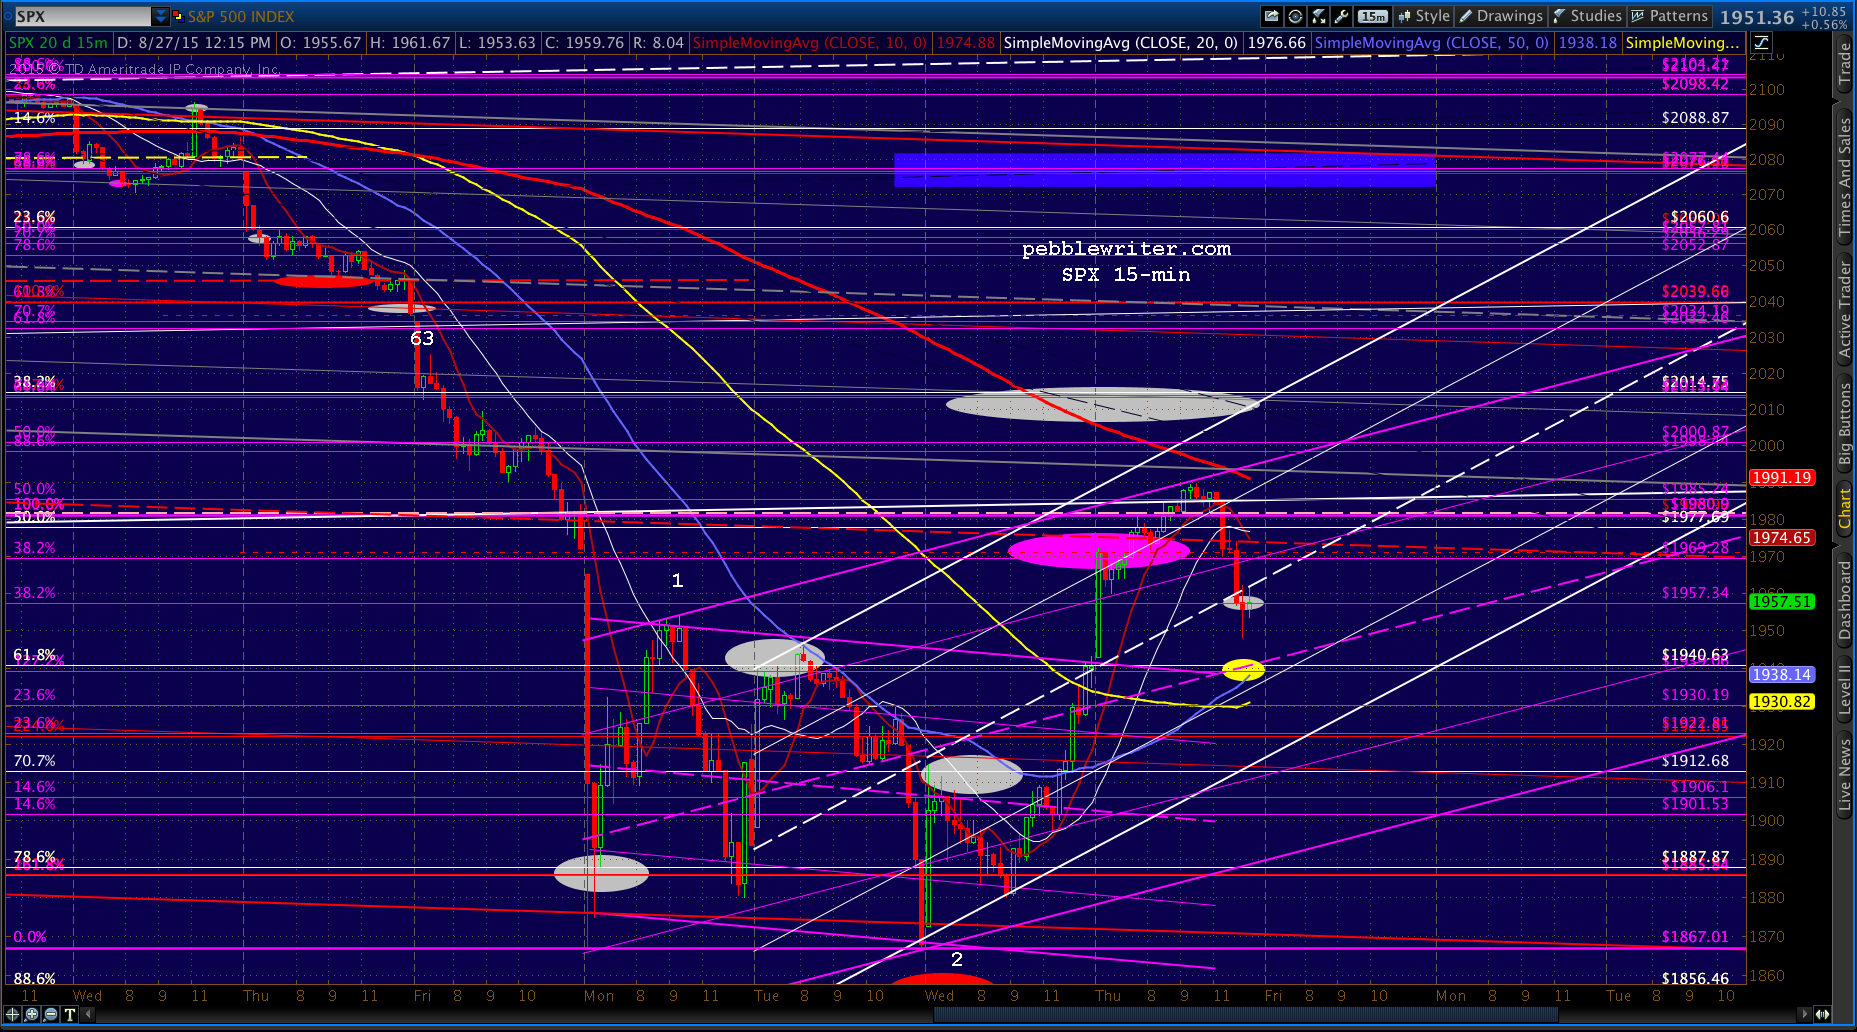 Why tight stops? NKD and USDJPY are both backtesting support and could really help the bulls by lifting off here.
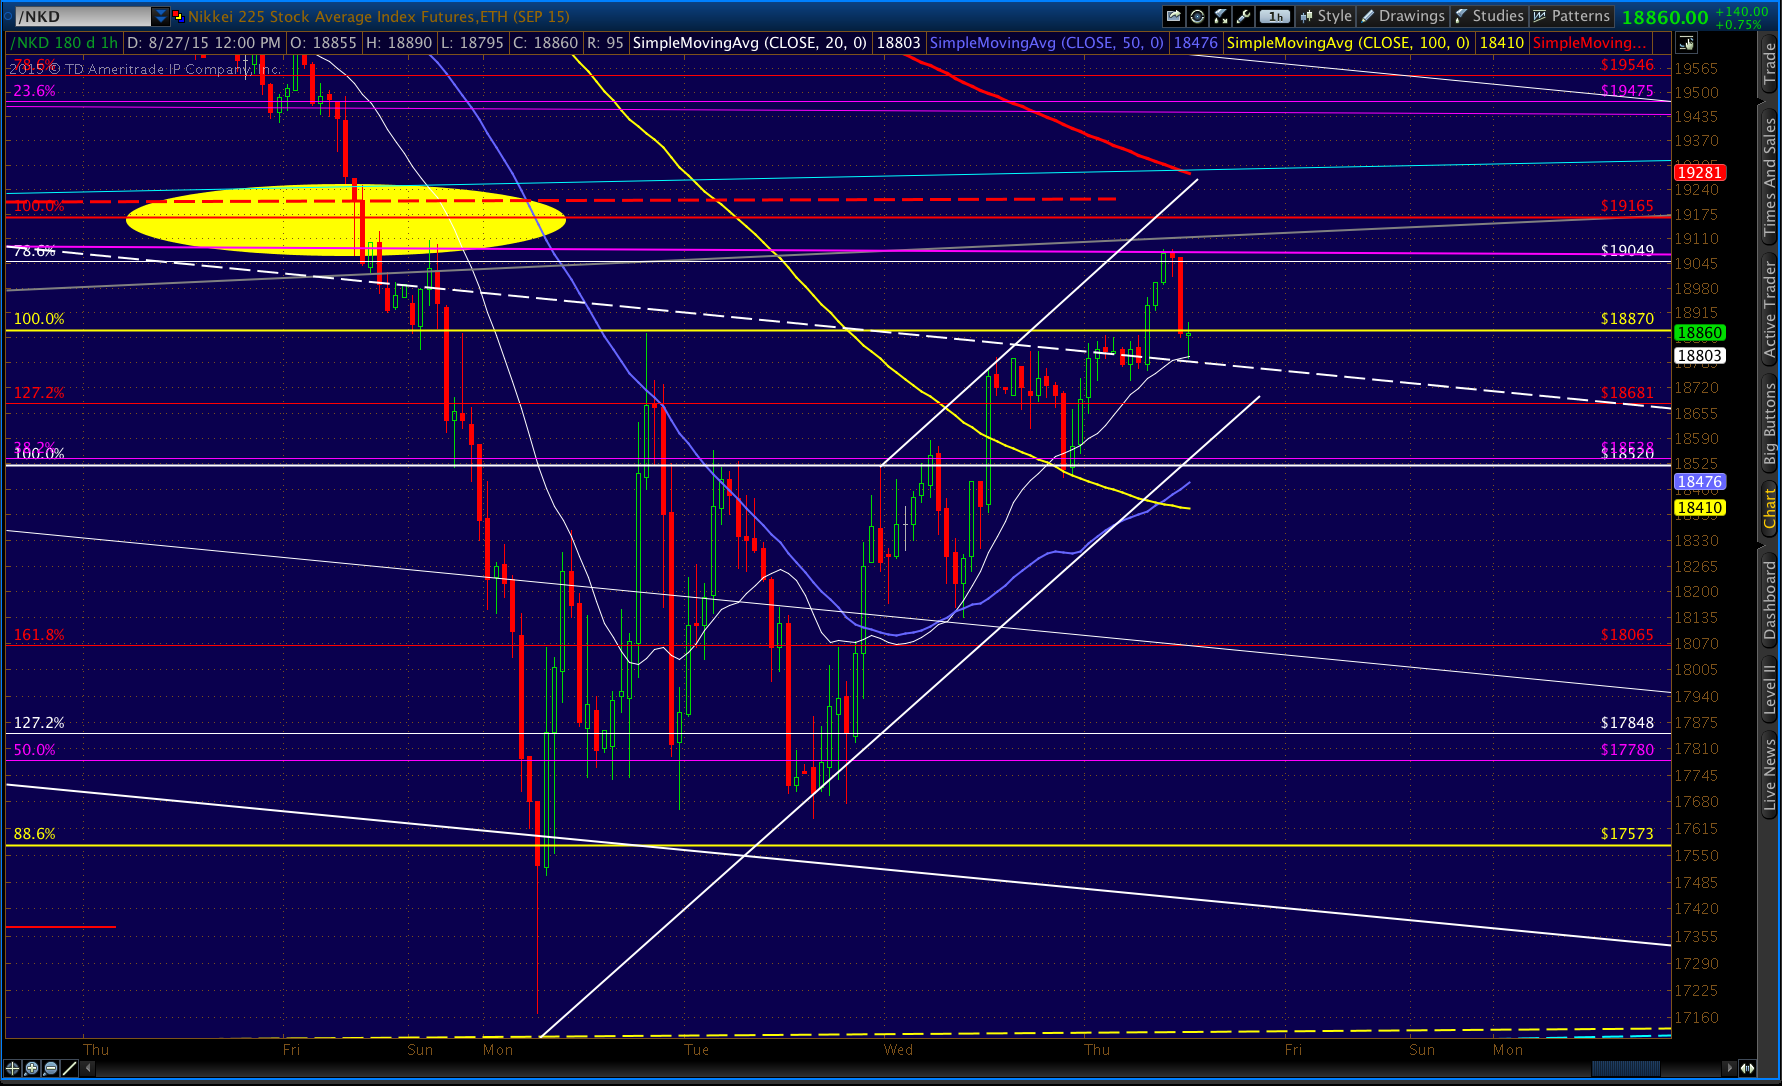
 UPDATE: 3:30 PM
Stopped out at 1960, but would go short again here at 1969.28 – the .786 purple channel line with the midline at 1940ish as objective at the close or tomorrow’s open.
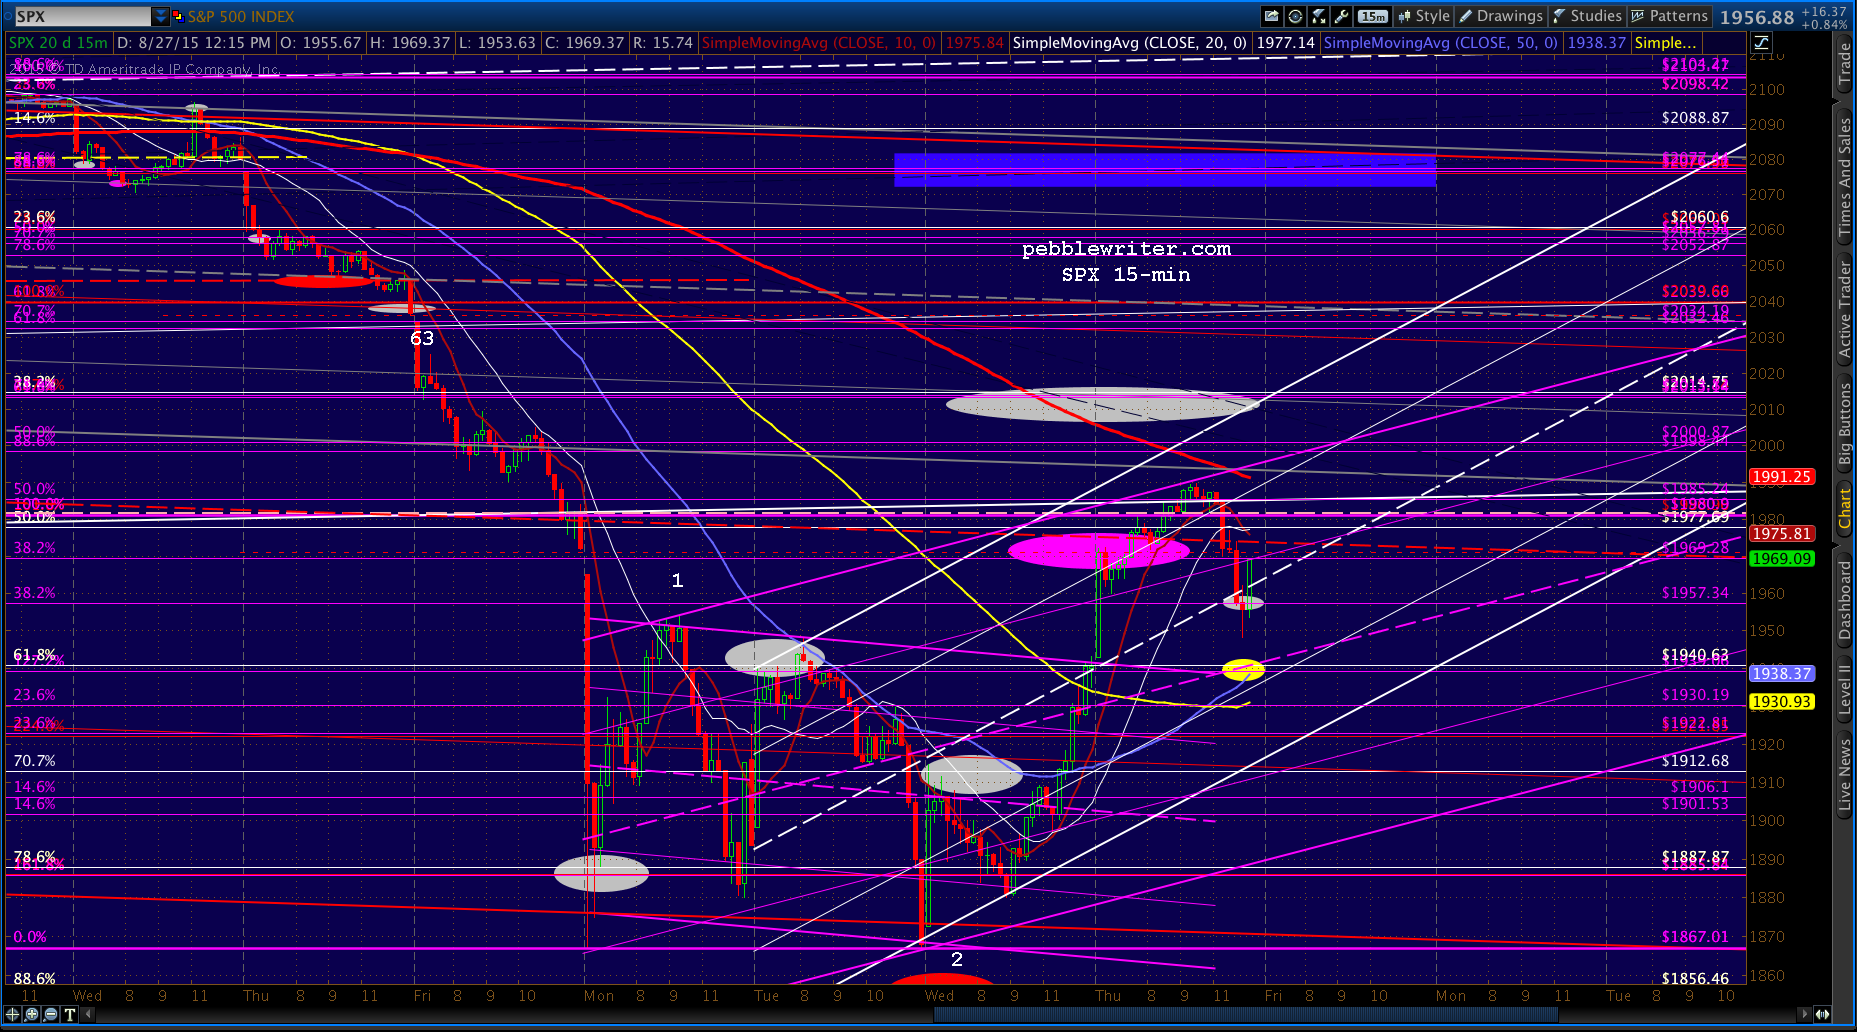 If it doesn’t play out that way, then the purple channel is probably not the horse we should be riding. A sustained push through 1977 probably means a sprint up to 1995 or 2014.
If you’re a swing trader and don’t care about the intra-day stuff, just hold on for 2138 in the next 2-3 weeks.