

A reminder: From August 25-29, we’re offering Charter Annual Memberships at $950. It works out to about $2.60/day, less than a cup of coffee.
It’s $550 off a regular annual subscription (slated to rise to $1,500 by the end of the year), and a whopping $1,150 off a monthly subscription at the current rate of $175/month (which will increase to $200/month.)
Best of all, your rate will never increase for the life of the site for as long as you remain a member. To sign up now, click HERE.
* * * * *
The recovery from Monday’s lows is right on track, aided by two reliable friends USDJPY and CL. In fact, yesterday’s action was the most such aid the “market” has had in months.
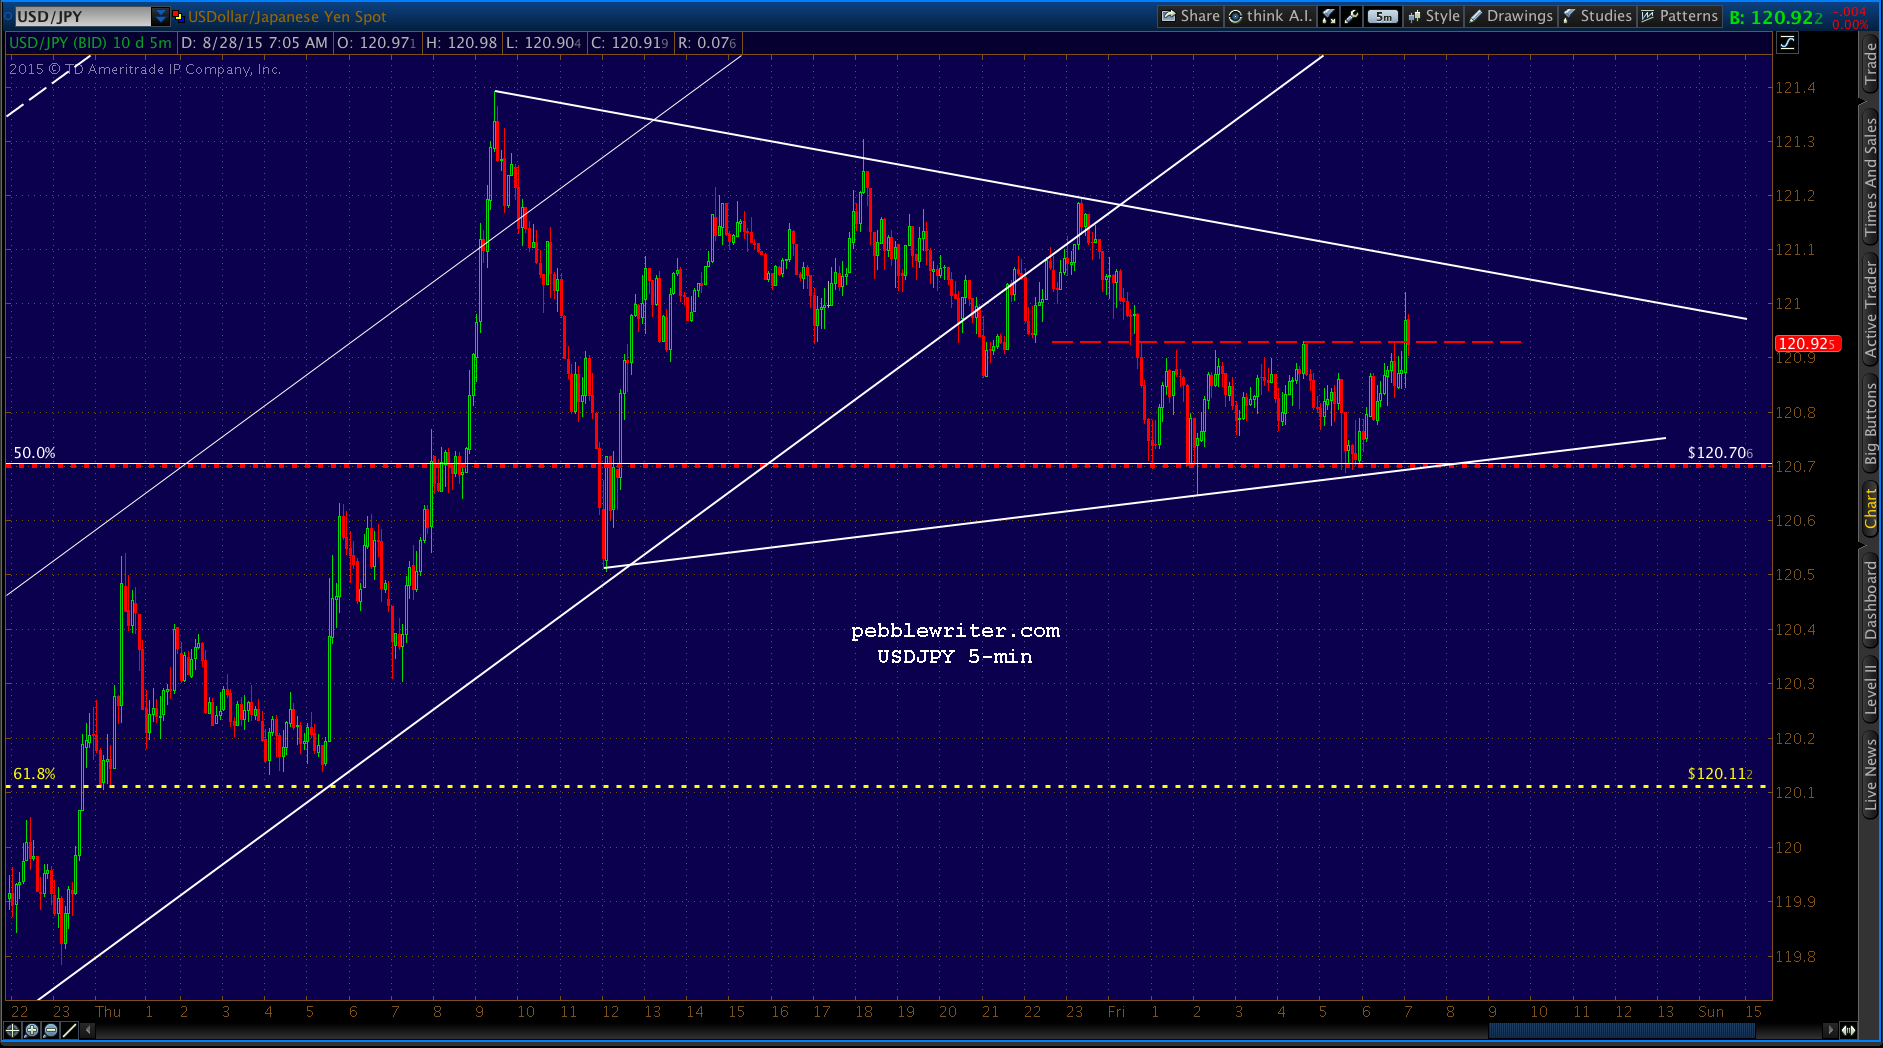
For its part, USDJPY ran a very rigged orderly recovery back above the .618 Fib at 120.11 and the SMA200, where it remains this morning. Funny how that happened. continued for members…
CL broke out of the channel it’s been in since mid-July. This is very significant, as it breaks a solid trend. But, note that it merely backtested the .886 Fib. In other words, it indicates there won’t be any further help to SPX from additional gains.
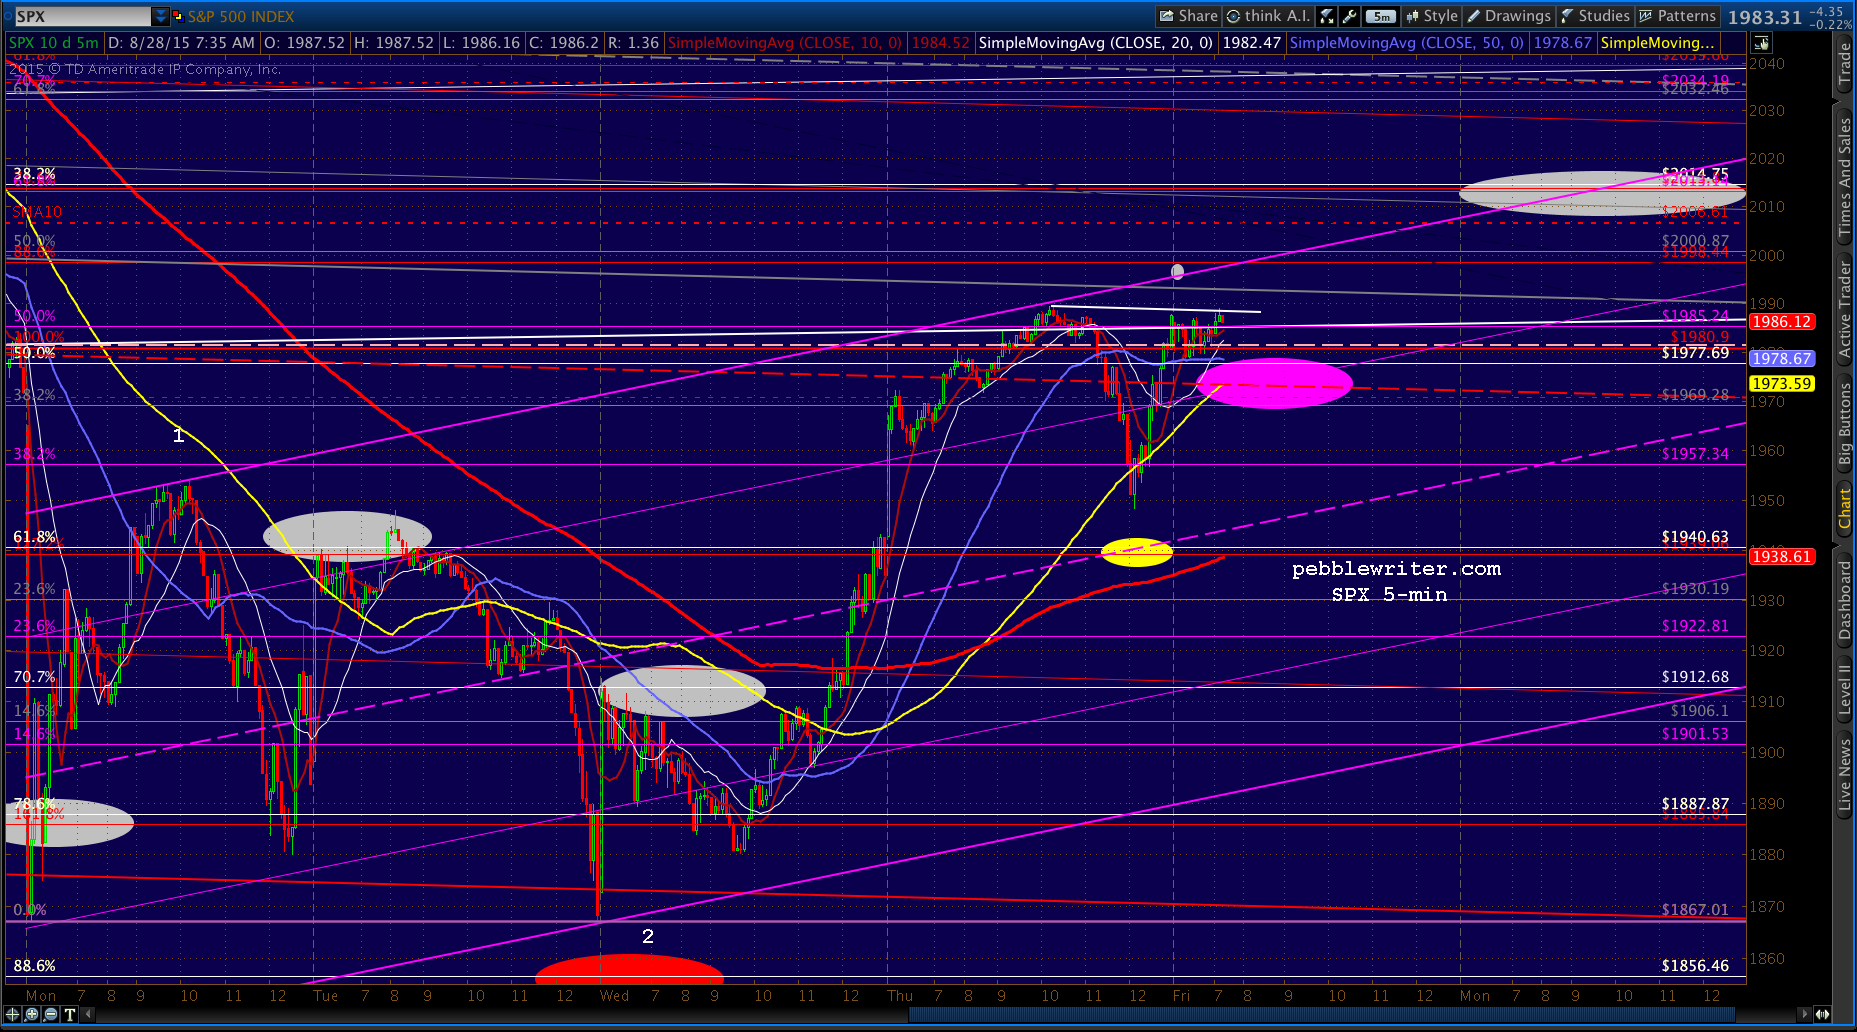
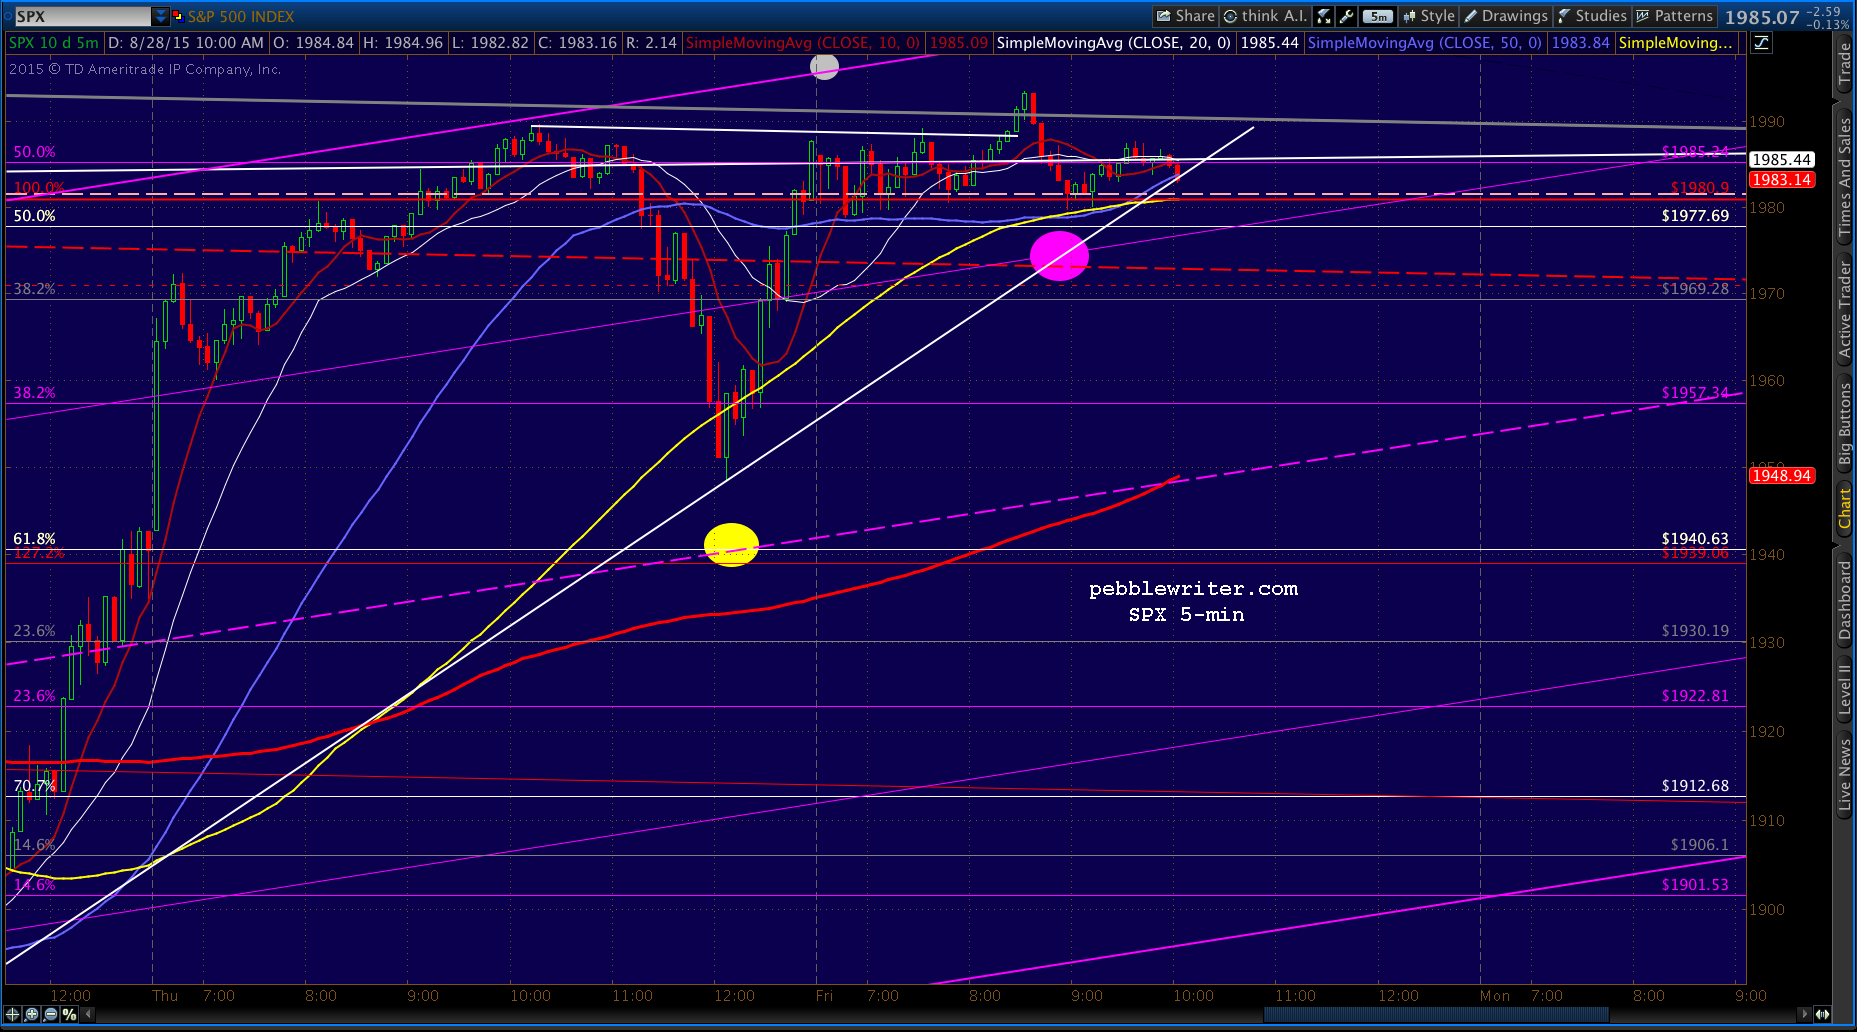
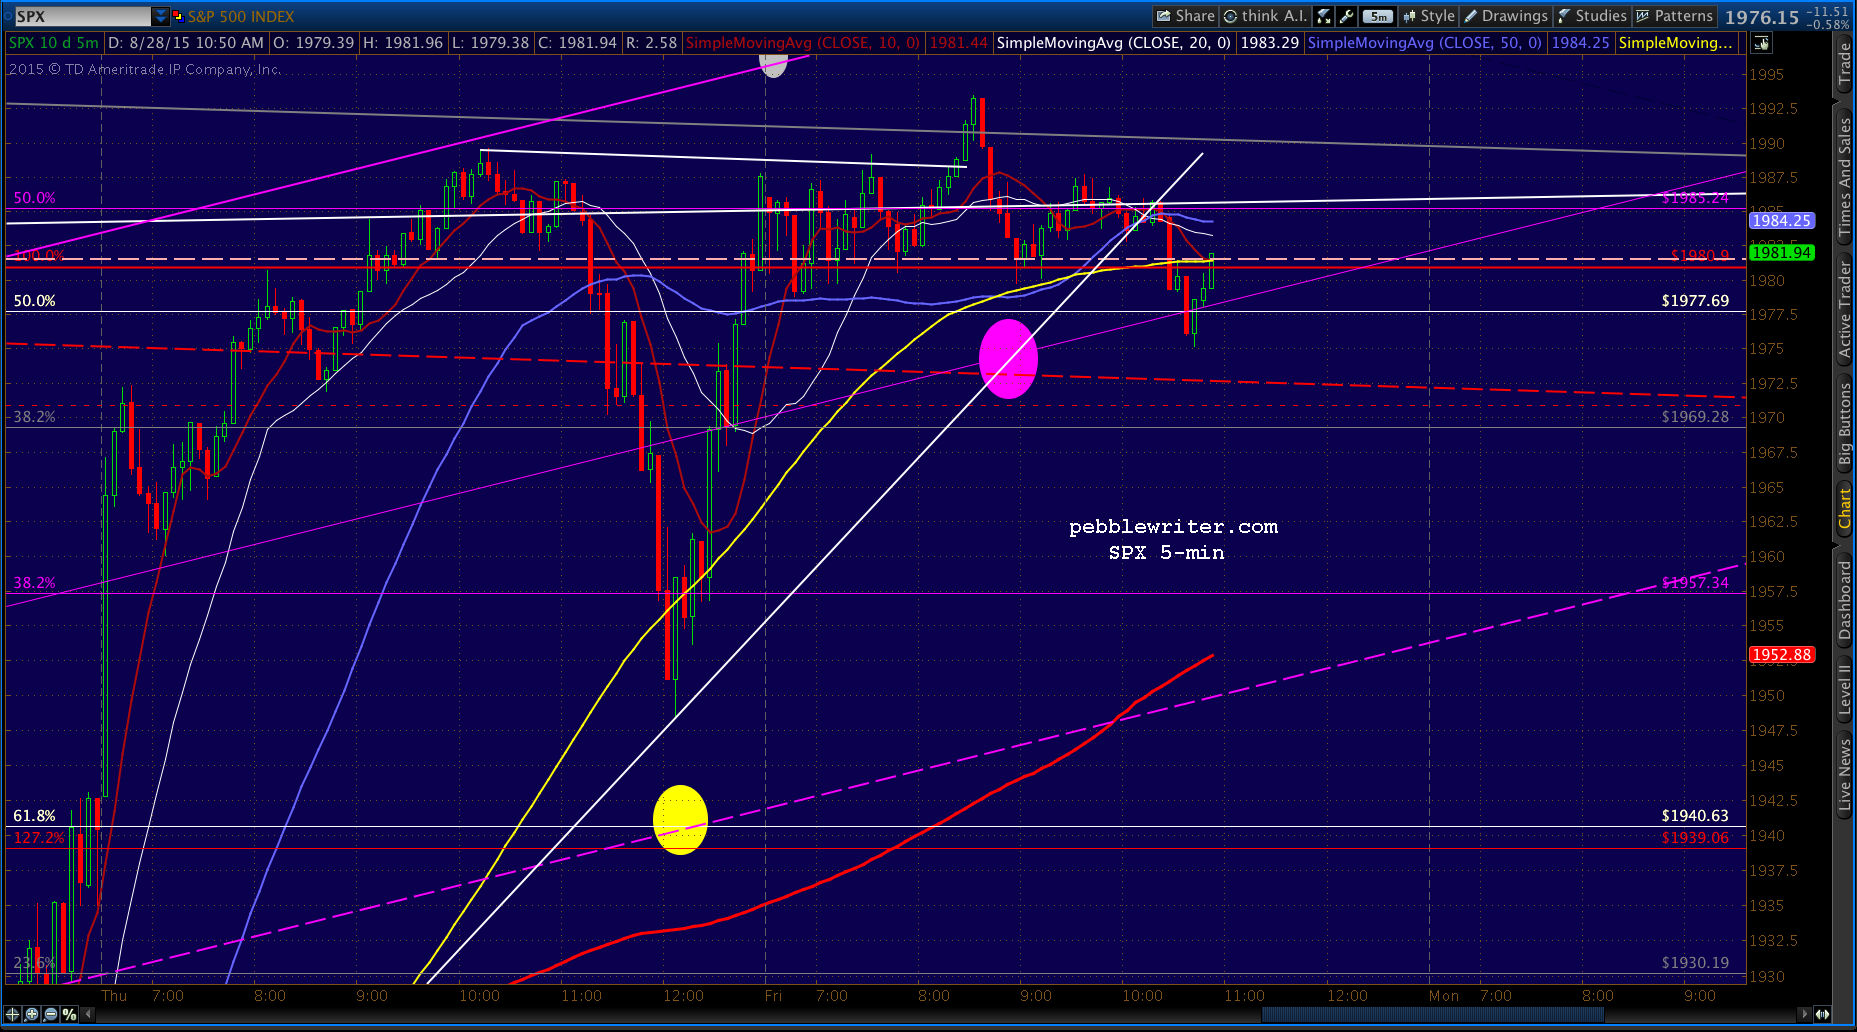
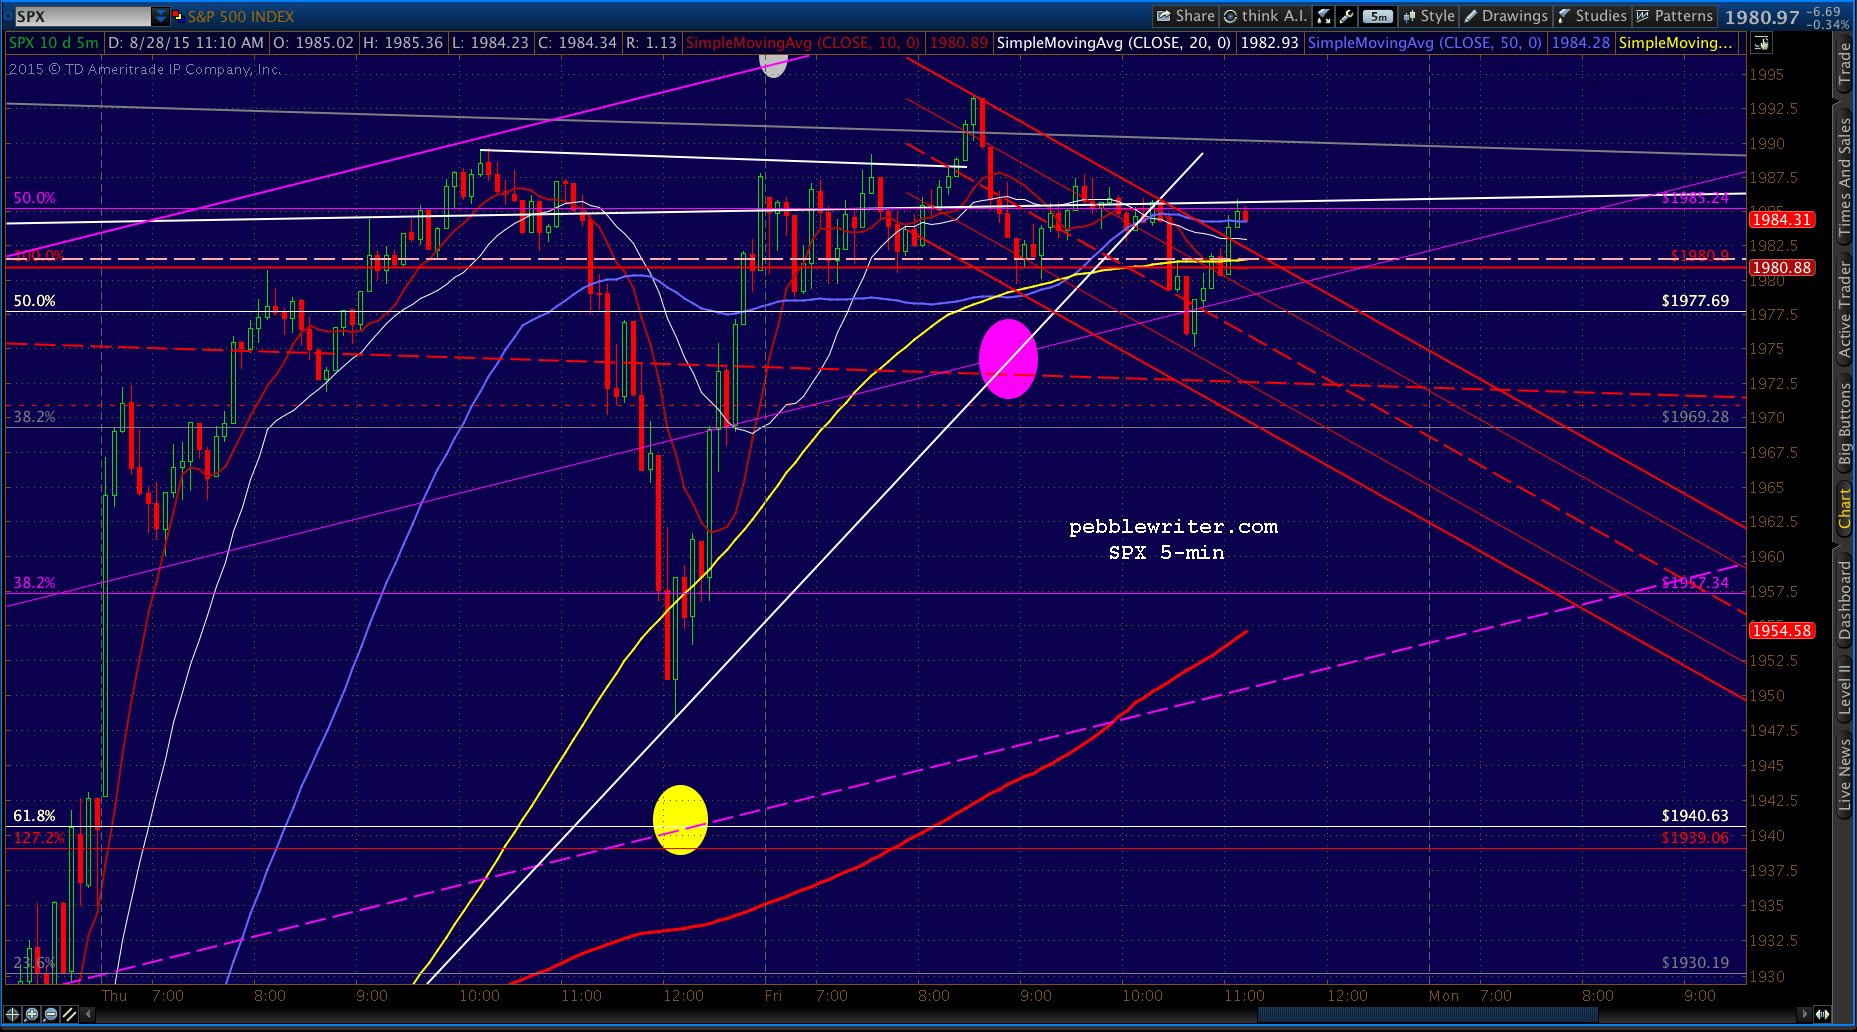
On the other hand, its decline last night stopped at the falling white channel .236 line — which indicates it might be done falling. The carrot and the stick in plain view, as it were.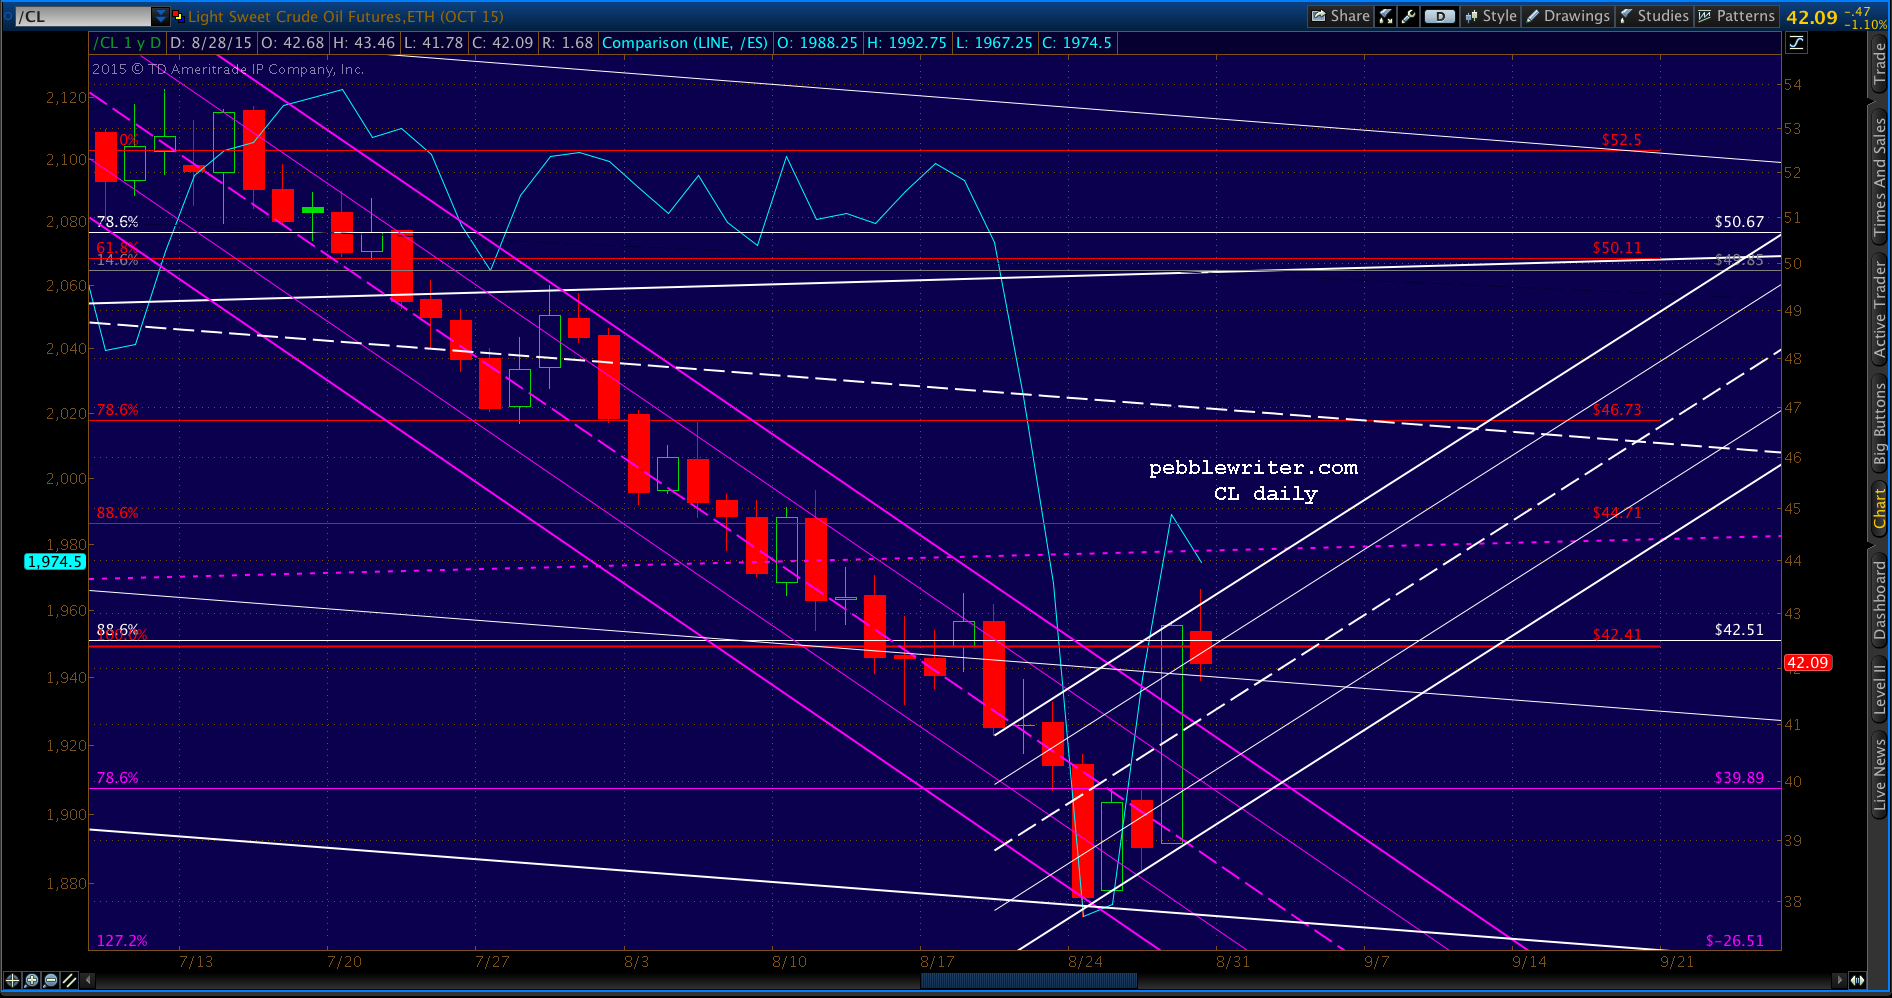 Look for SPX to decline to backtest the red channel midline, but possibly no more unless USDJPY drops below the SMA200. I show it as being around 1973, but I suspect they’re probably targeting the SMA10 (red) on the 60-min chart, which is currently at 1969.25 and gaining fast.
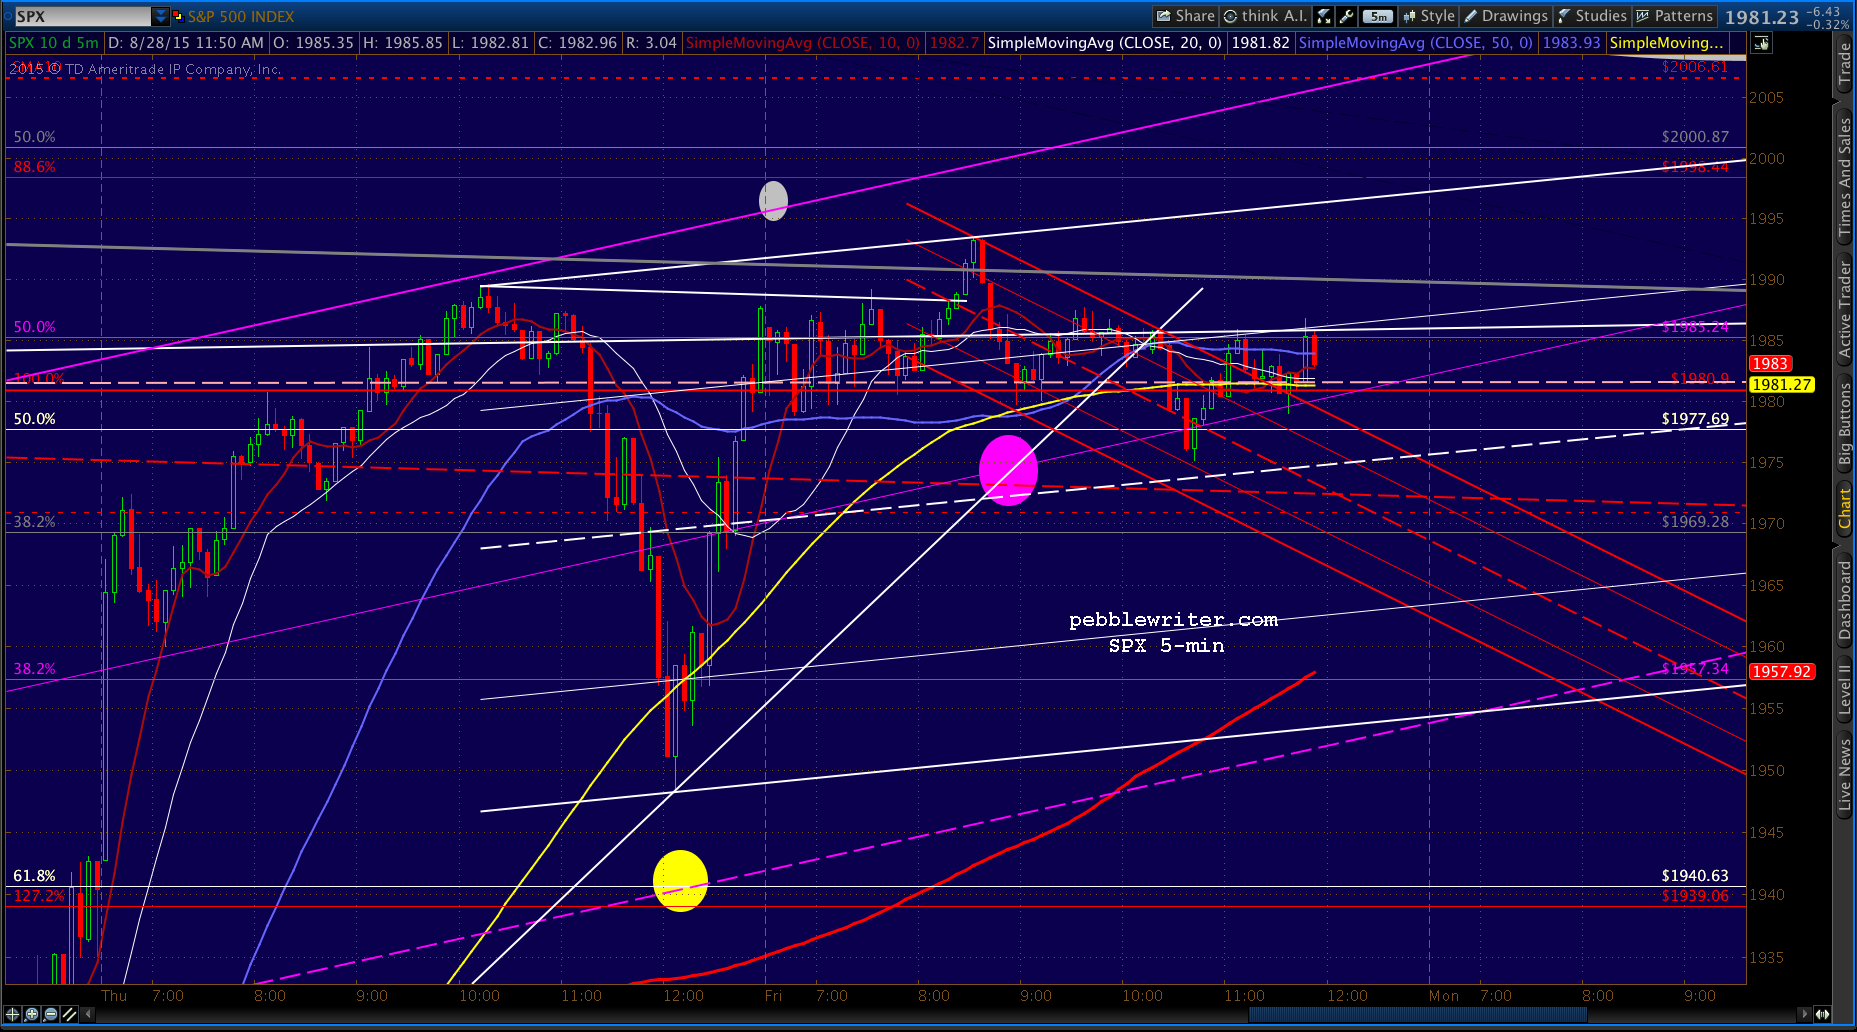
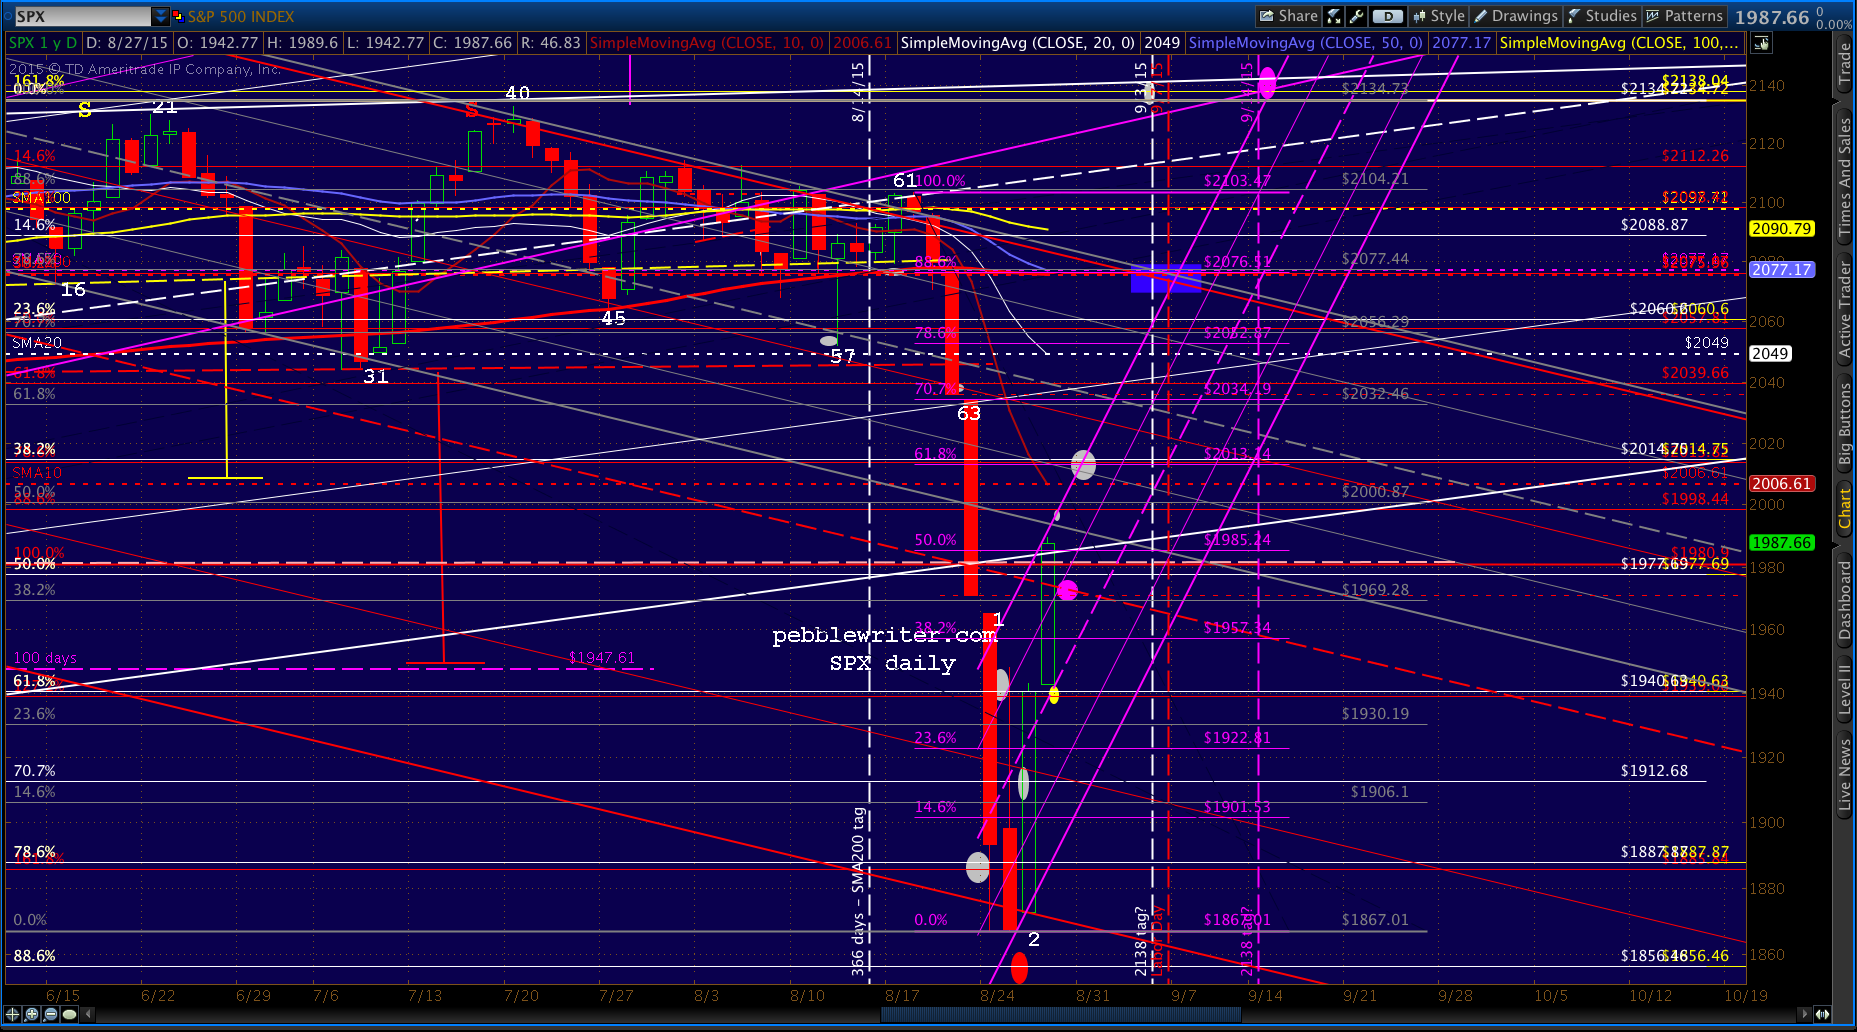 Note that I’ve dropped the white channel in favor of the purple for the tip back to 2138. I’ve also added three time markers: the Sep 3 tag of 2138 in white, the (preferred) Sep 14 tag in purple, and Labor Day on Sep 7 in red.
Recall from earlier in the week that our analog suggests a 21 day time frame after USDJPY’s SMA200 tag, but it’s unclear whether to start the 21 days from the original analog date of 8/13 or the date when it actually occurred: Aug 24.
I favor the latter only because it allows the Labor Day holiday to come into play. It would be an excellent time frame within which to boost SPX out of the falling red channel. It would also work, of course, for boosting it over 2138. We’ll get a better sense as we draw closer.
Although USDJPY’s positioning is obviously completely artificial and contrived, it does provide a pretty good indicator as to what the riggers have in mind today. If it dips below 120.706, they’re trying to nudge SPX lower. If it breaks out, then they’re trying to arrest a drop or nudge it higher. It’s sophomoric, I know, but it’s how things work these days.
UPDATE: 10:12 AM
A closeup of USDJPY’s silliness. The fact that the rising white channel broke down is moderately bearish — enough to produce this morning’s dip in the futures. But, it’s all still intraday, meaning that it could pop right out of the triangle that’s forming and rejoin the channel later.
 Alternatively, it could be used to help engineer a head fake. A dip below the SMA200 or the .618 at the close would set up a decline that is easily reversed over the weekend.
More later…
UPDATE: 10:30 AM
USDJPY is threatening a breakout of the triangle, suggesting SPX is heading higher. But, watch out for headfakes. This is exactly the sort of setup that predatory HFTs love. They prey on chart pattern and harmonic followers, knowing that they can be counted on to jump on obvious patterns. Soon as they (in this instance) go long, the HFTs pull the rug out from under, slamming USDJPY lower and catching traders on the wrong side.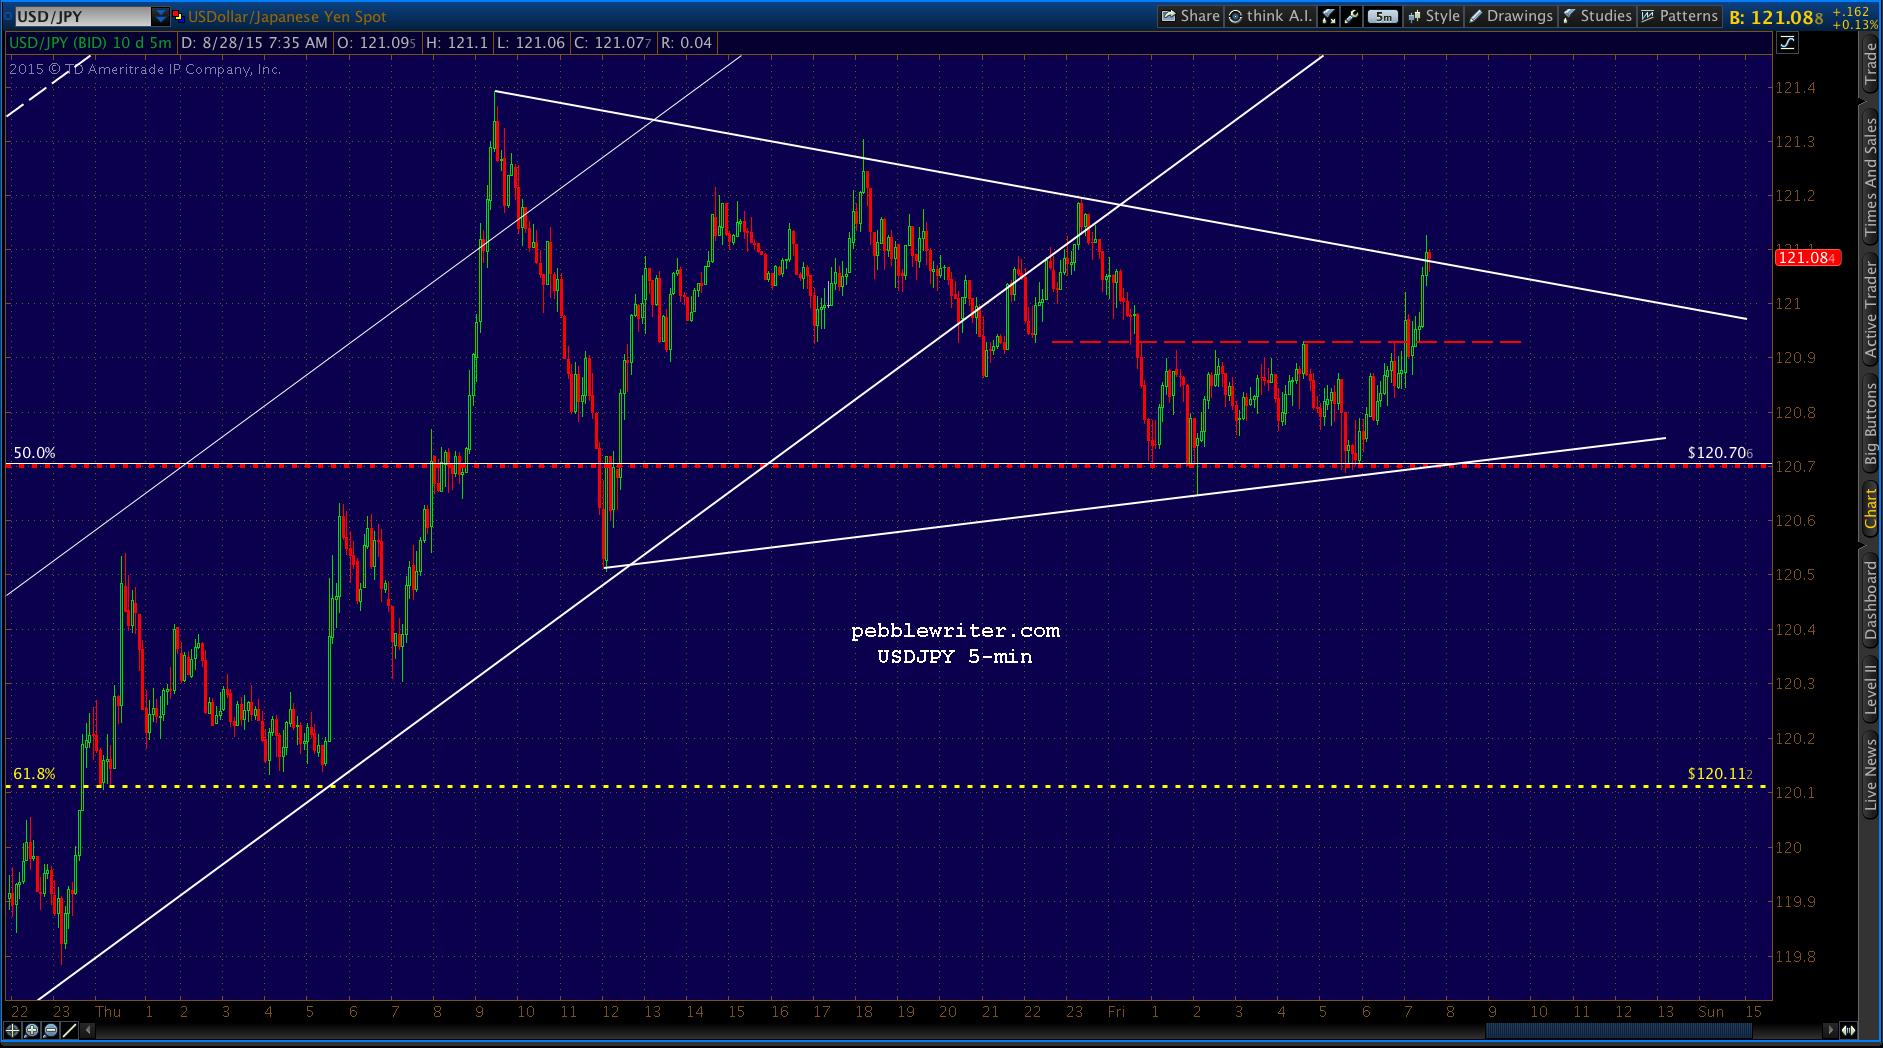
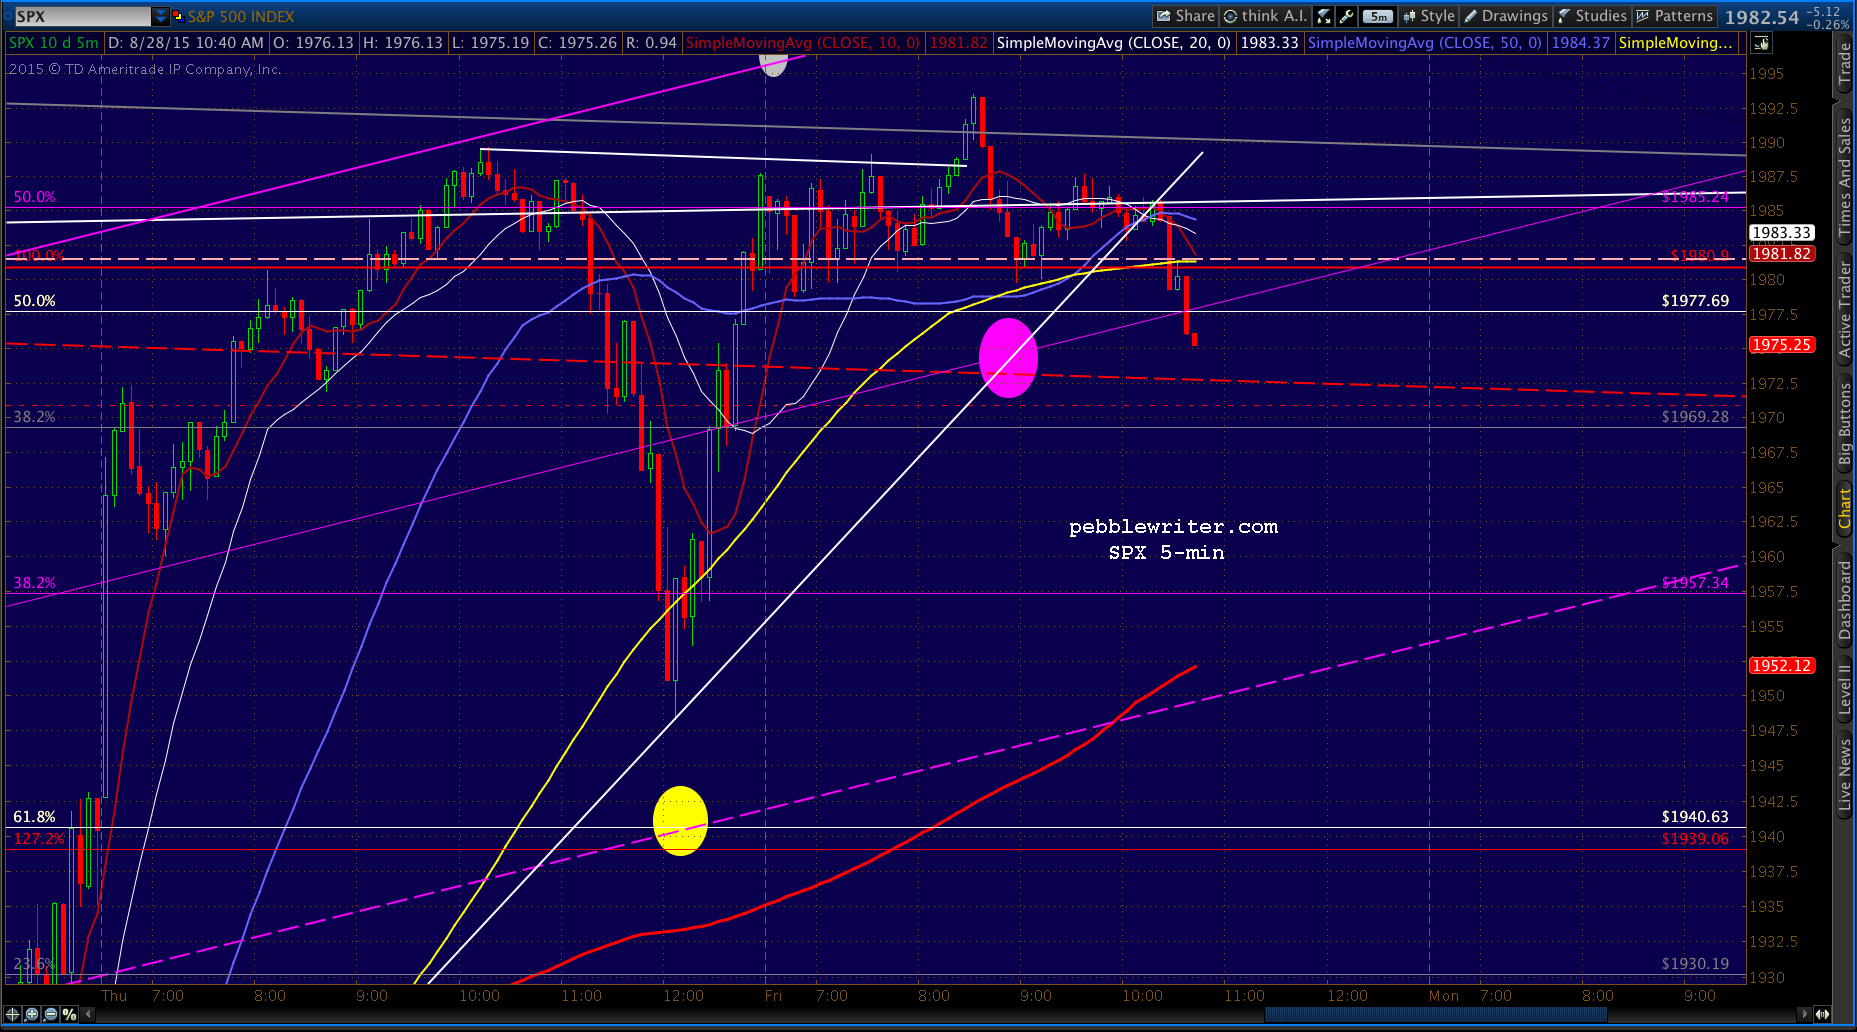
 If I’m right about the purple channel, there isn’t that much upside at this moment. Later in the day, sure; but, at this moment the top of the channel is 1998.40 or so. It would make more sense to go sideways back down to the purple .382 or maybe even the purple midline before attacking the SMA10 (2007ish) later in the day.
UPDATE: 12:28 PM
Not much of a decline yet, but several headfakes that went nowhere. But, the white TL from the bottom is coming up. Chances are it’ll push SPX higher, so prepare for a long here.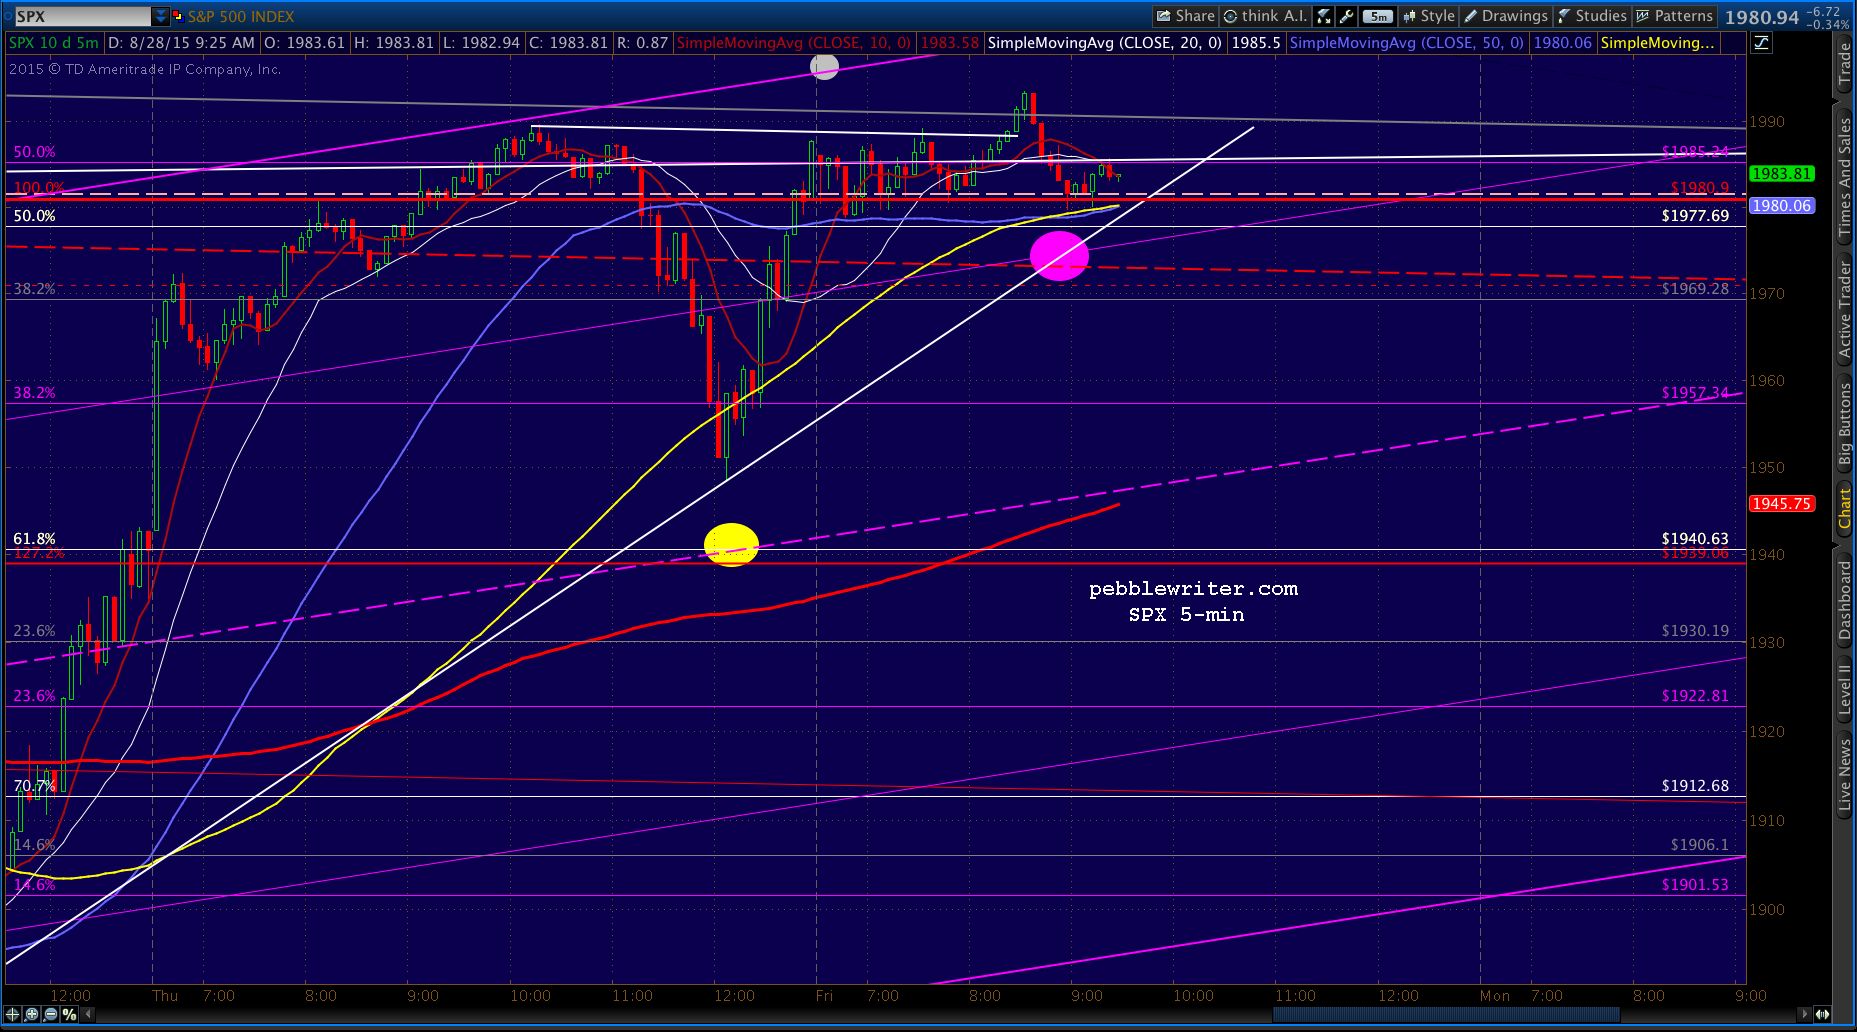 USDJPY has broken out of and backtested the triangle — though it’s taking its time in actually doing something.
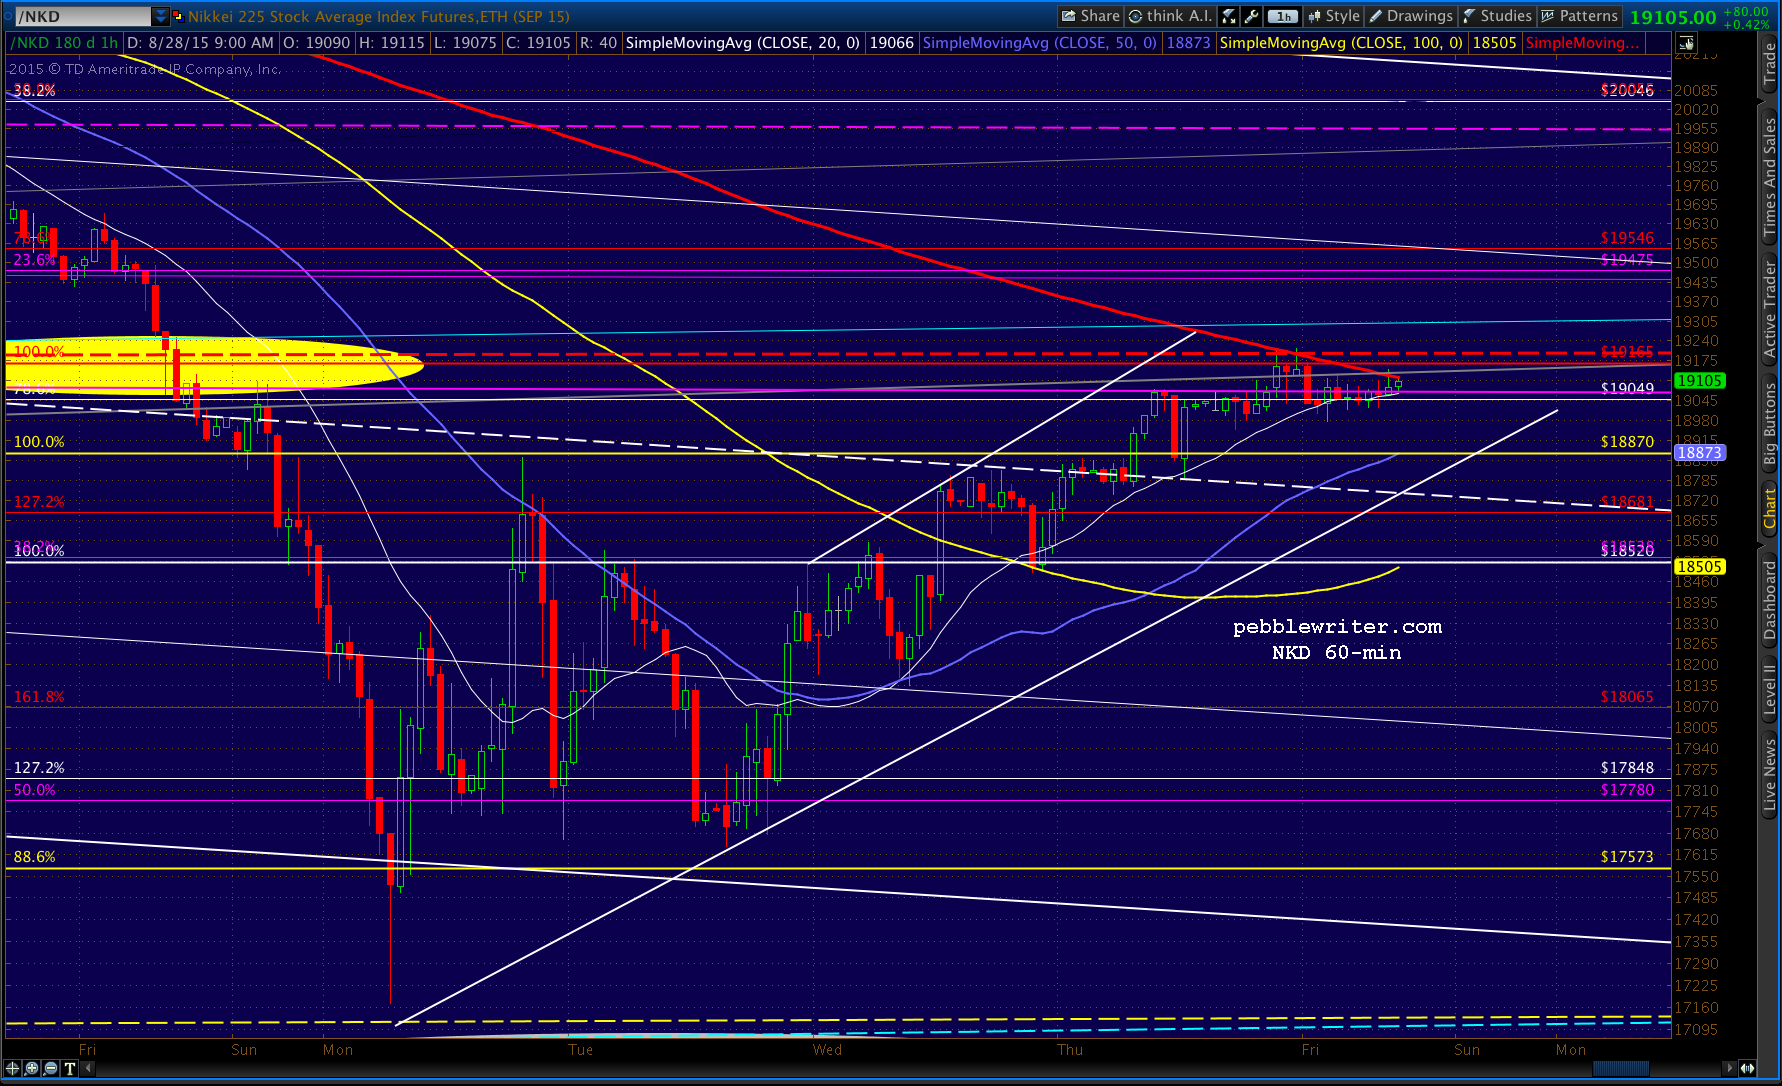
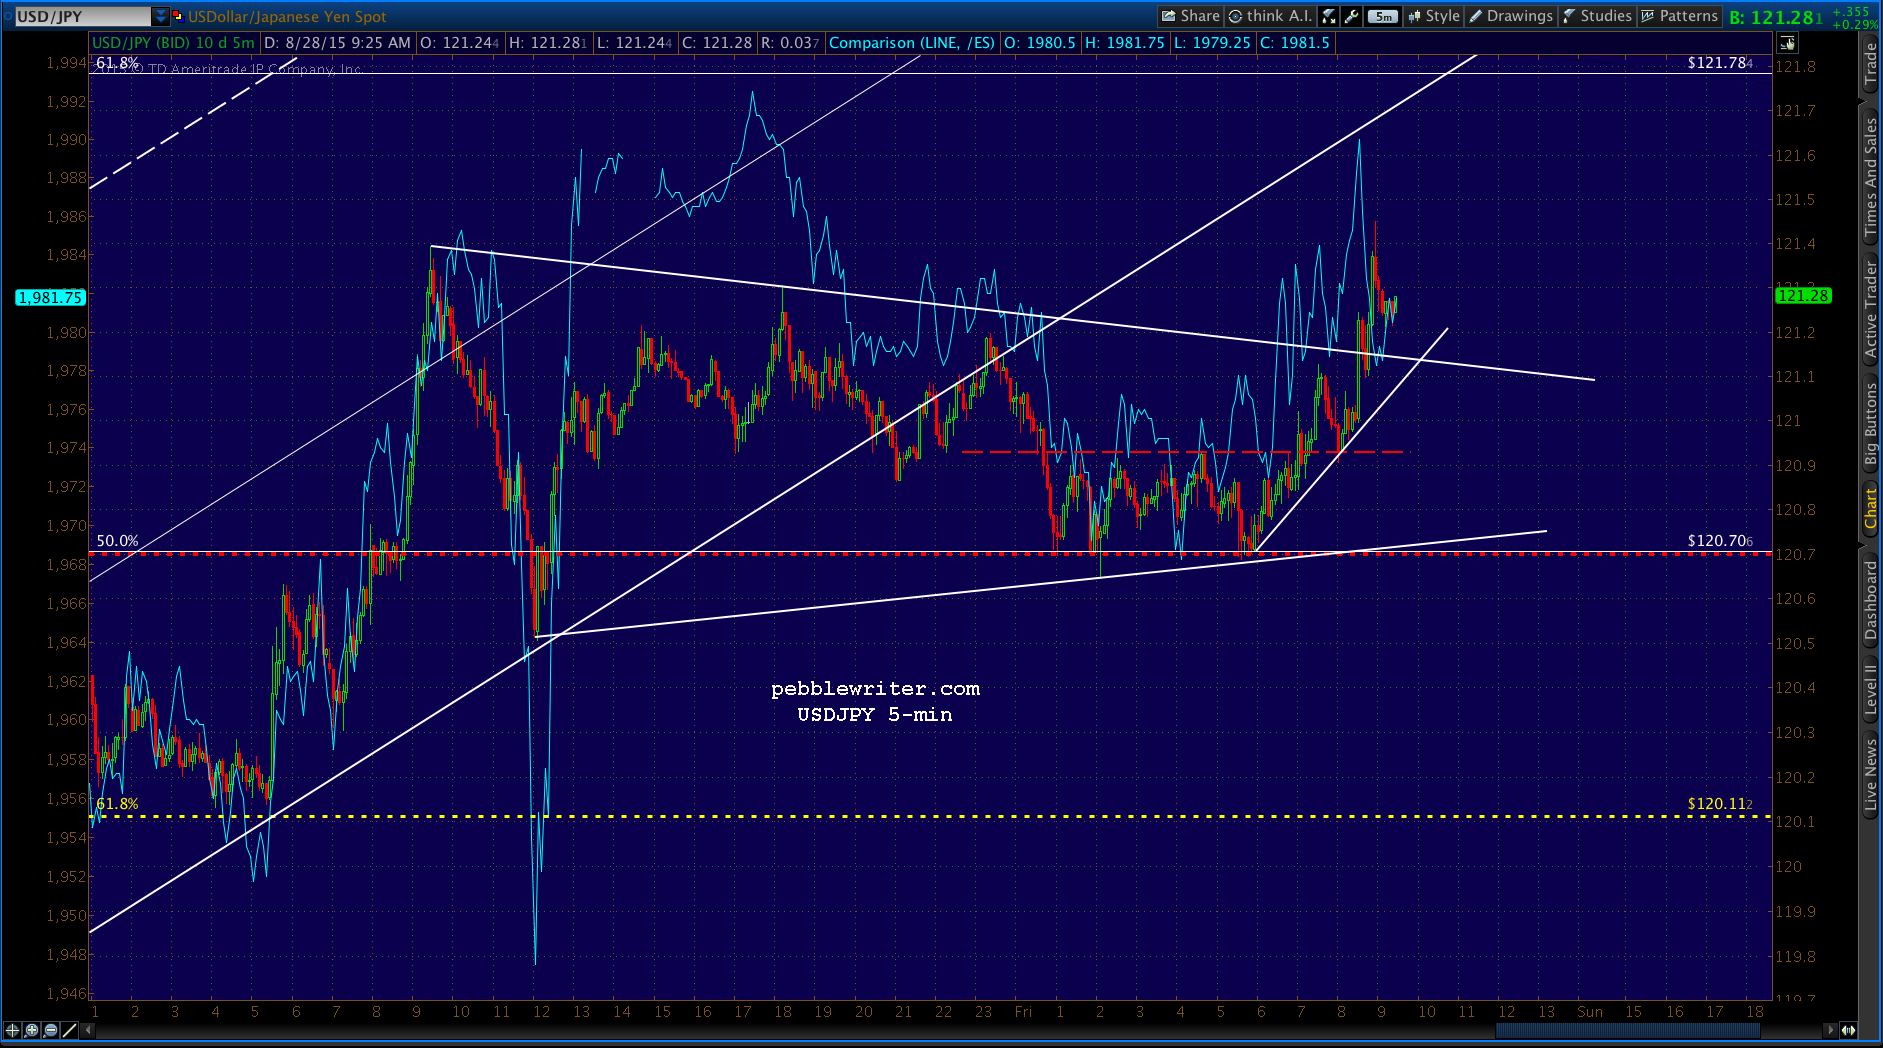 My only reservation — besides the lack of a retracement of any import — is that NKD has backtested and failed to retake its H&S neckline. A failure to retake a neckline is a big, bearish deal.
 UPDATE: 1:01 PM
Do or die time.
 Things are confused by CL’s spectacular rally – up 7.5% so far today. USDJPY’s actually holding back.
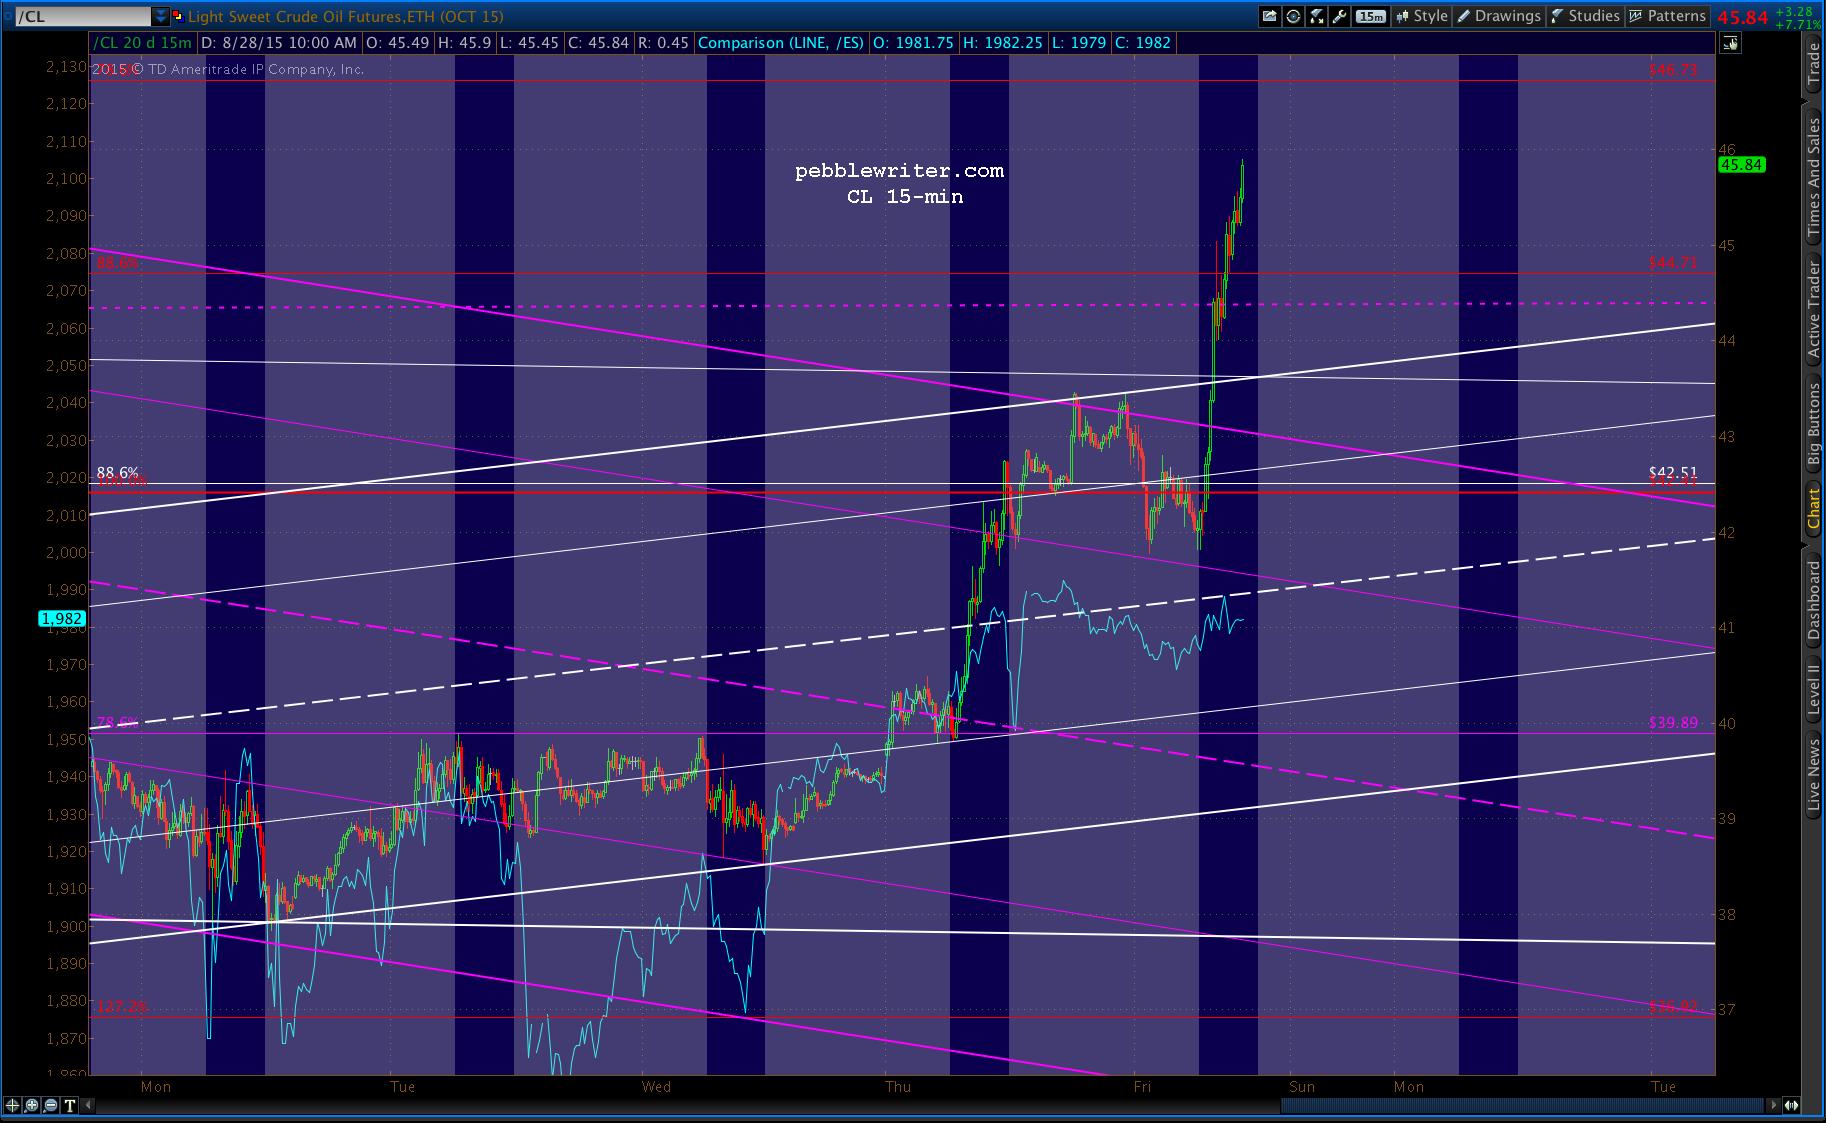 UPDATE: 1:41 PM
 USDJPY has found potential support…
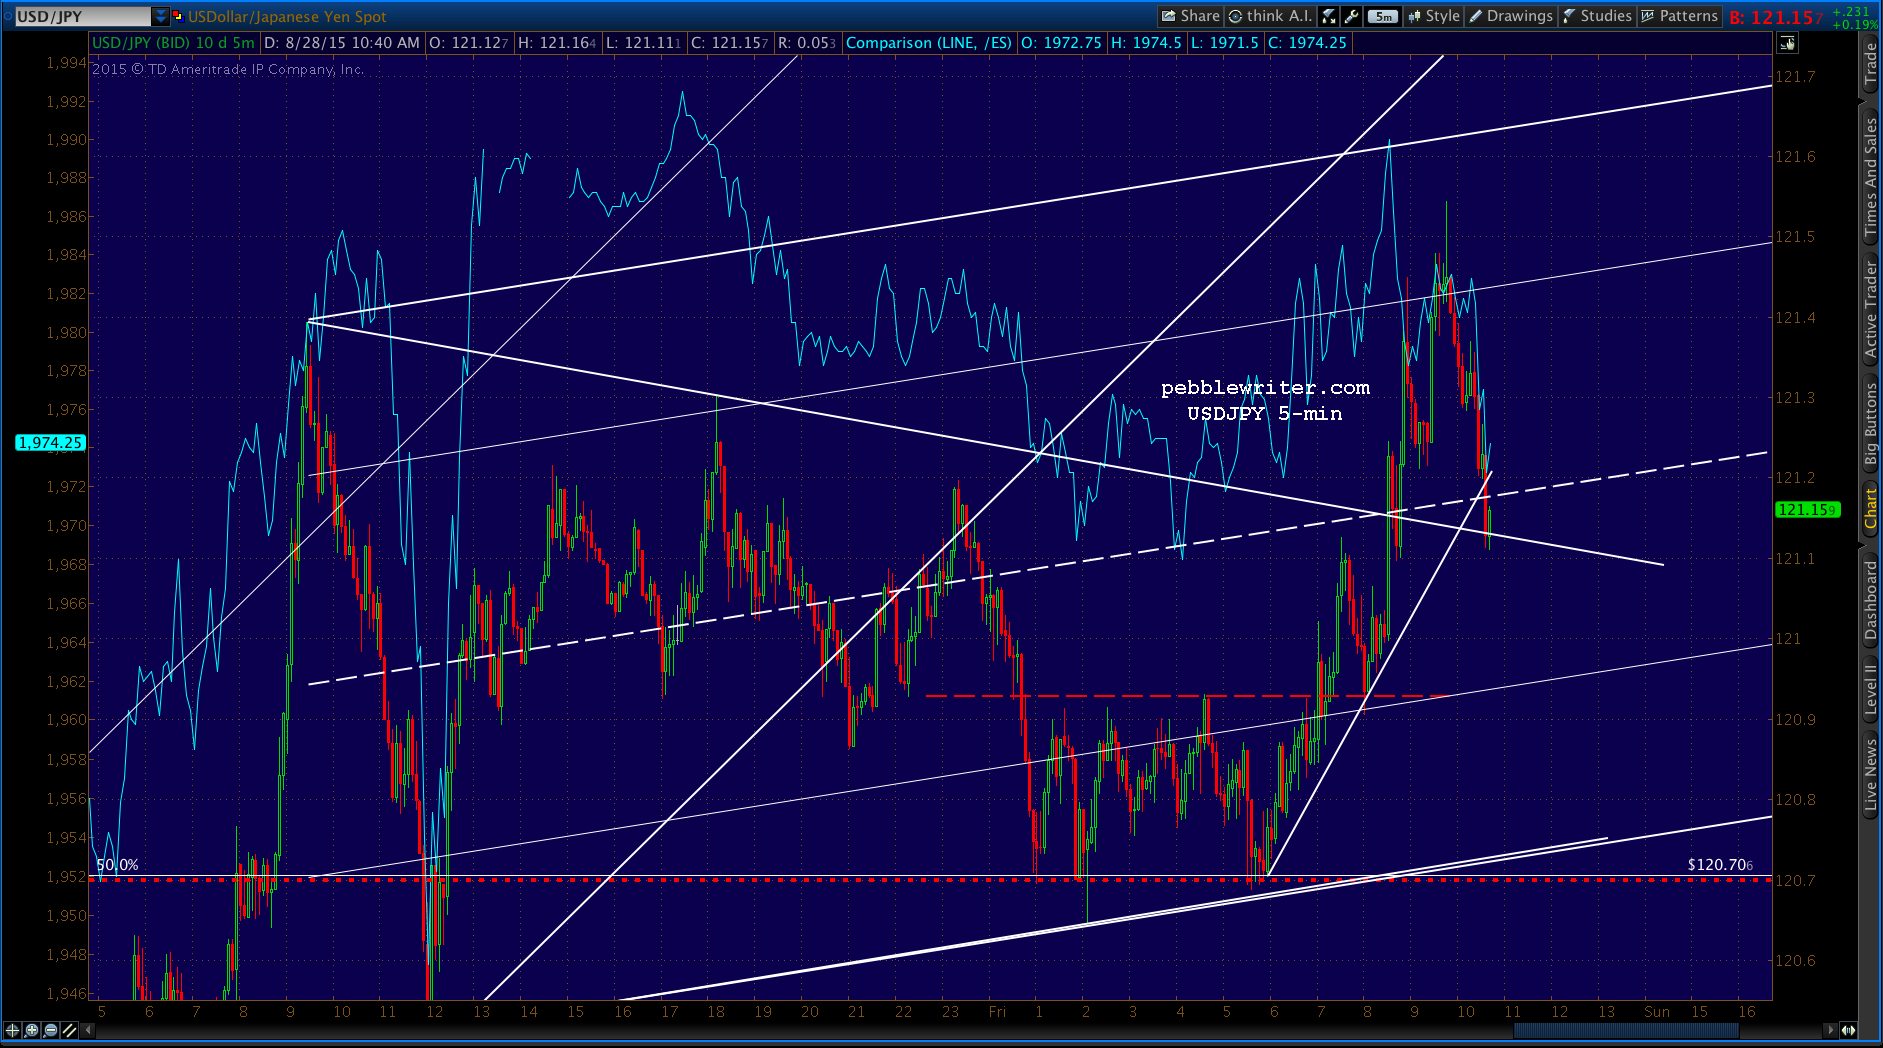 …and, NKD has failed to retake the neckline again — but isn’t breaking down either.
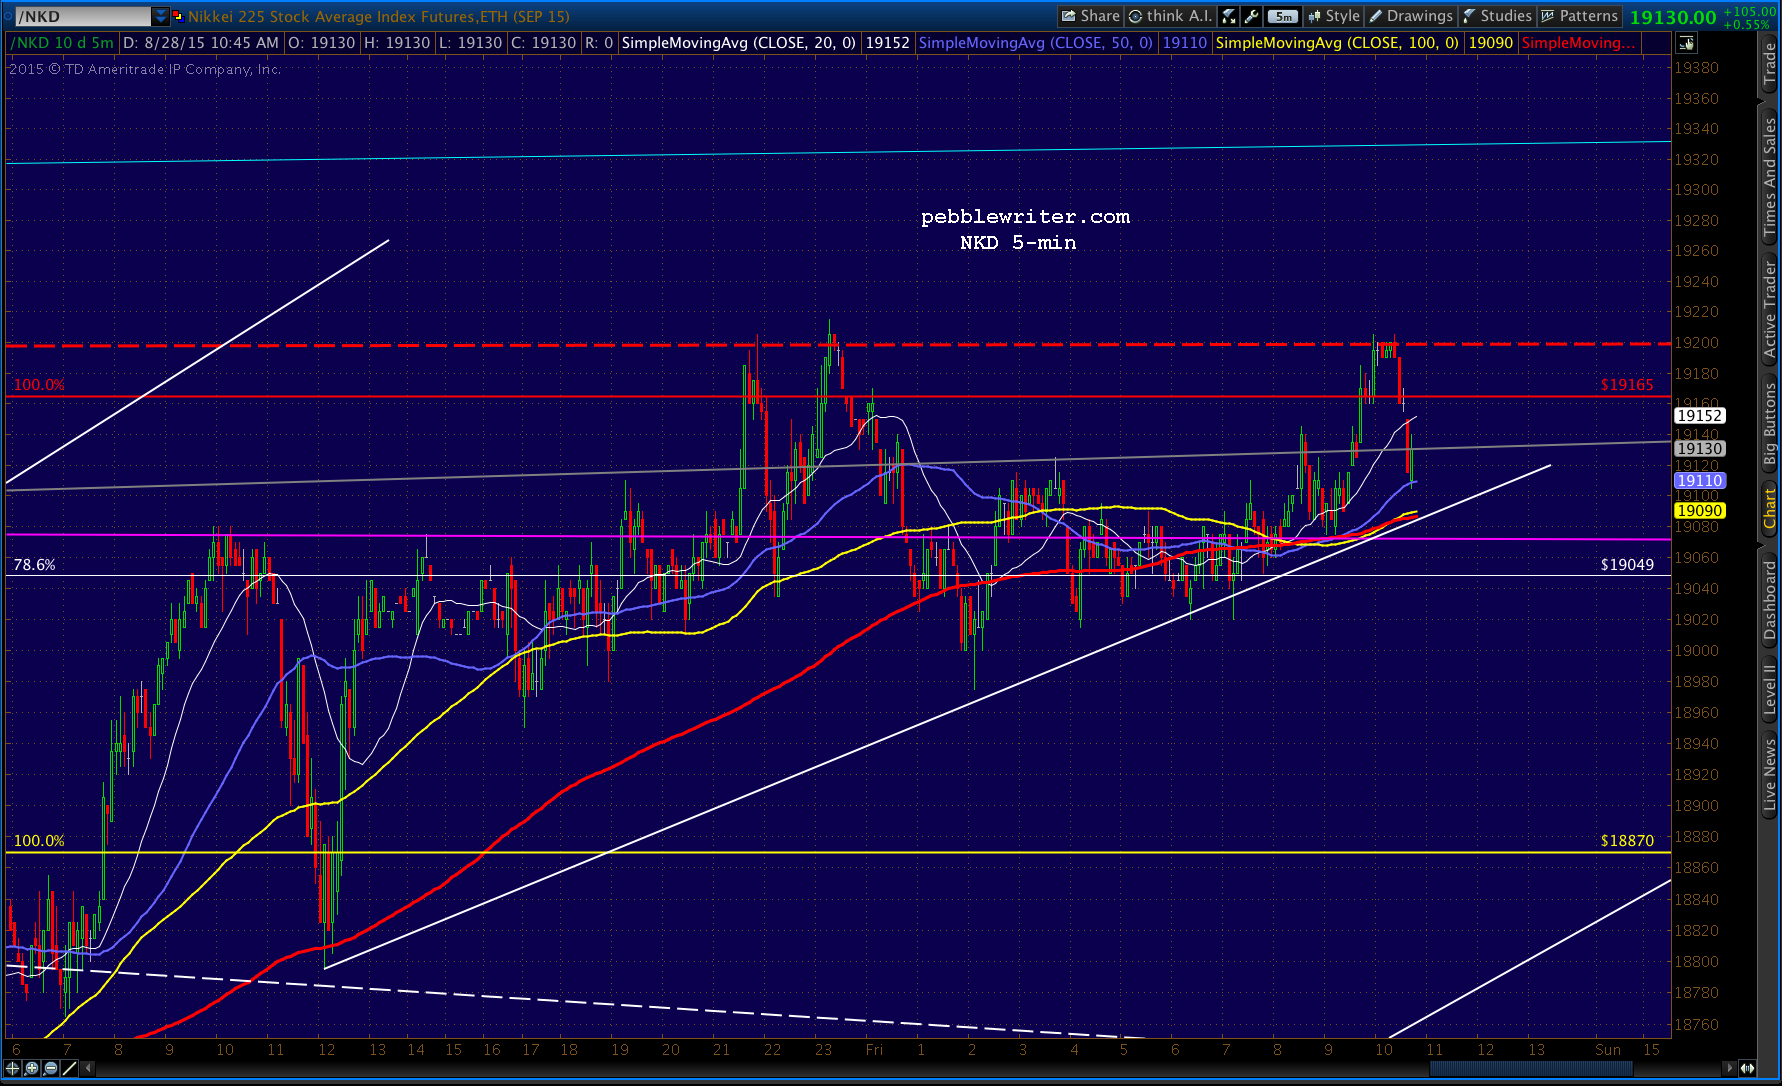 UPDATE: 1:52 PM
 UPDATE: 2: 05 PM
NKD suddently came to life and is popping — no volume, of course, but the algos don’t care. All they smell is a push back above the neckline. 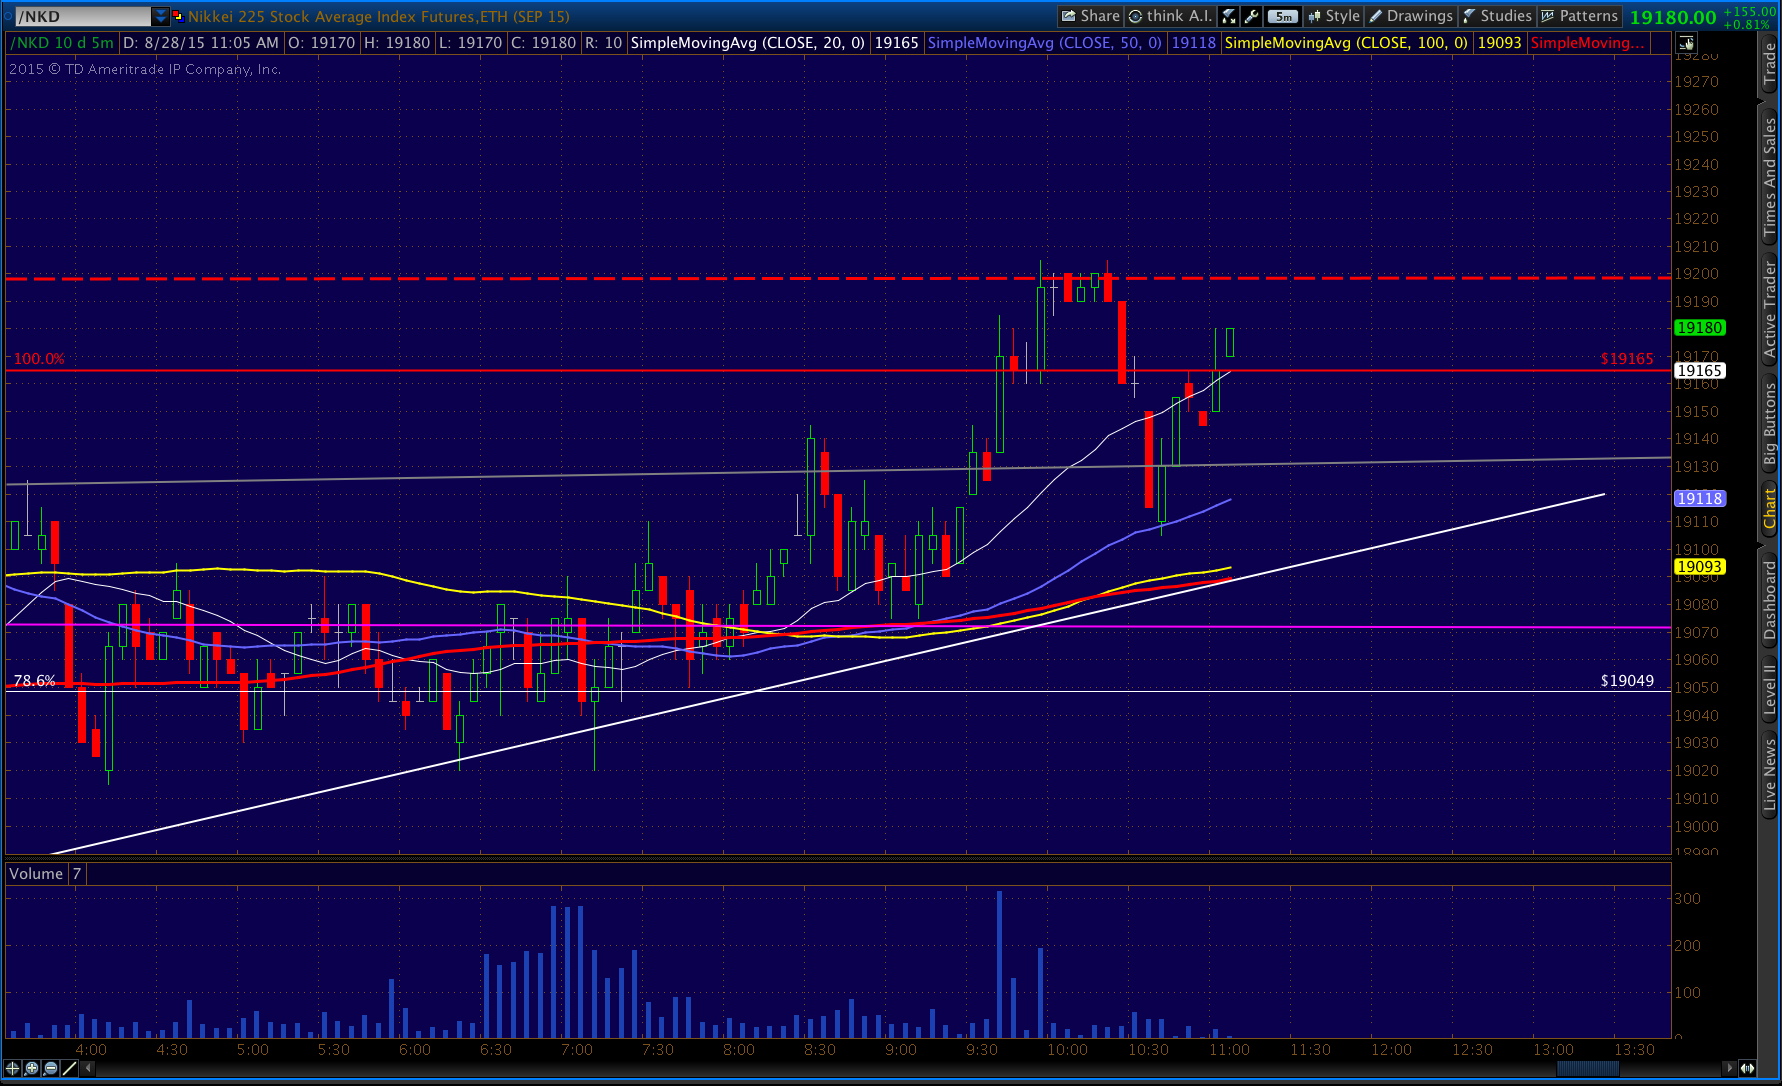
 UPDATE: 2:14 PM
 Chances are this could bounce around for the next couple of hours. I see the Atlanta Fed just put out a very negative GDP read: 1.2% annualize for Q3. I think the onus is on the bulls to maintain positive momentum into the weekend.
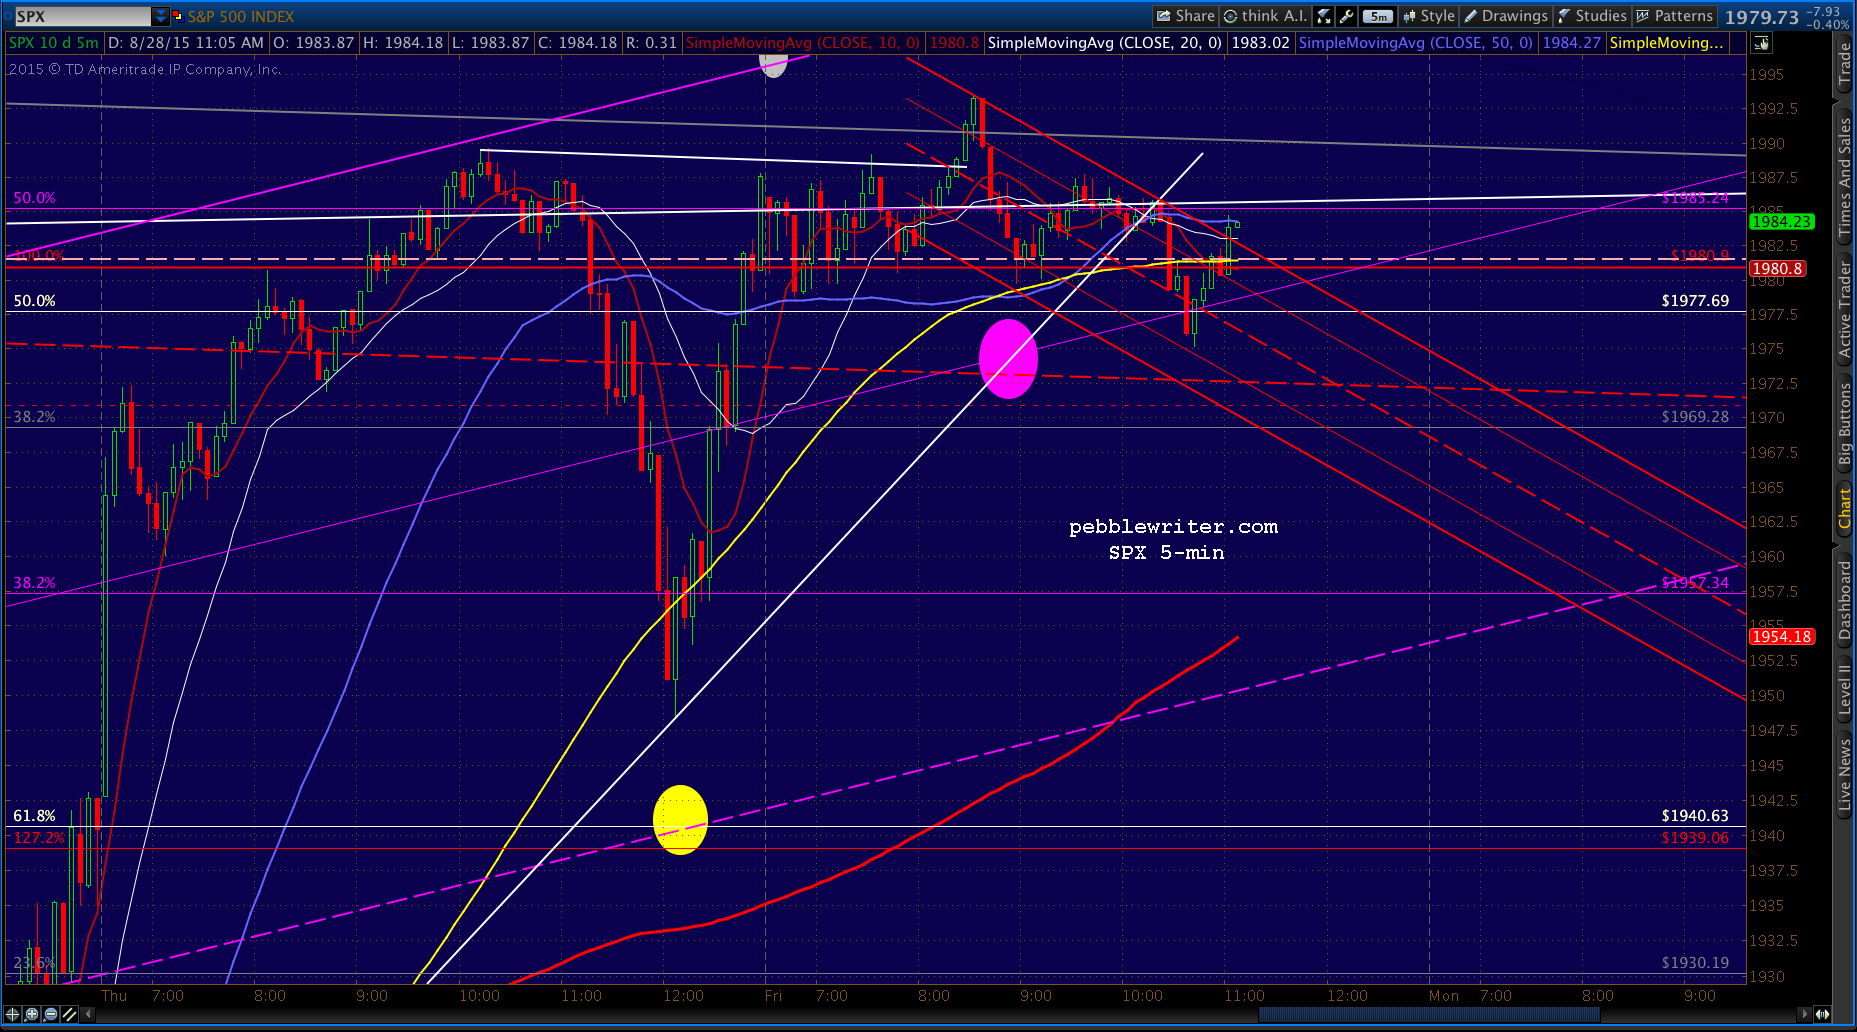
I’d keep an eye on the SMA20 (blue line) on SPX’s 5-min chart. If SPX can’t retake it, I’d let it be a sign to stay short. Those moving averages are about to roll over, and SPX might just ride down with them into the close – perhaps as low as 1955ish.
USDJPY is quite a ways away from the SMA200 now, and has avoided spiking higher despite all its opportunities.
The flip side? The top of the purple channel will finish the day at 2007ish. From this standpoint, there’s now plenty of reason for them to start ramping. And, USDJPY still has a ways to go if it is meant to get back in the rising white channel by the EOD.
FWIW, ES indicates a slightly higher close than here. VWAP is at 1979.84 and it’s now trading at 1975.75.
UPDATE: 2:47 PM
 If NKD breaks higher than its neckline, then SPX 2007 is totally doable. If USDJPY breaks down below the white TL and makes its way anywhere near 120.70, then 1955 makes more sense. But, I really don’t think we’ll see either today.
More later if anything exciting happens.
Comments
2 responses to “On Track”
I’ll take this question as a sign of great confidence… Seriously, though, there are always new Fib levels: 2.24, 2.618, etc. But, I think the first order of business would be to exceed it by a significant enough margin that doubters can’t call it a fluke, and then cleanly backtest it just to put it in the rear view. The 1.272 at 1823 was messy, and left way too much uncertainty about its staying power until the big backtest on Oct 15, 2014.
I’m curious what the forecast looks like if we hit SPX 2138 or higher? What are the odds of a 40-50% correction by November of this year? In 1929, the market made news highs the day after Labor Day, and then it started the decline. By November of 1929, the markets lost 48% in value.