

By now, most members are well-versed in the important role USDJPY plays in propping up equities. In fact, the yen carry trade is alive and well, and continues to rescue stocks on a daily basis.
In our last dedicated update in July USDJPY [see: USDJPY Reaches Critical Resistance] I noted that the pair had backtested the major channel which had guided it steadily higher since its 2011 lows and called for a backtest of the SMA200.
…the most likely course of action is a backtest of the white channel top and SMA200, ideally when they intersect a few months from now — but, sooner if SPX falters. The SMA100 and SMA200 will intersect in about a month, which is another legitimate target as that’s when SPX’s rising white channel encounters the Jan highs.

Indeed, USDJPY backtested its SMA200 five weeks later — the same day SPX tested its Jan high. We immediately looked to the .886 at 113.59 as our upside target. From Currency Complications:
USDJPY reached our target at the SMA100/SMA200 overnight, at least temporarily bringing the pair back below the top of the falling white channel from which it broke out on July 10…[it] is about to go on a market-ramping tear to 113.59…

This morning, it reached 113.59. It was a good two weeks later than originally expected. But, that was actually a positive sign for bulls.
continued for members…
By delaying the tag of the .886, USDJPY has thus far avoided a backtest which would have occurred had the tag come two weeks ago. It was also able to backtest the top of the falling white channel, backtest the SMA100 a second time, and complete an IH&S.
None of these are a guarantee that USDJPY will move higher. But, they leave the door open.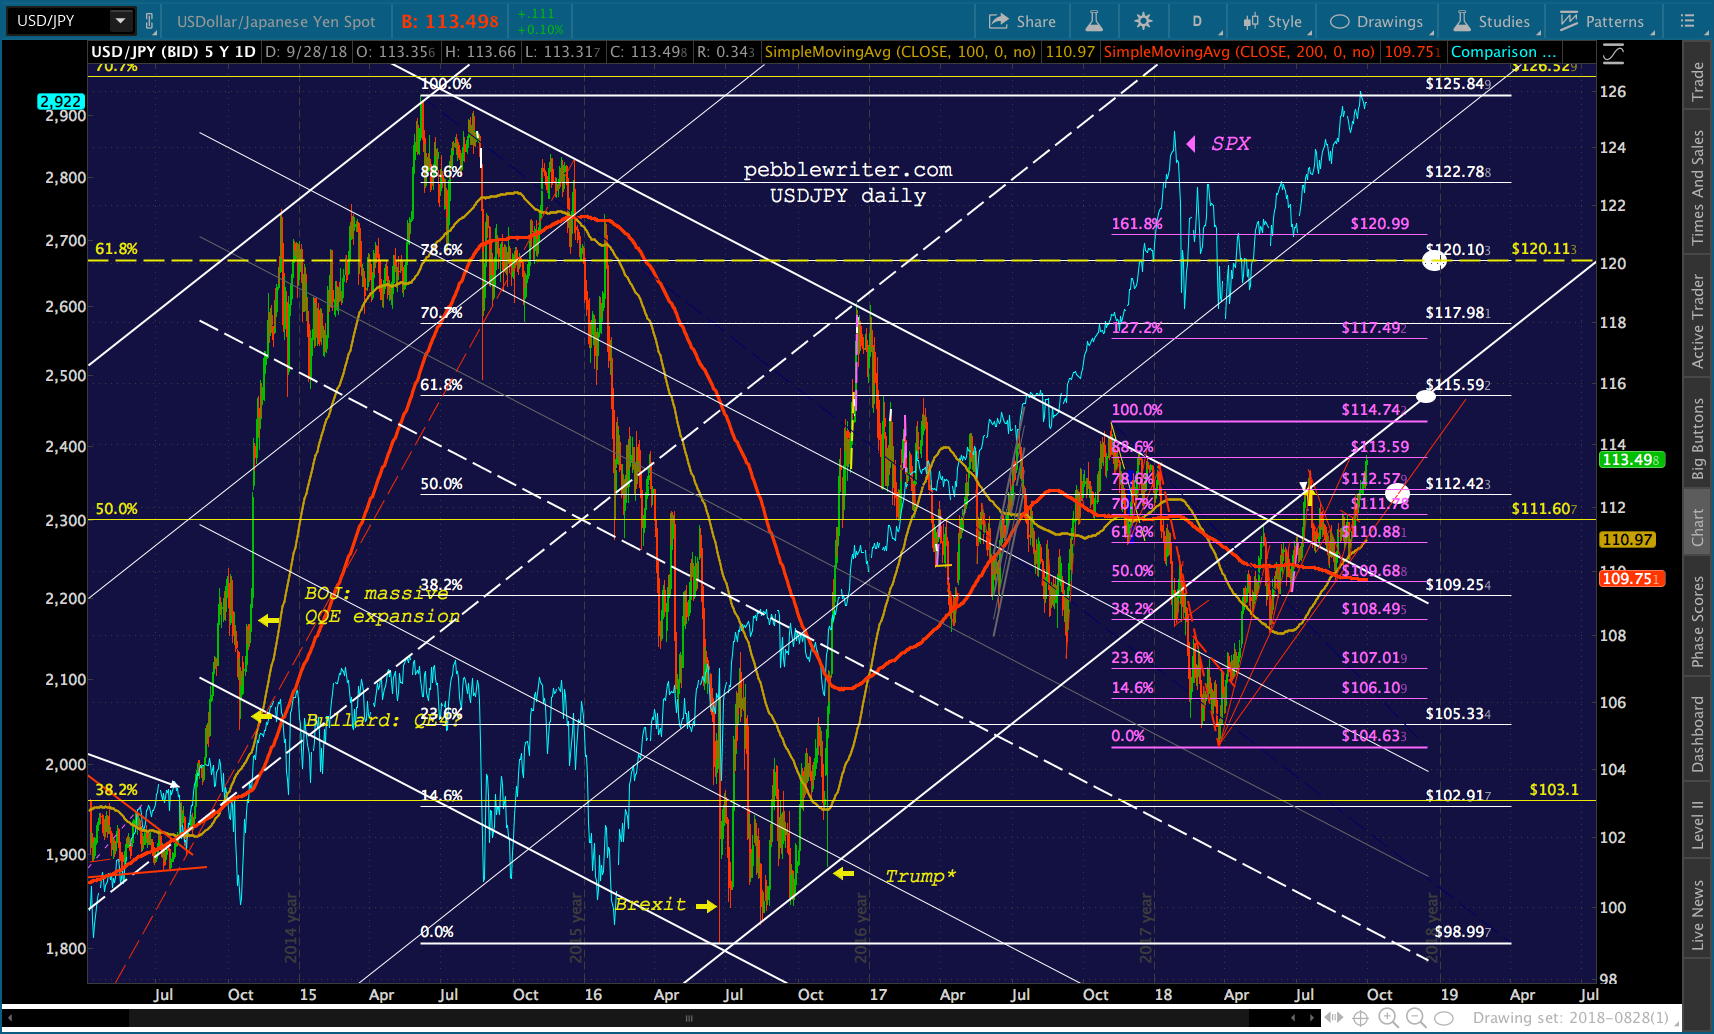
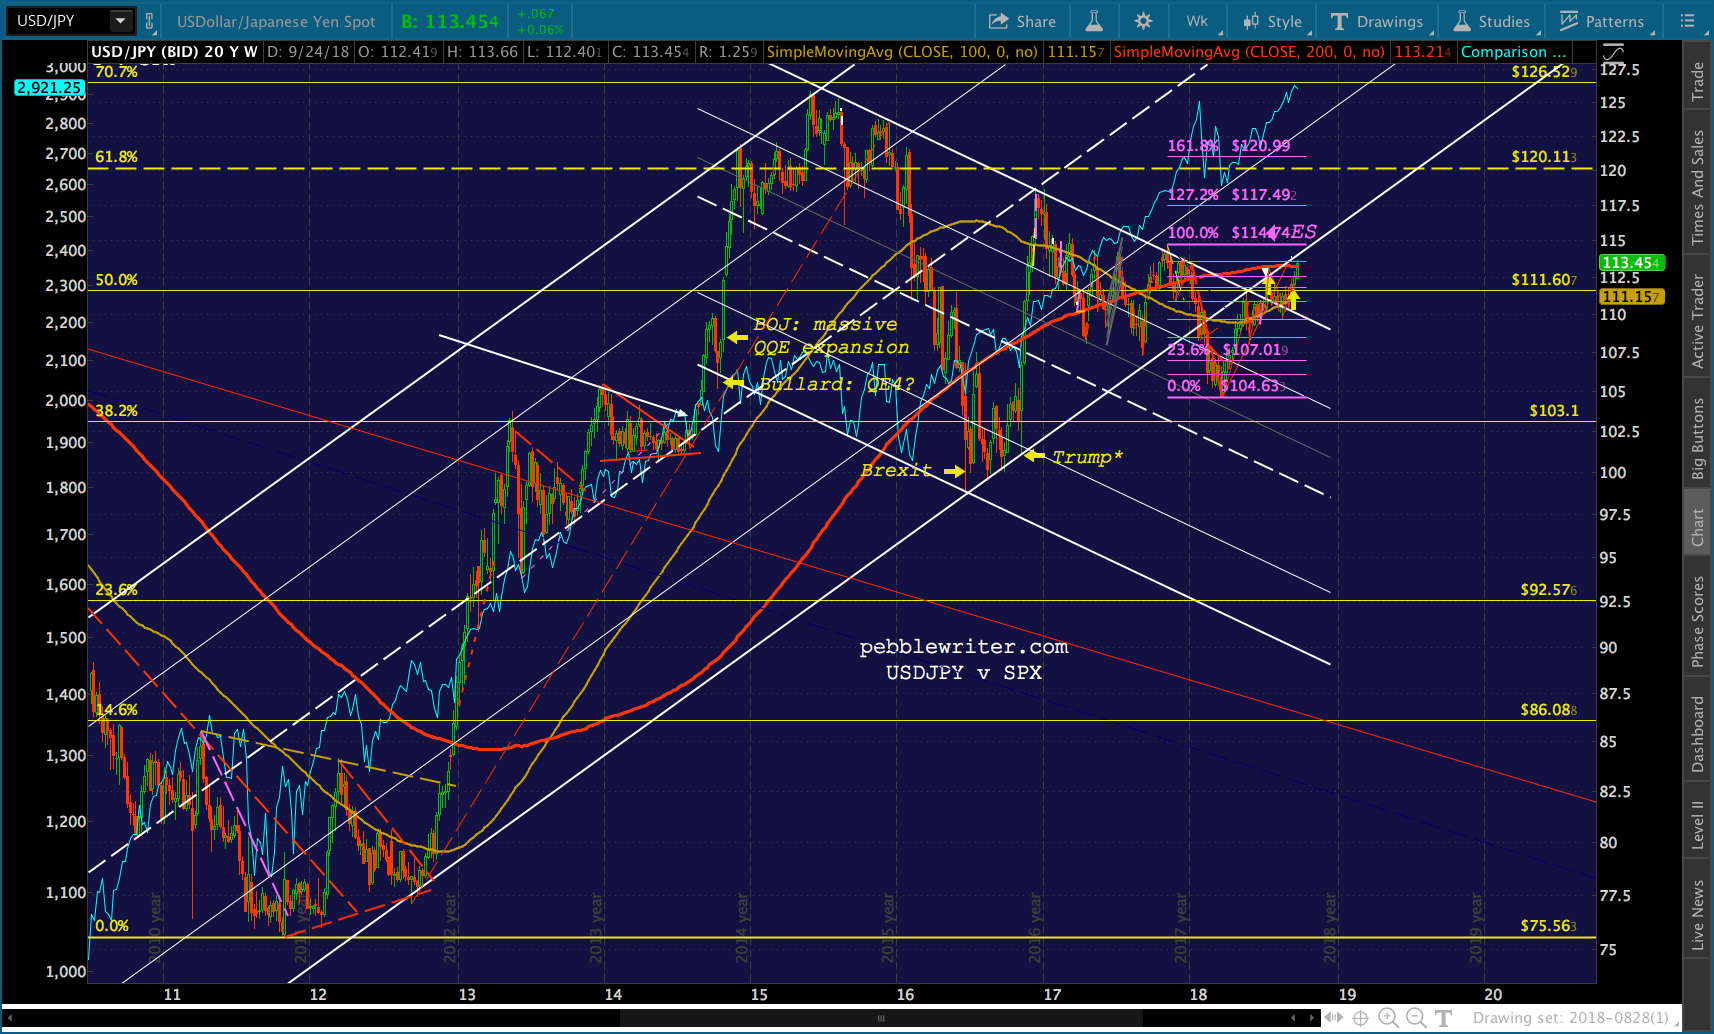
There have been many such moves over the years — where a channel or Fib level suggested a reversal which ended up being very brief or even non-existent. The most famous case (with Pebblereaders, at least) was the push through 120.11 in Dec 2014.
This was a key Fib level, and USDJPY took full advantage of bullish-looking rallies above it countless times until its eventual failure in May 2015 — which, of course, led to the correction that year.
 USDJPY could continue bumping along the bottom of the big, white channel all the way to 115.59 or even 120.11. If stocks needed more aggressive help, it could barge back into the rising white channel from which it broke down along the way. It has threatened to do so several times.
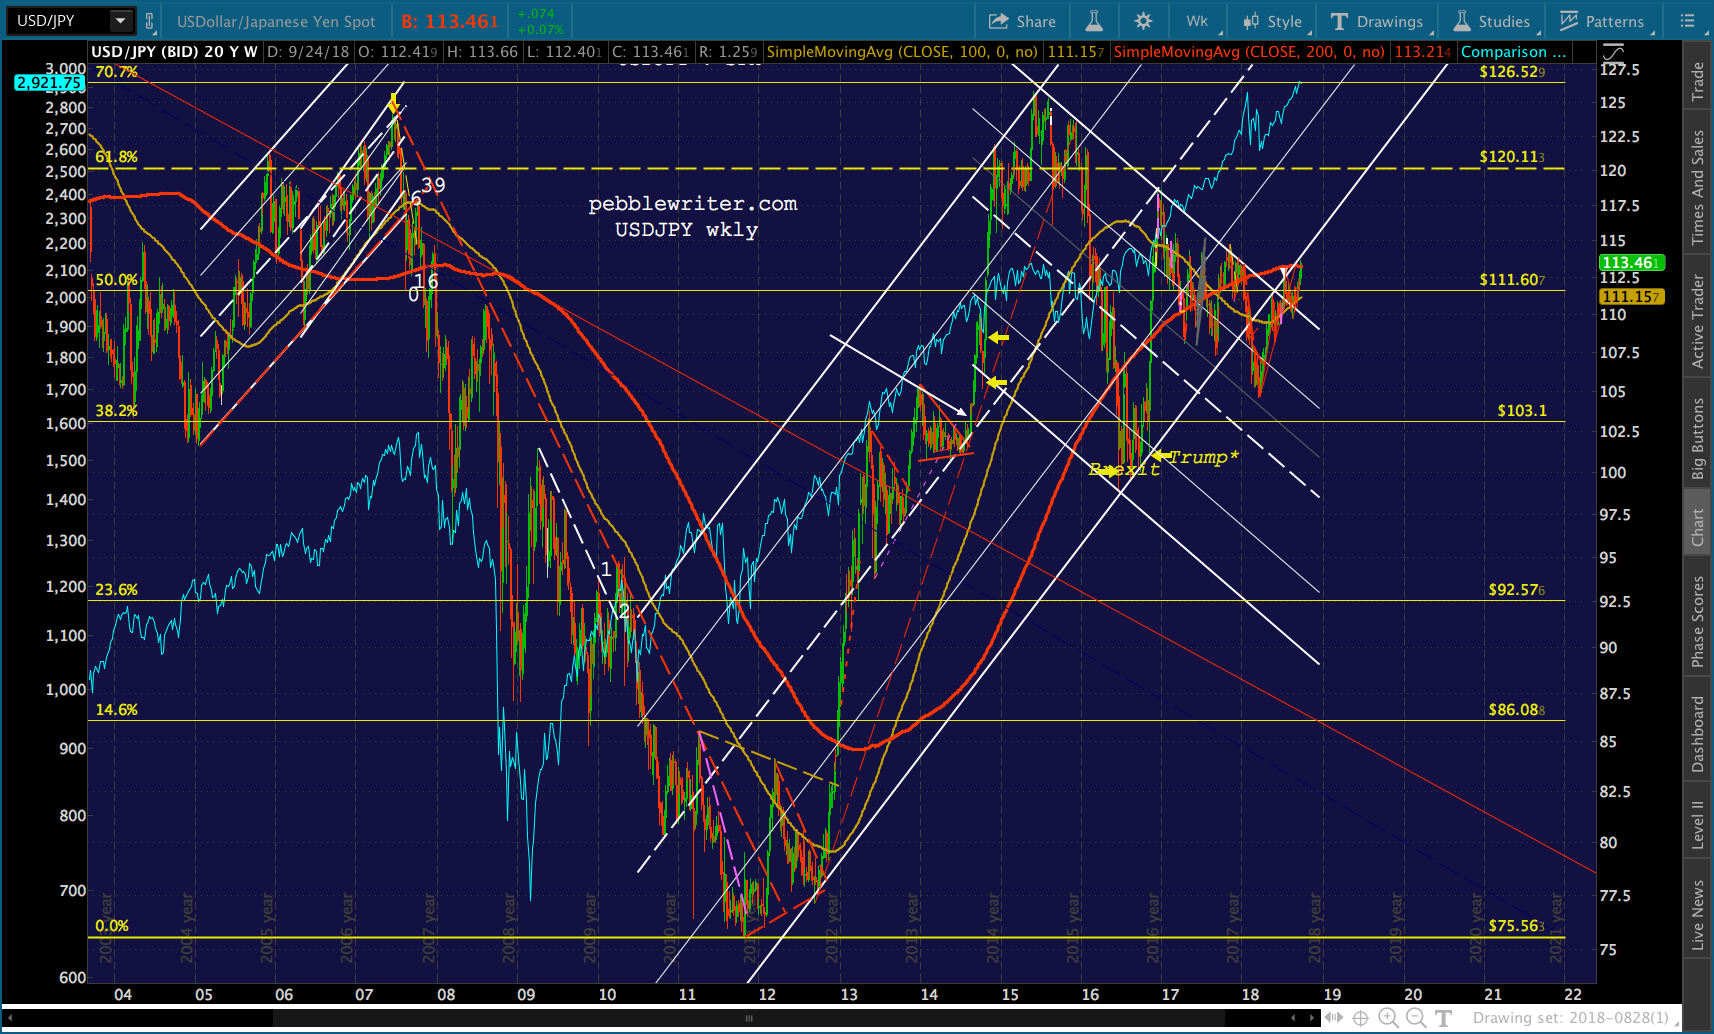 So, by all means consider shorting or at least installing some trailing stops here. USDJPY could sneak a little higher to the horizontal resistance at 114.50. If it does reverse now, it would likely find support rather quickly — the neckline of its recent IH&S at 111.30, for instance — and starts making its way northward as the EOY approaches.
If the neckline breaks down, there’s always the SMA200 which should reach the white channel top at 109.80 around Oct 10. If that breaks down, we’ve probably got an equity correction on our hands.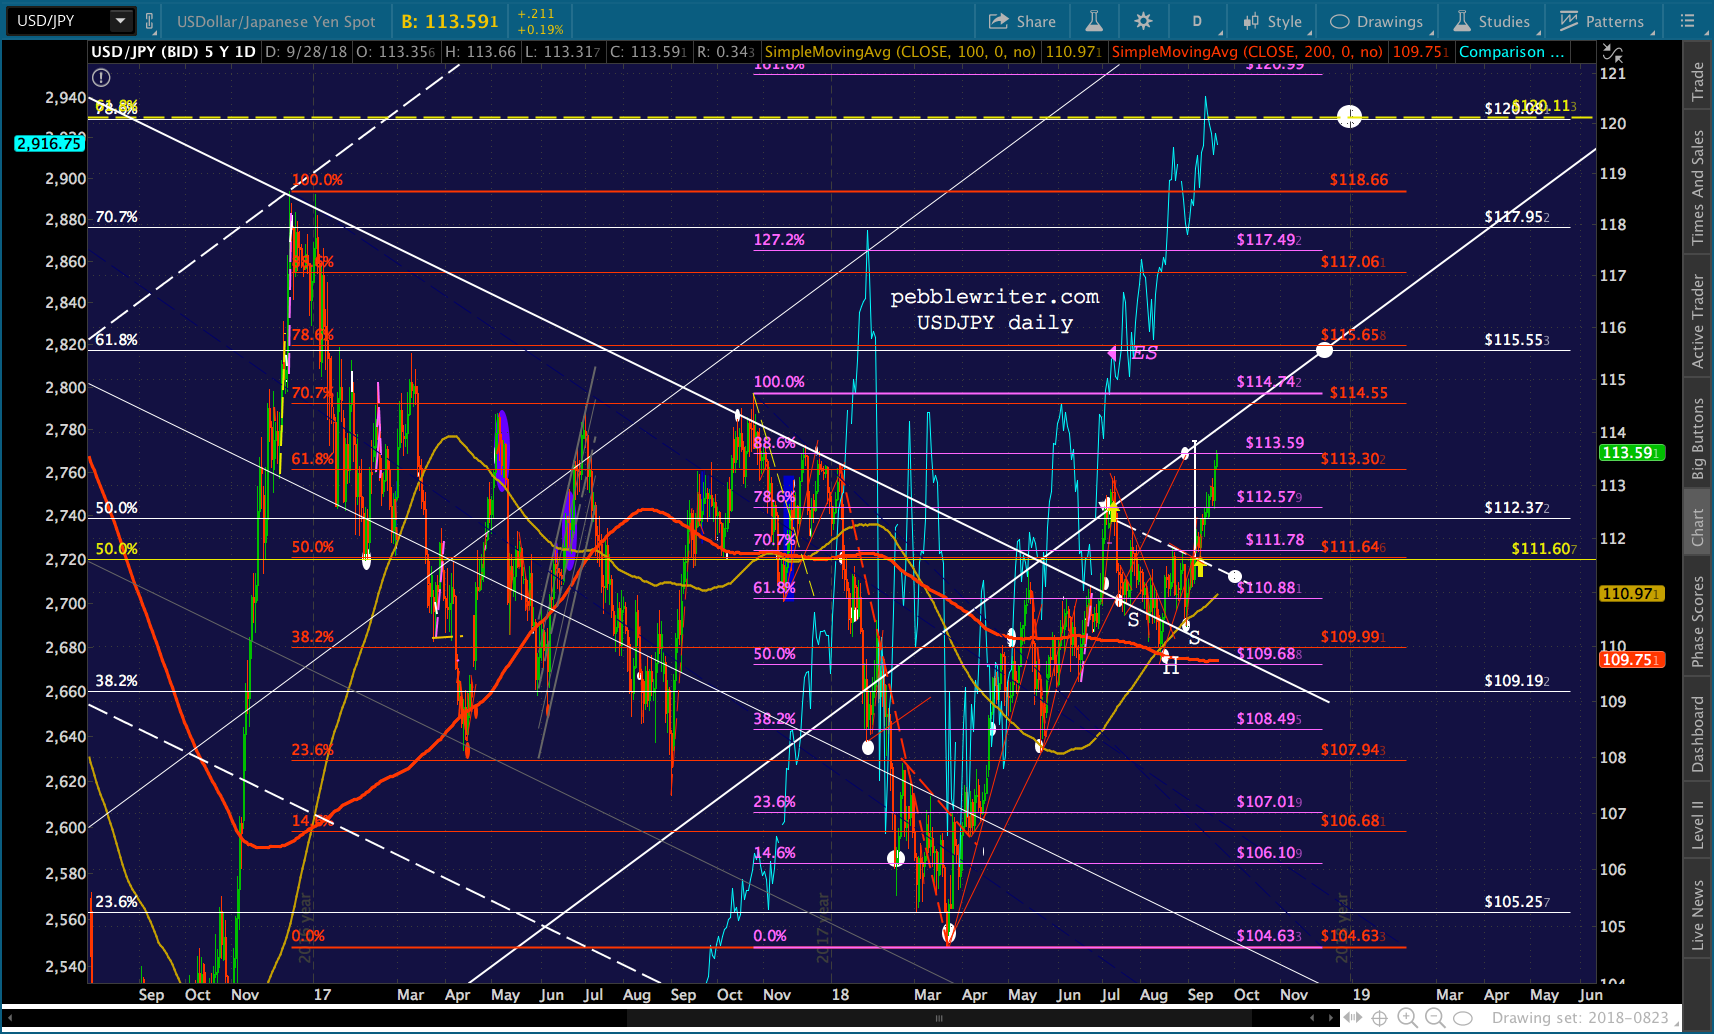
I don’t believe it’s a coincidence that the white .786 lines up almost perfectly with the yellow .618 at 120.11.