

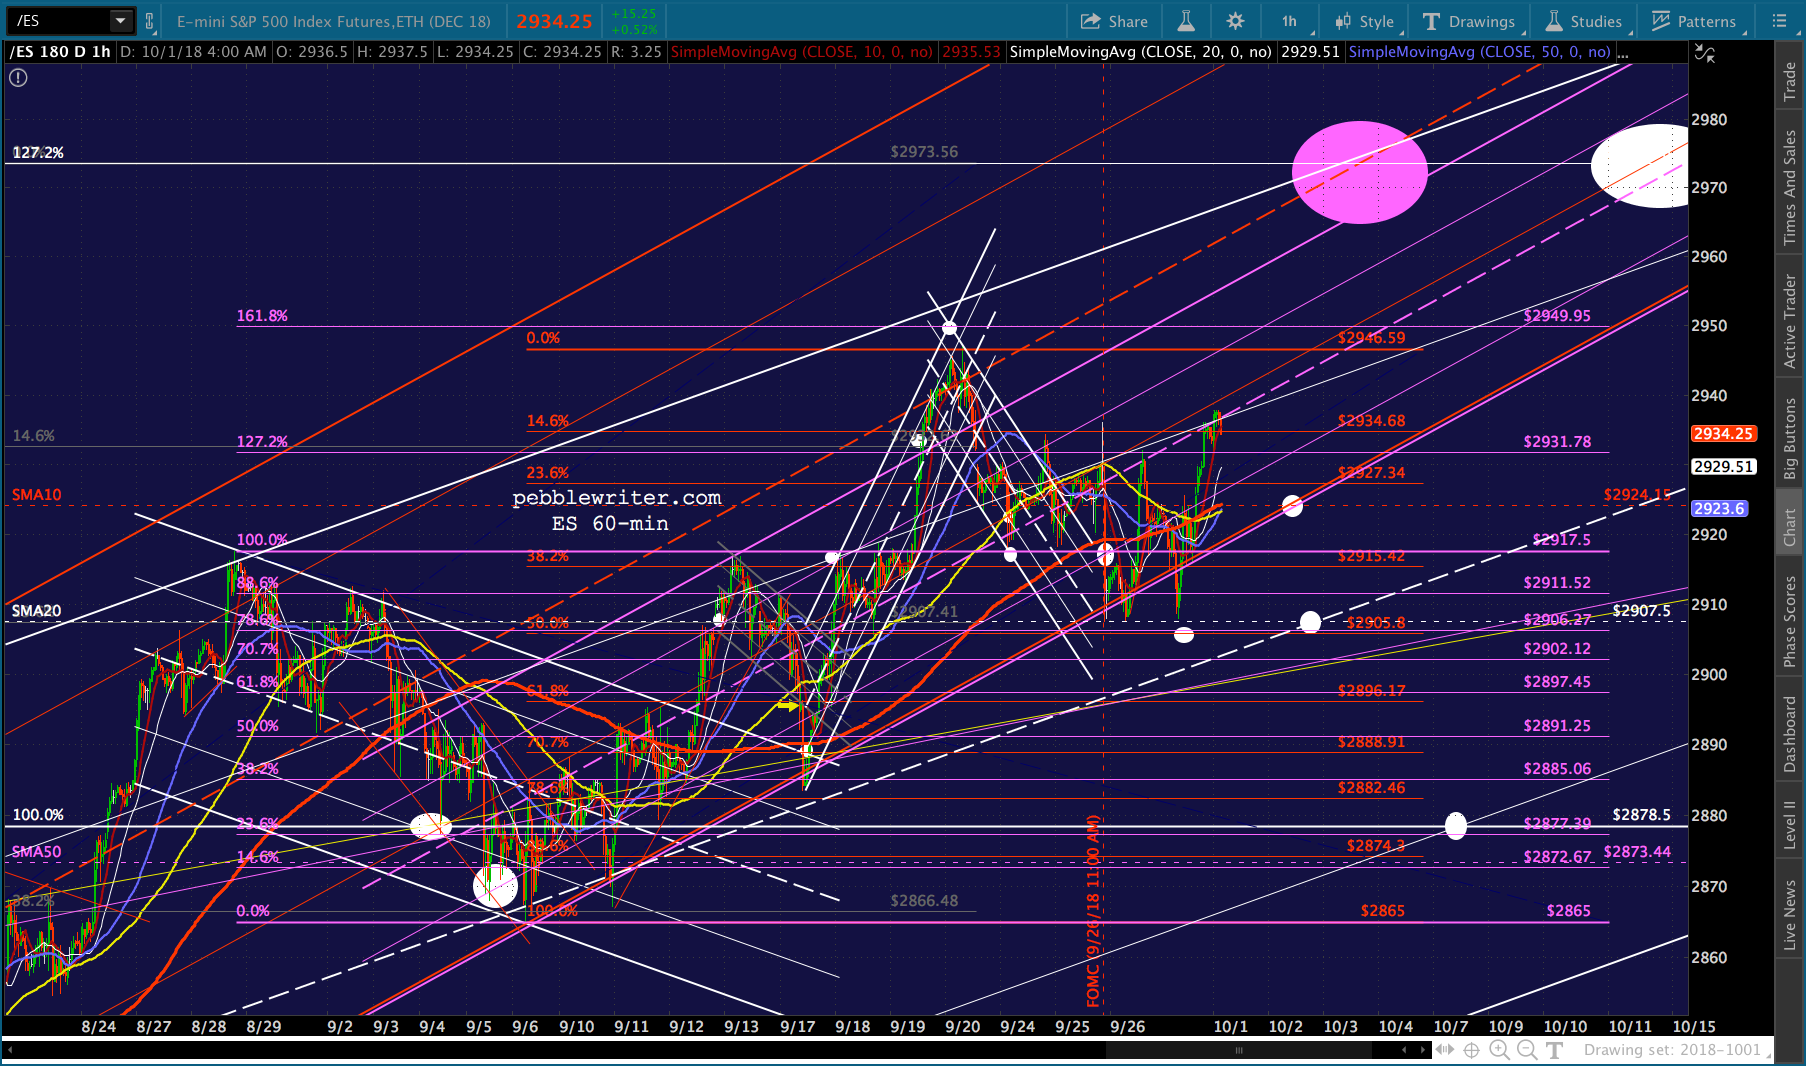
Following news of a partial resolution to the US-Canada trade breakdown, futures are up about 16 points. Aluminum and steel remain unresolved. And, of course, there’s the issue of trade wars with the rest of the world. But, for now, the algos are happy.
continued for members…
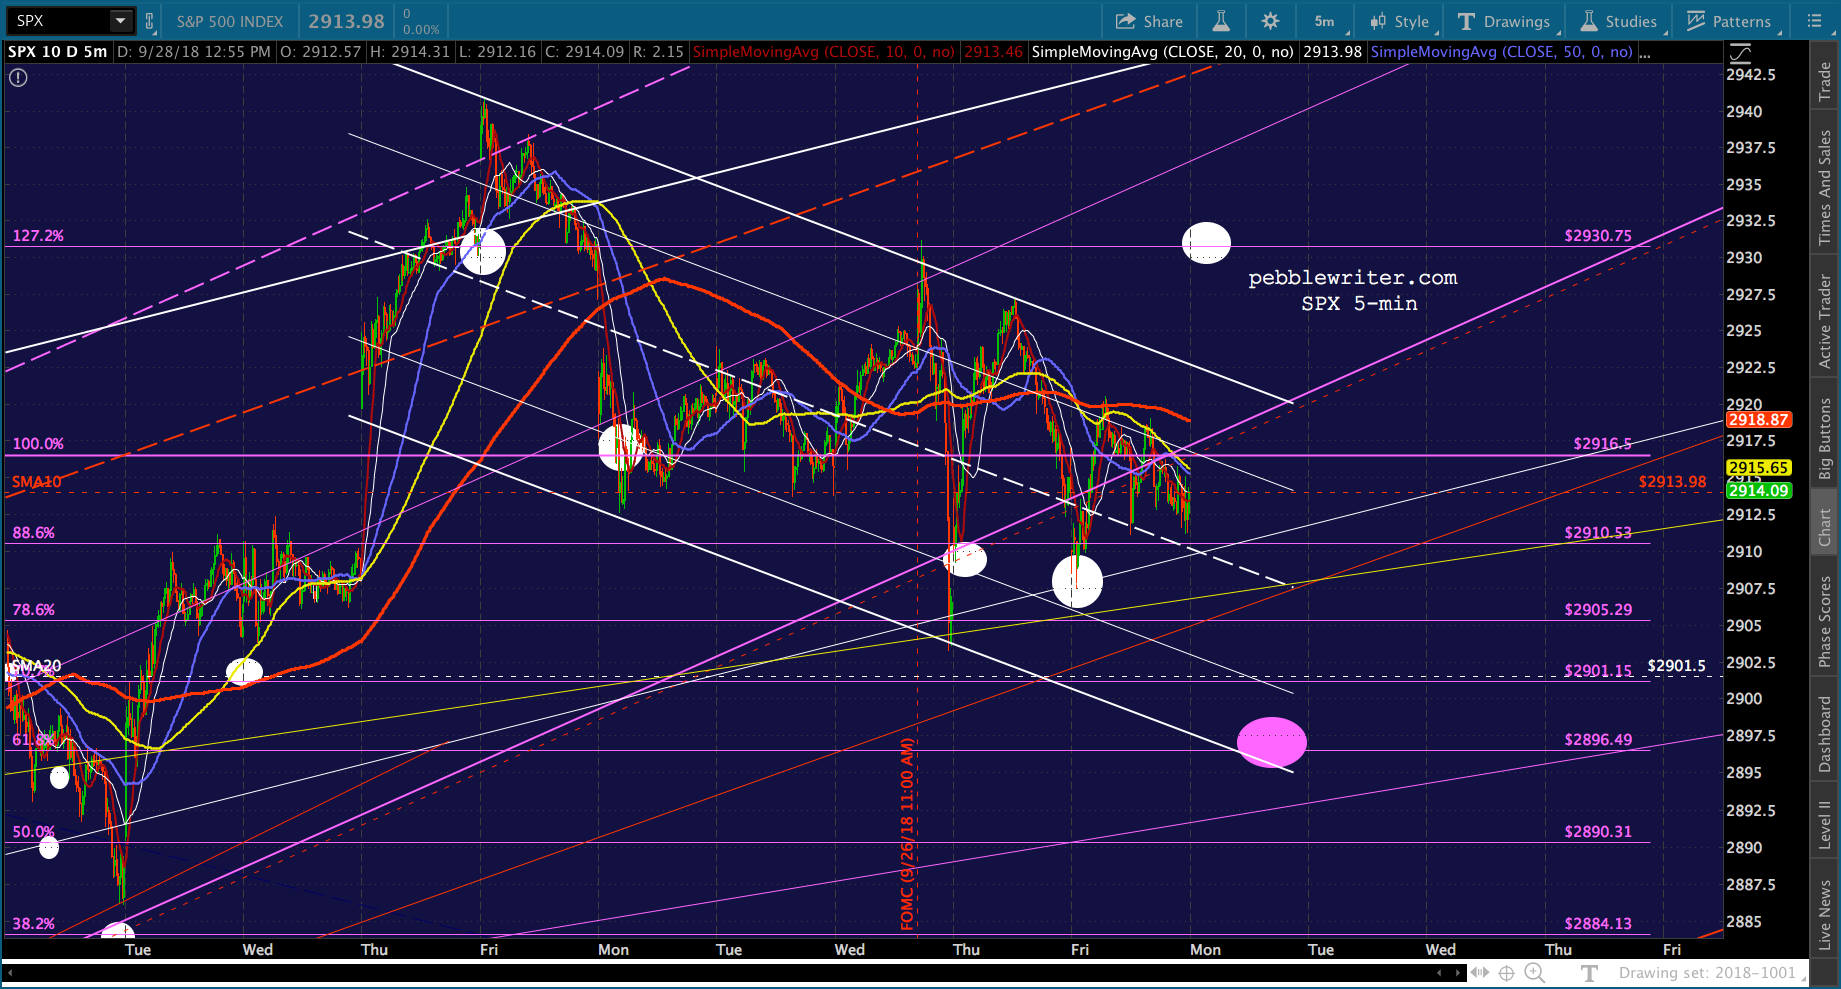
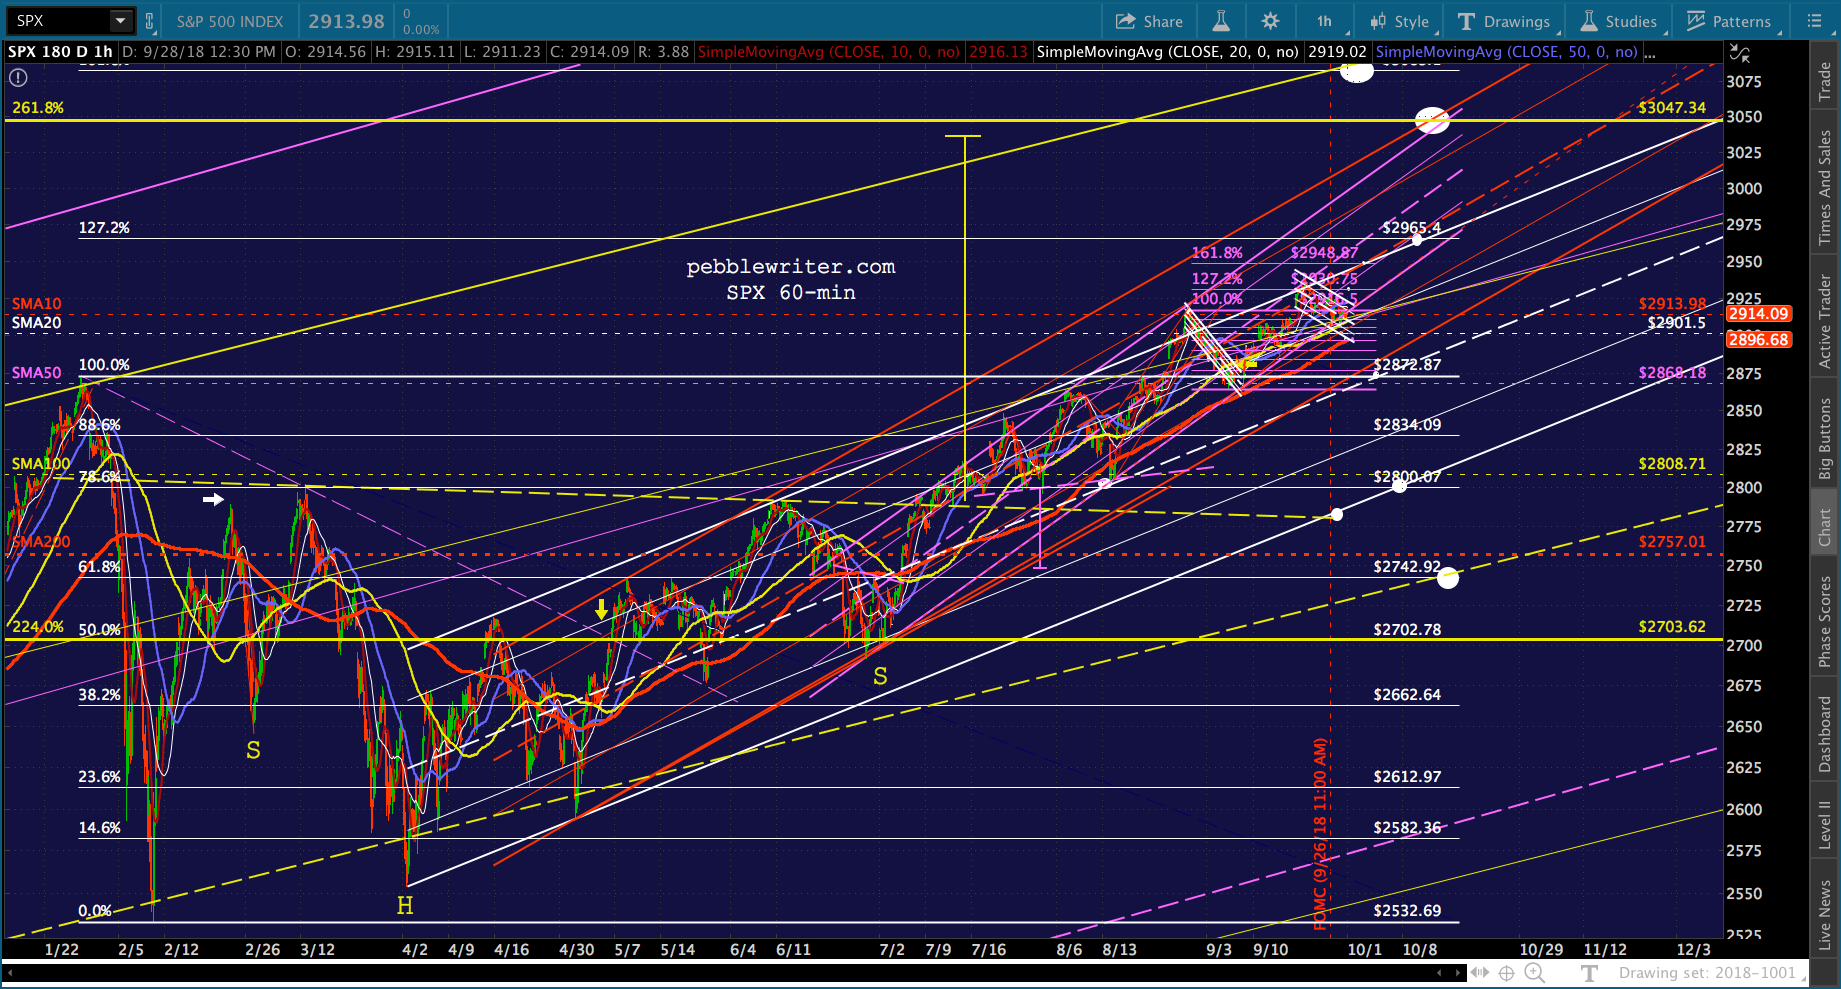
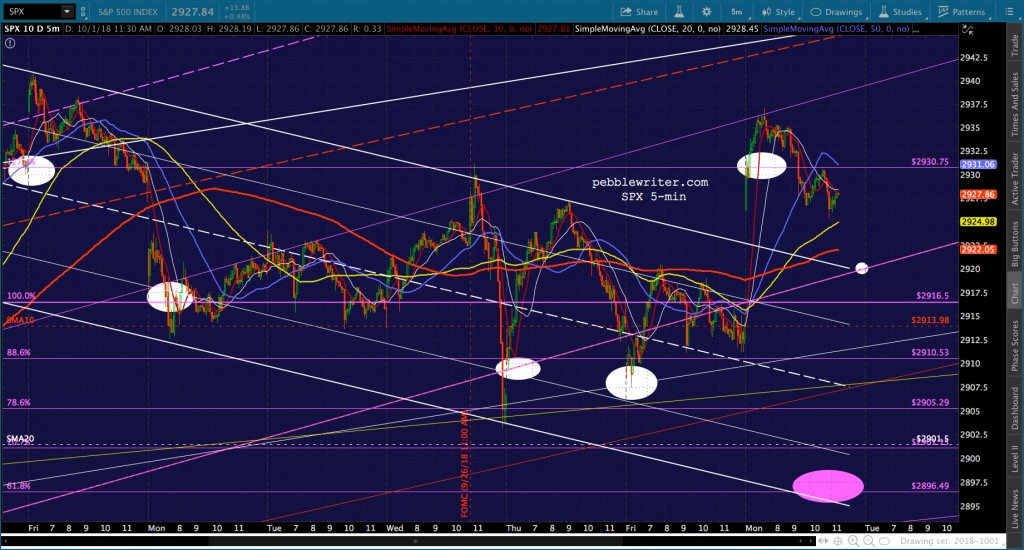
The bigger picture… SPX’s falling white channel should be busted on the open, leaving most of the downside targets – including even the SMA20 – SOL. I’ll leave them on the chart simply to represent the potential downside if the rising trendlines and channels break down.
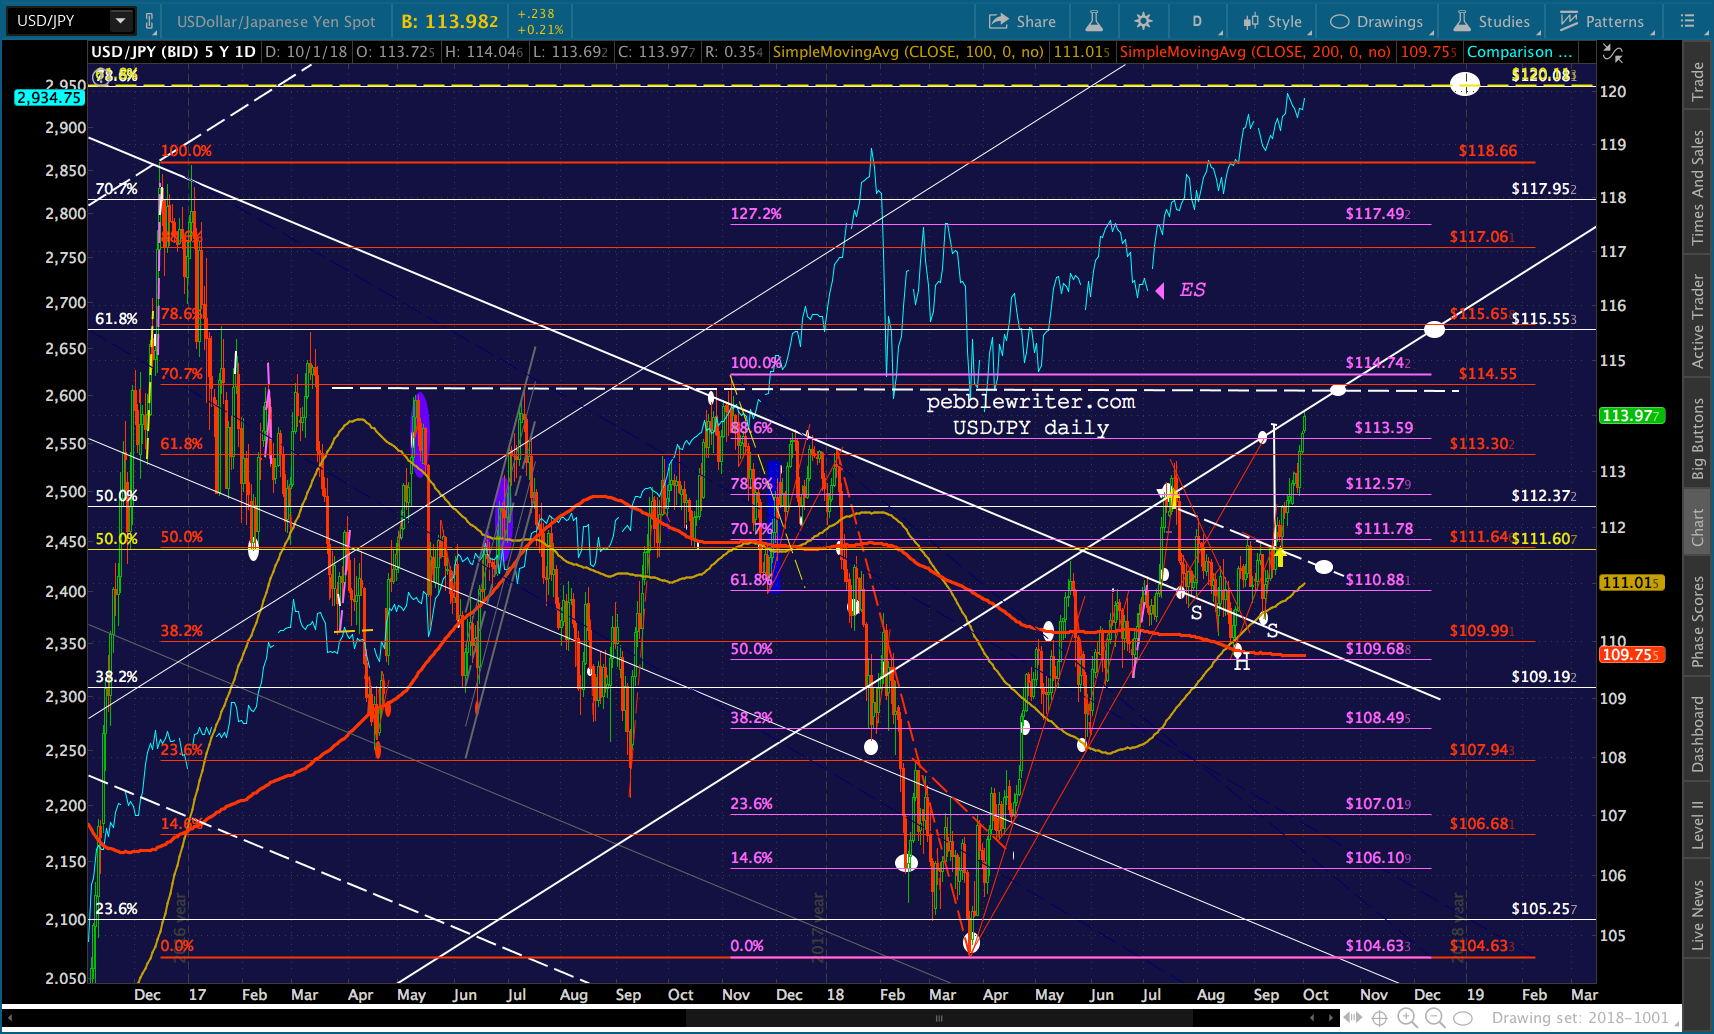
 The dollar index has run out of steam at the purple TL – leaving USDJPY bumping up against its channel backtest just north of its .886.
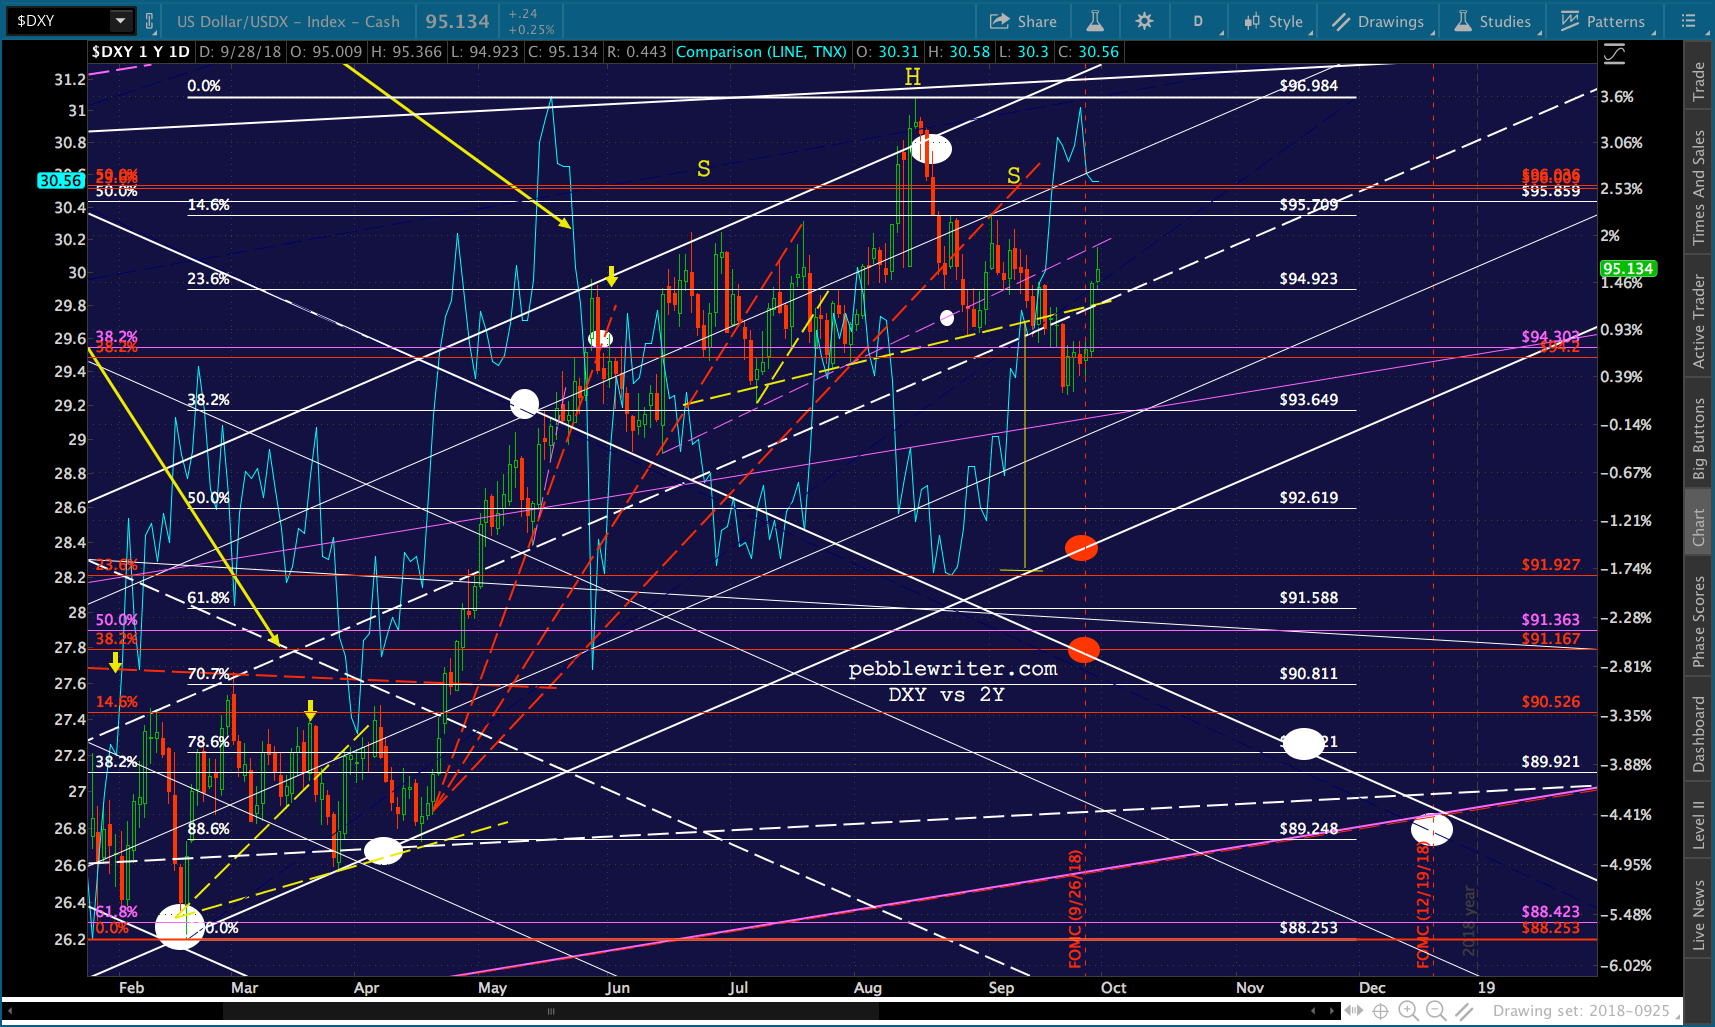
 For now, the EURUSD appears to be thinking less about a SMA200 backtest and more about a logical downside target. I remain ambivalent about the choices — just that it’s still likely to go sideways through the end of the year.
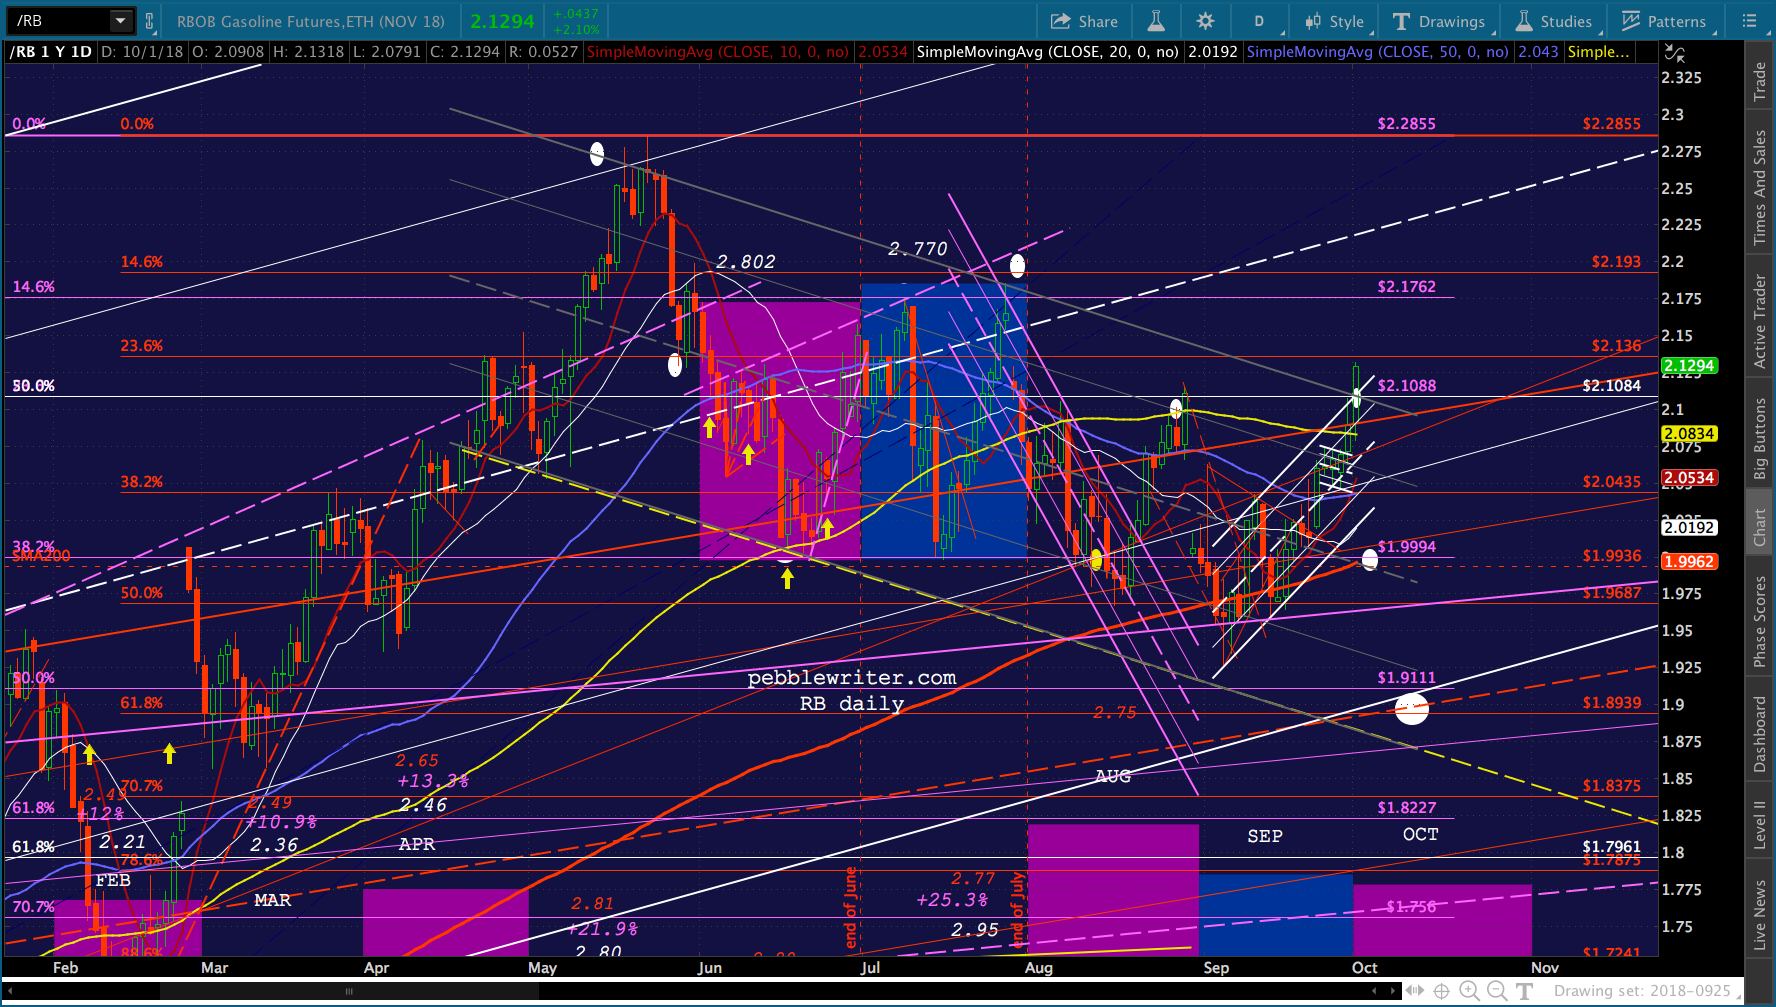
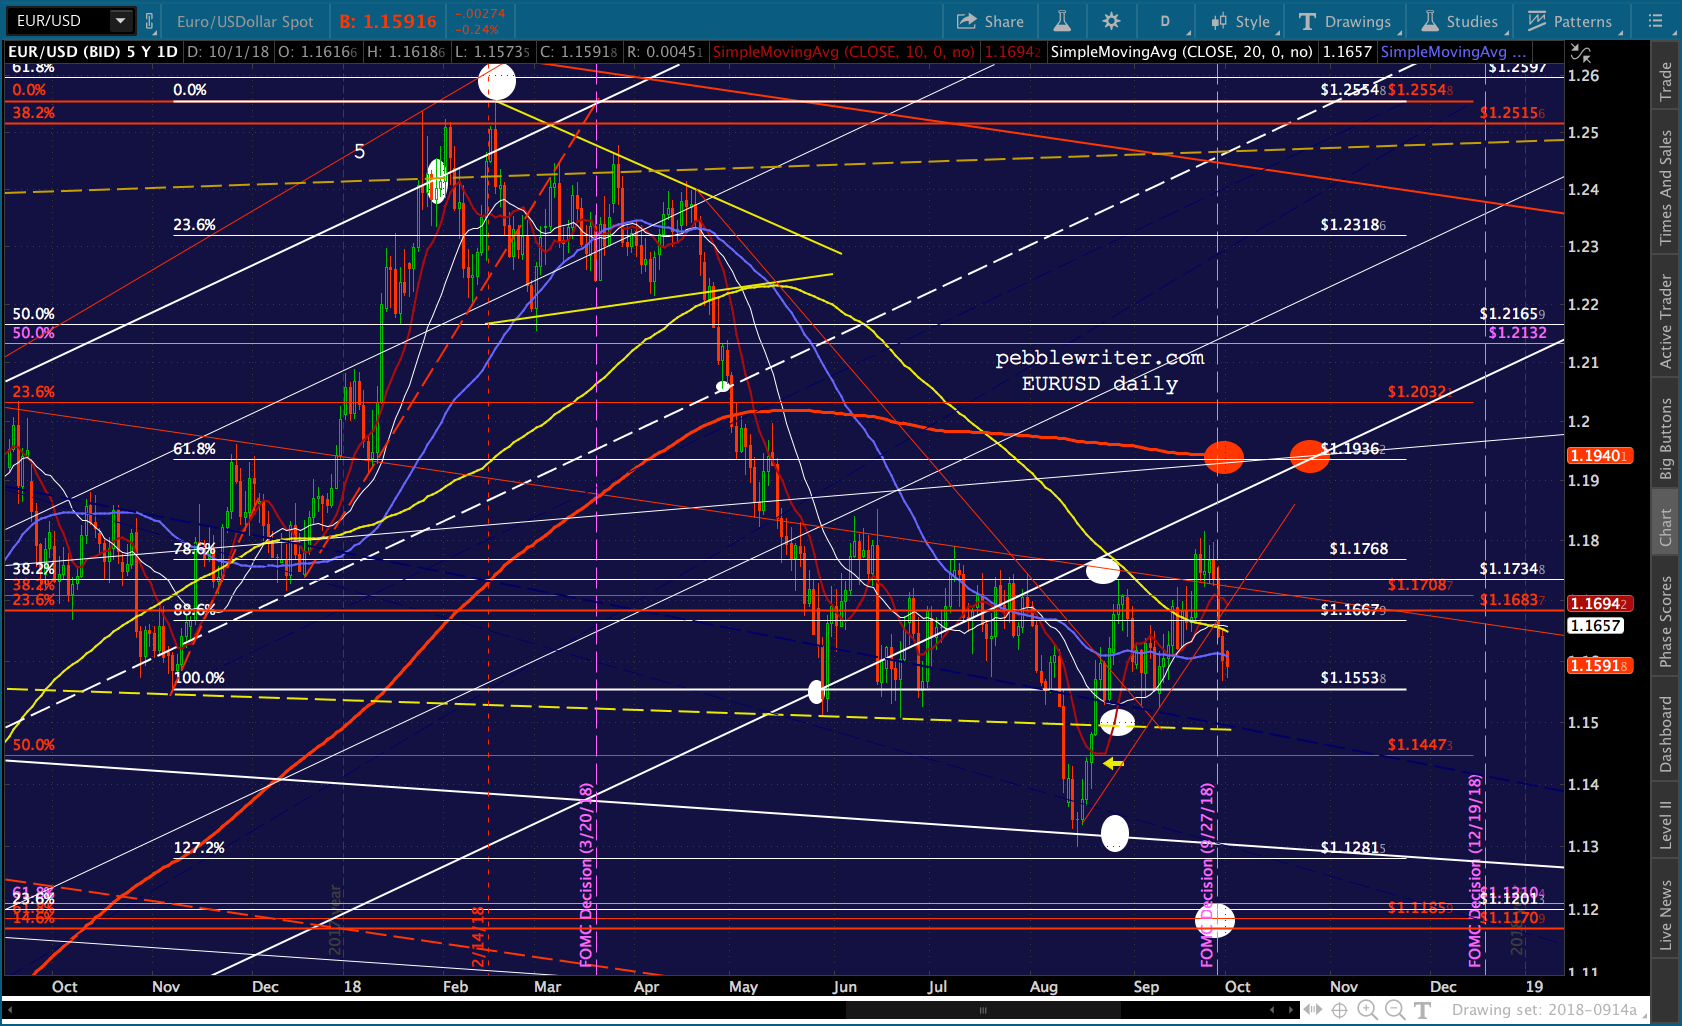 Oil and gas have stabilized, with RB in particular showing pretty good overhead resistance here.
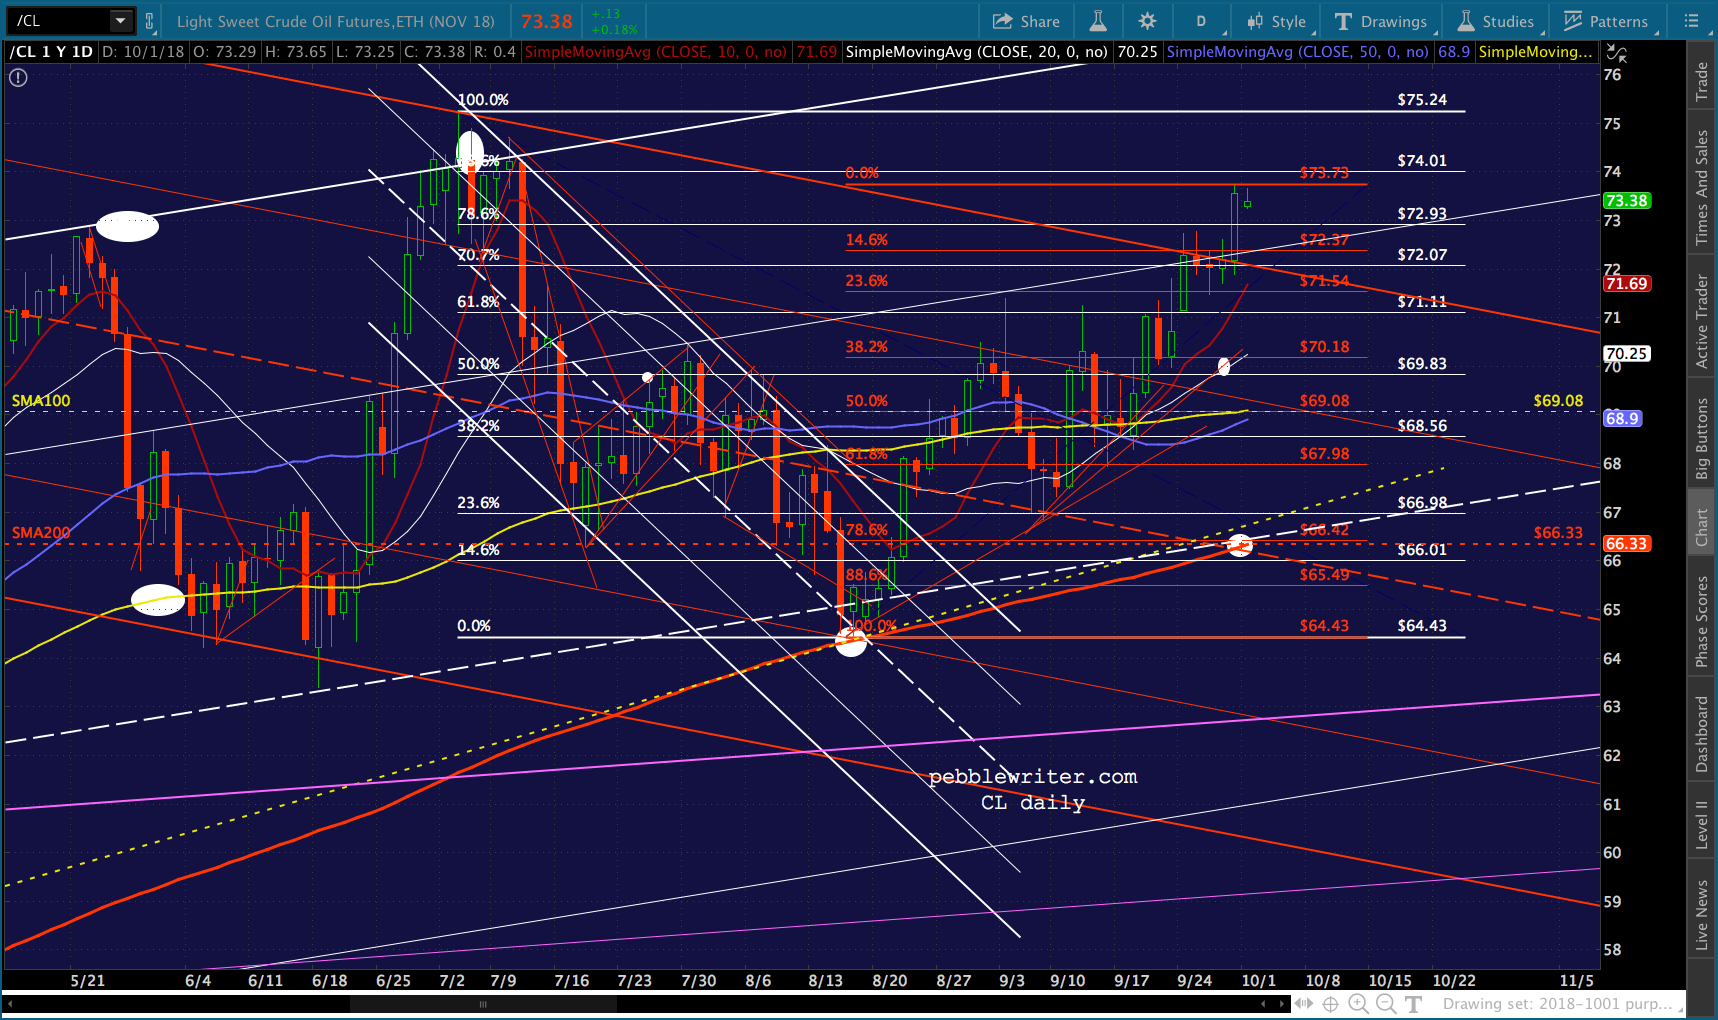
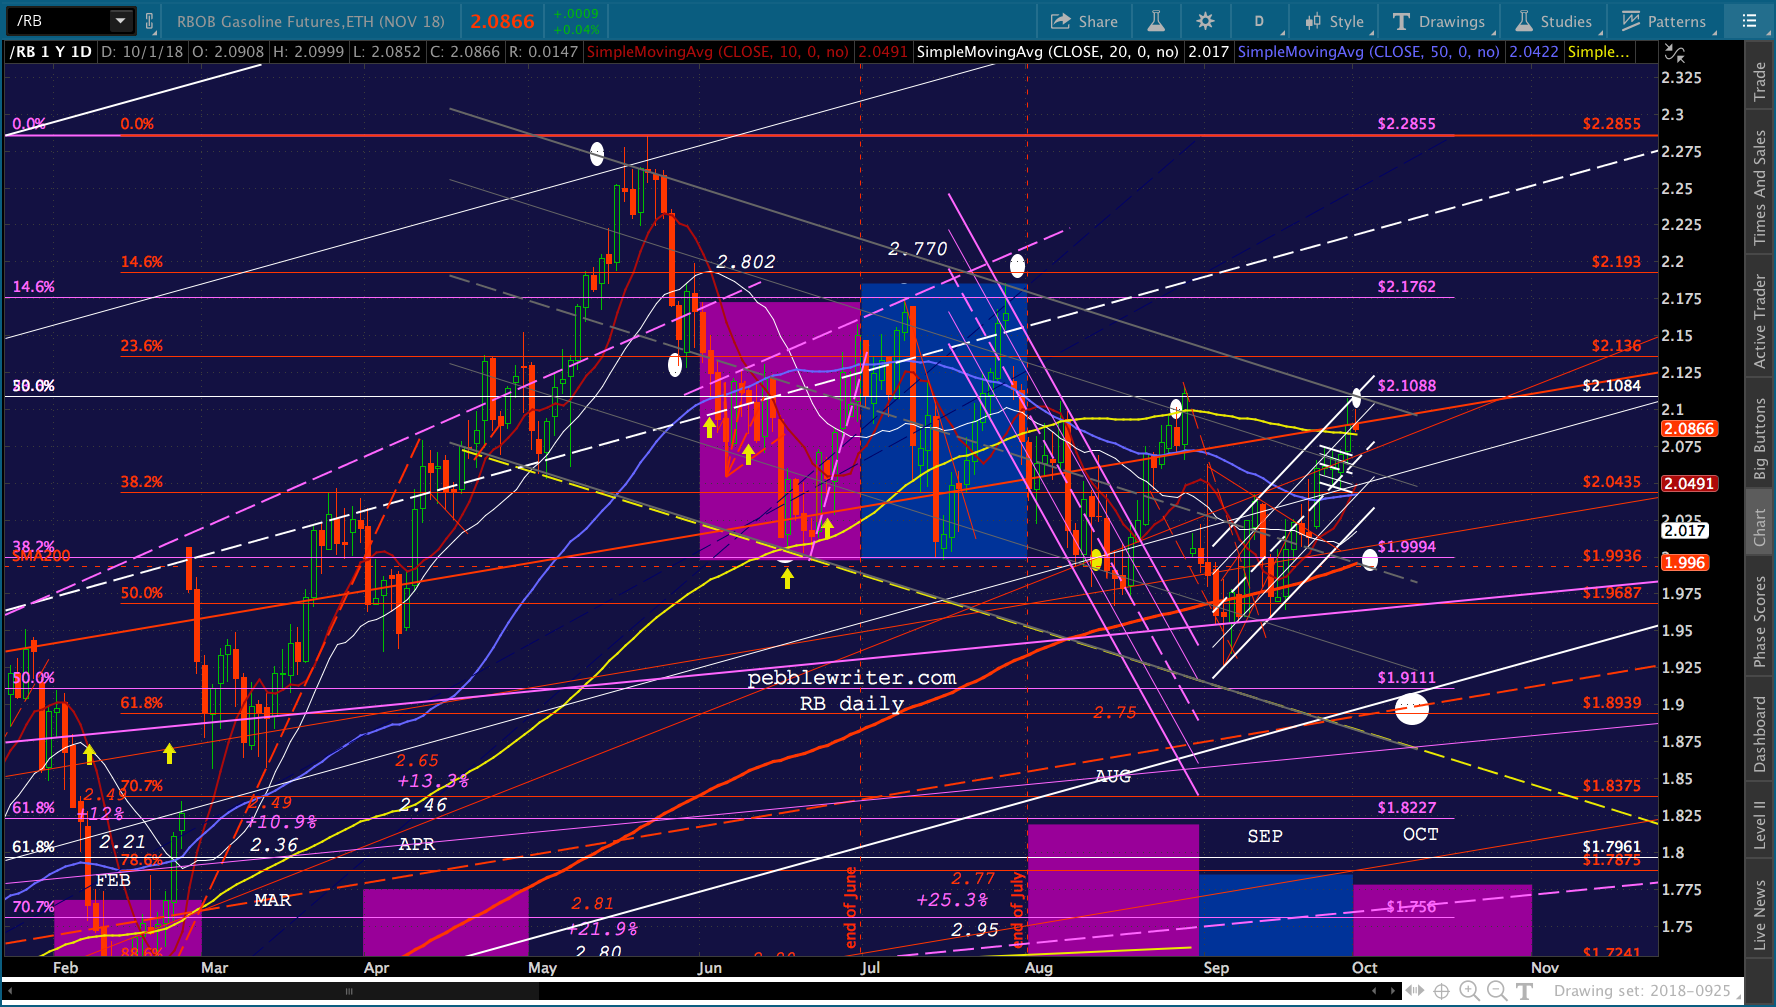
 I’m running out for some meetings this morning, will post later today.
GLTA.
UPDATE: 2:30 PM
Looks like we’re going to get a backtest after all – probably either the SMA5 200 or the channel top at around 2020.53 (it would close this morning’s gap.)
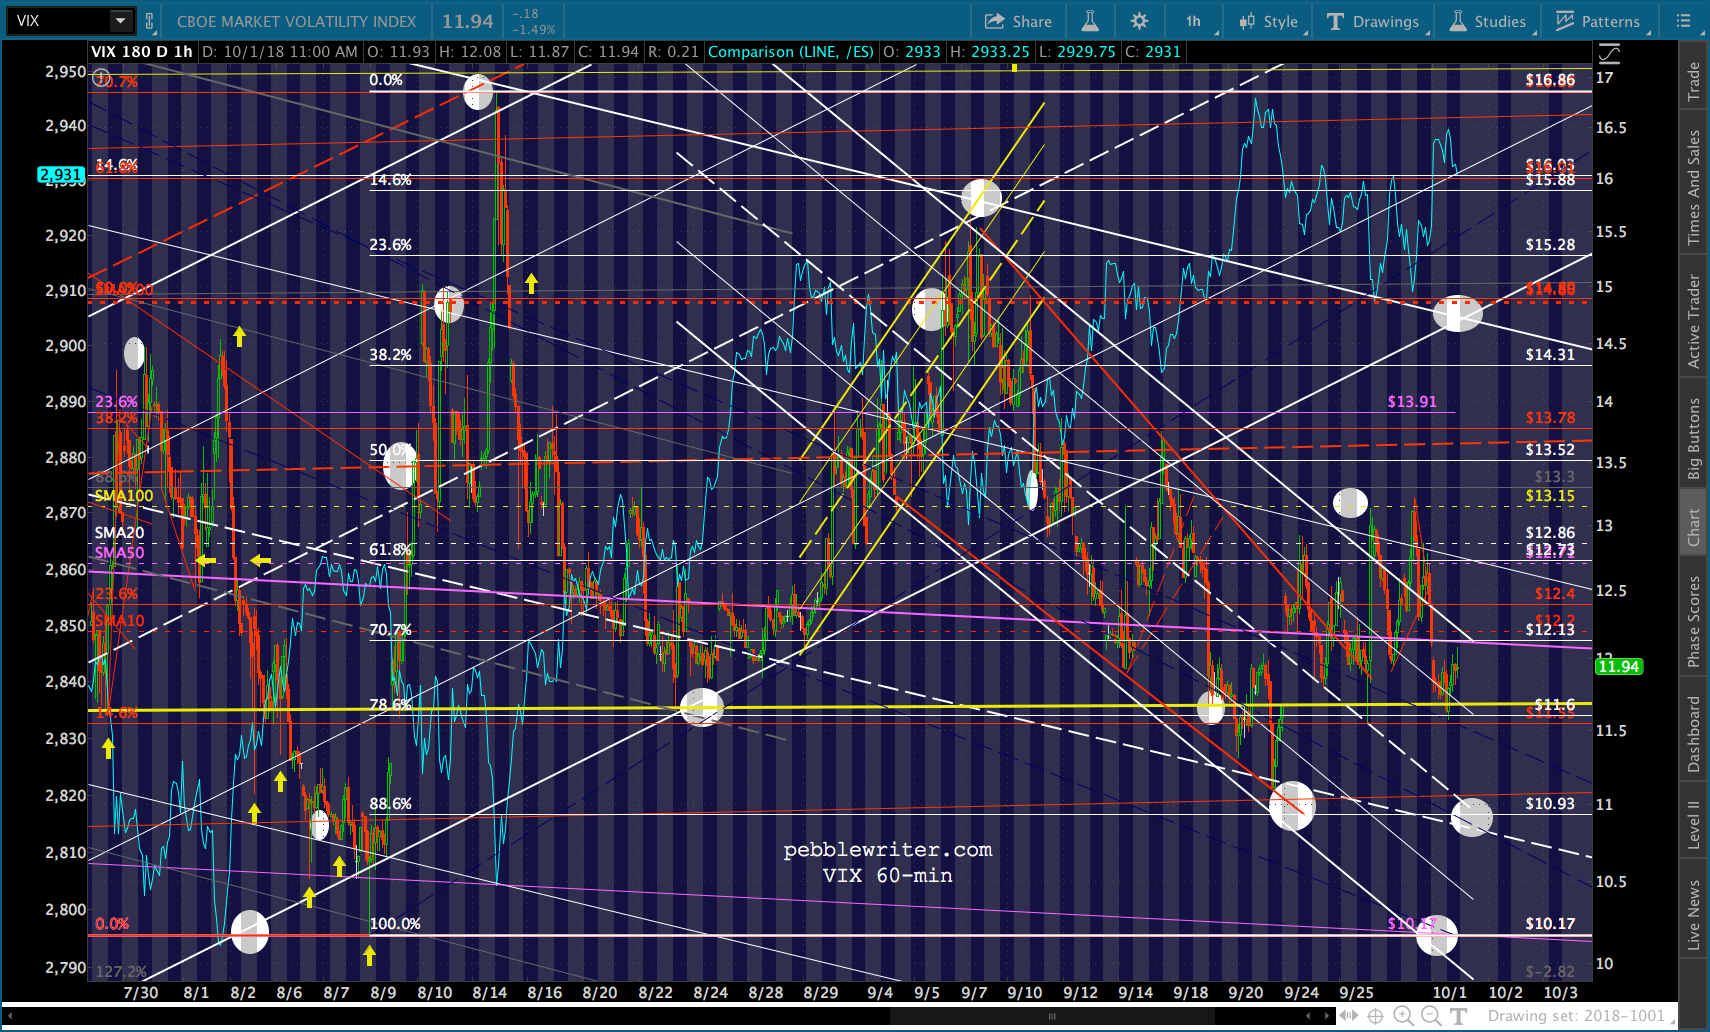
This, despite a yellow channel tag by VIX…
 …and, strong moves by both CL and (belatedly) RB.
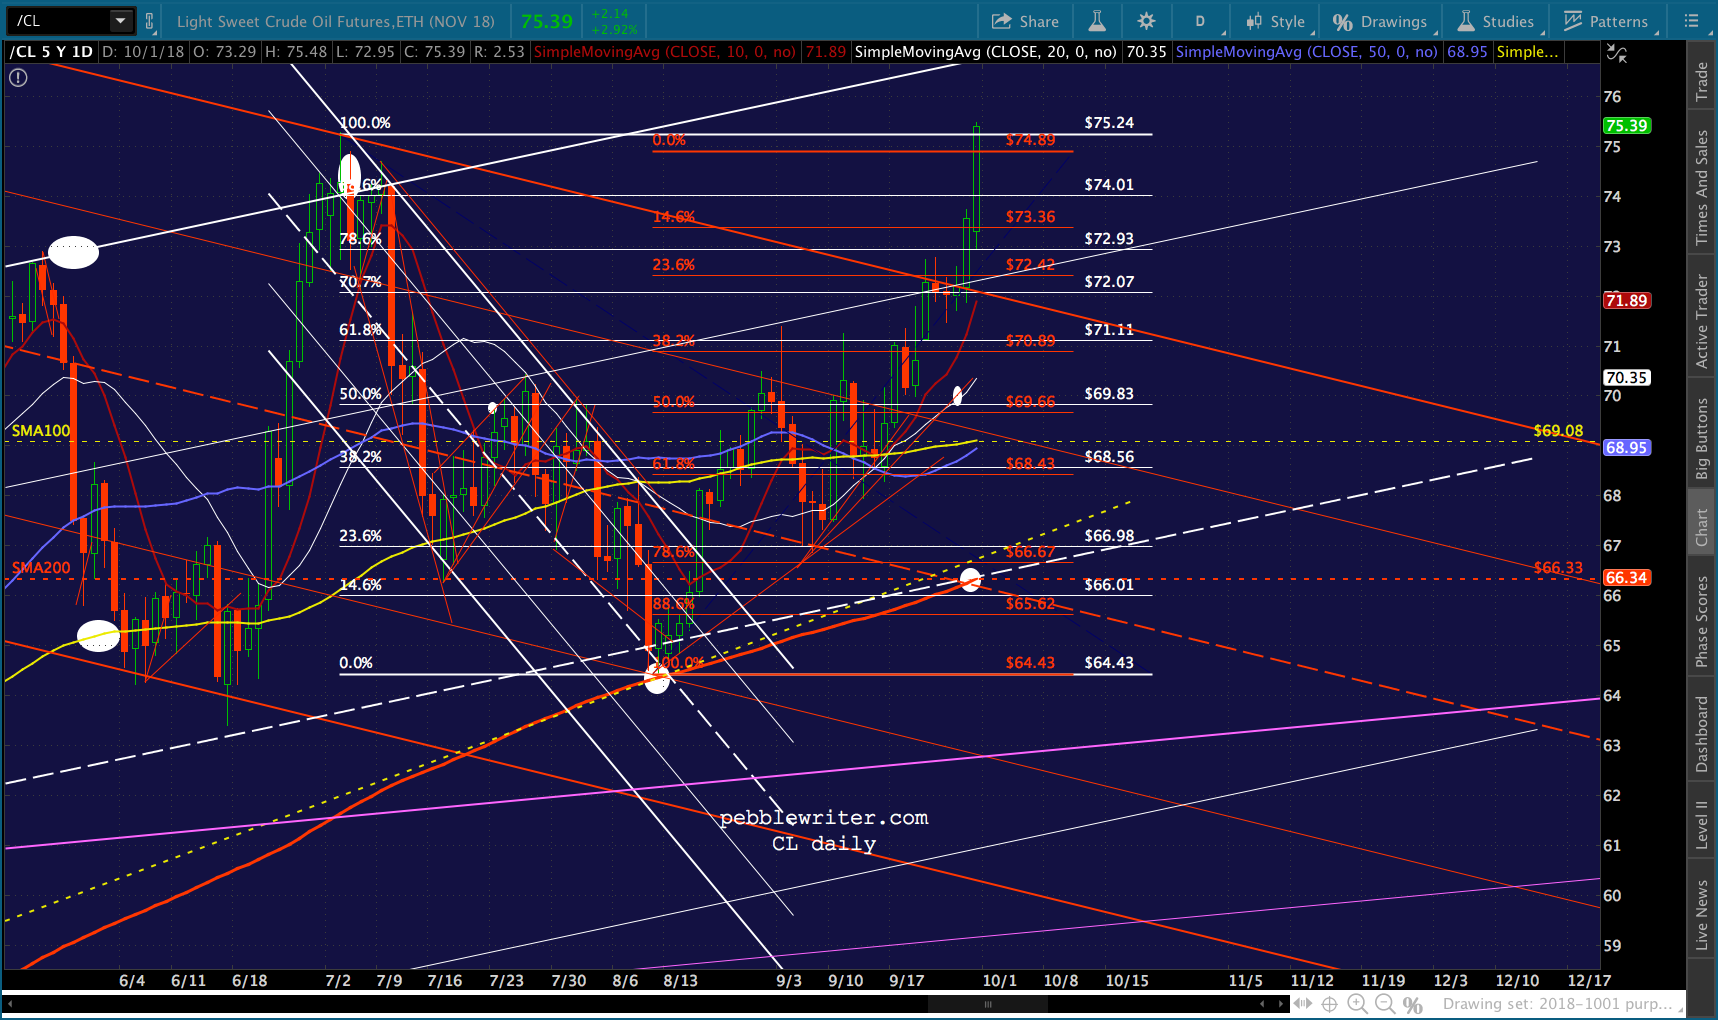
 Don’t be surprised if there’s a breakthrough in the Iran conflict in the very near future.
UPDATE: 3:30 PM
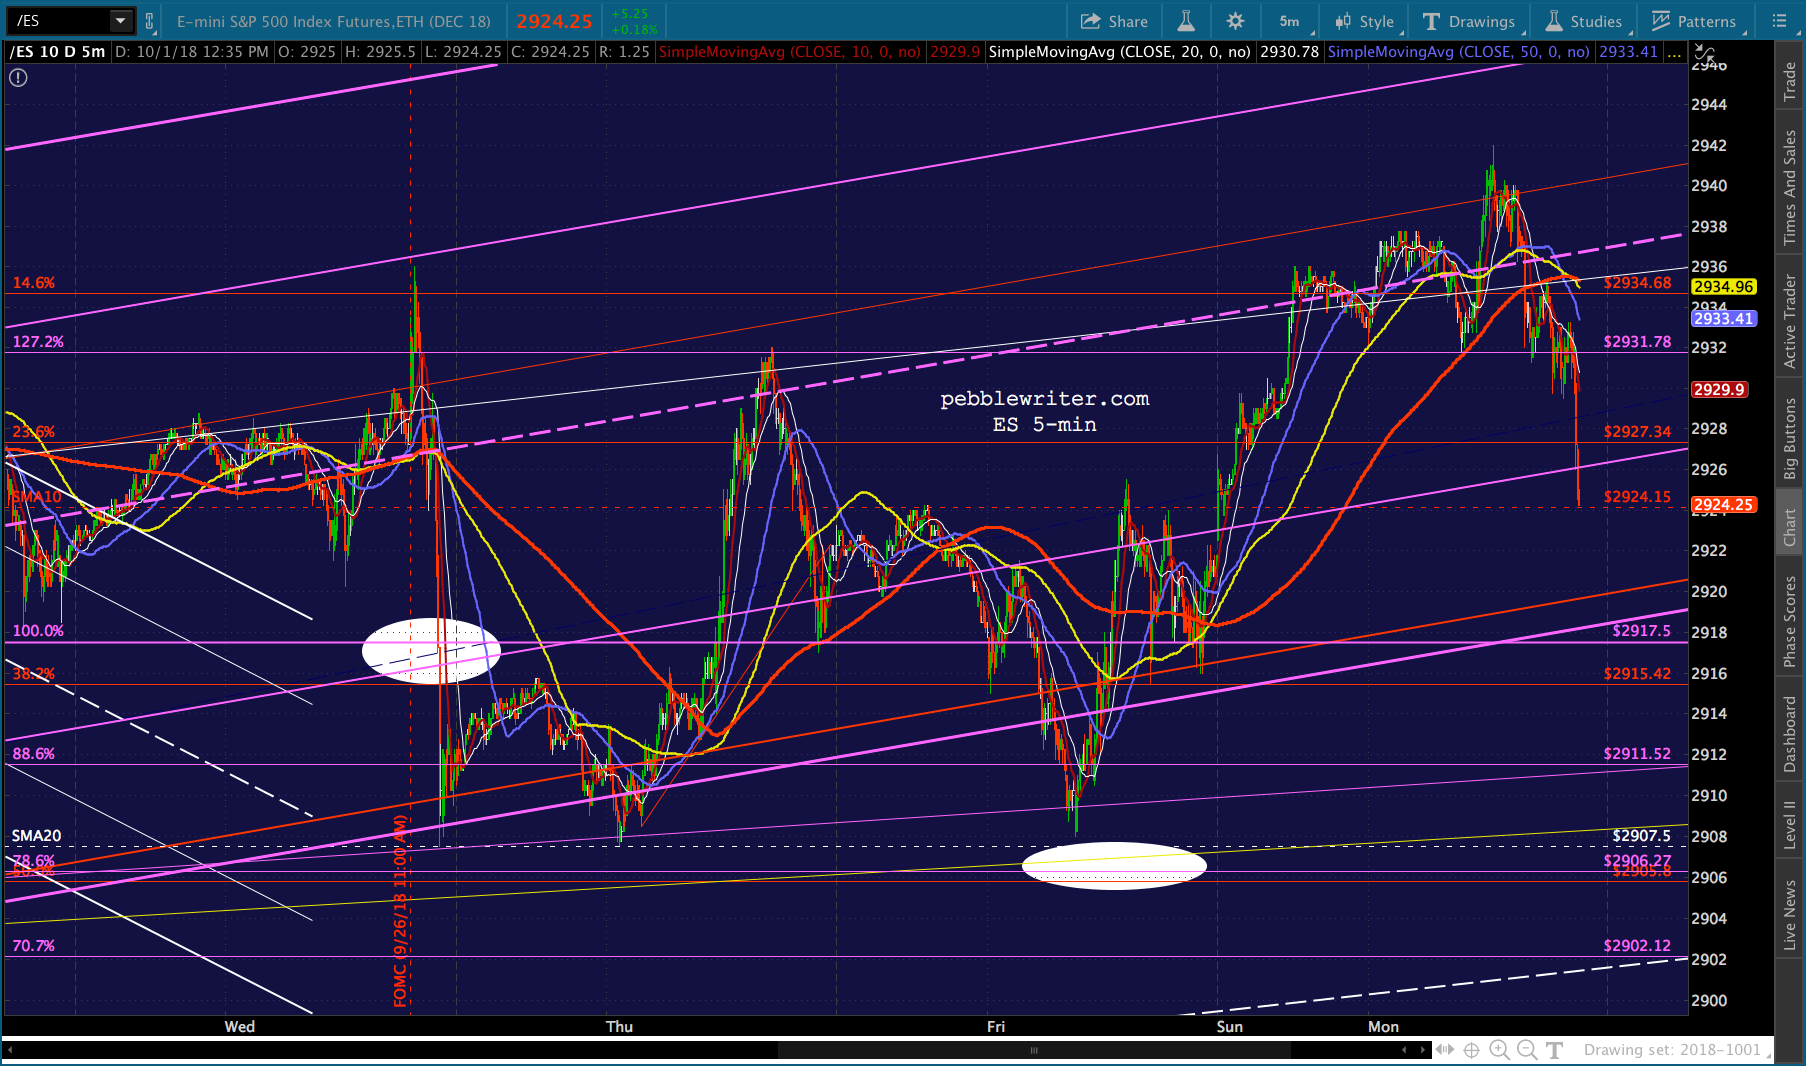
Gap closed. Anything lower than right here starts to smell pretty bearish – especially if ES drops through its SMA10.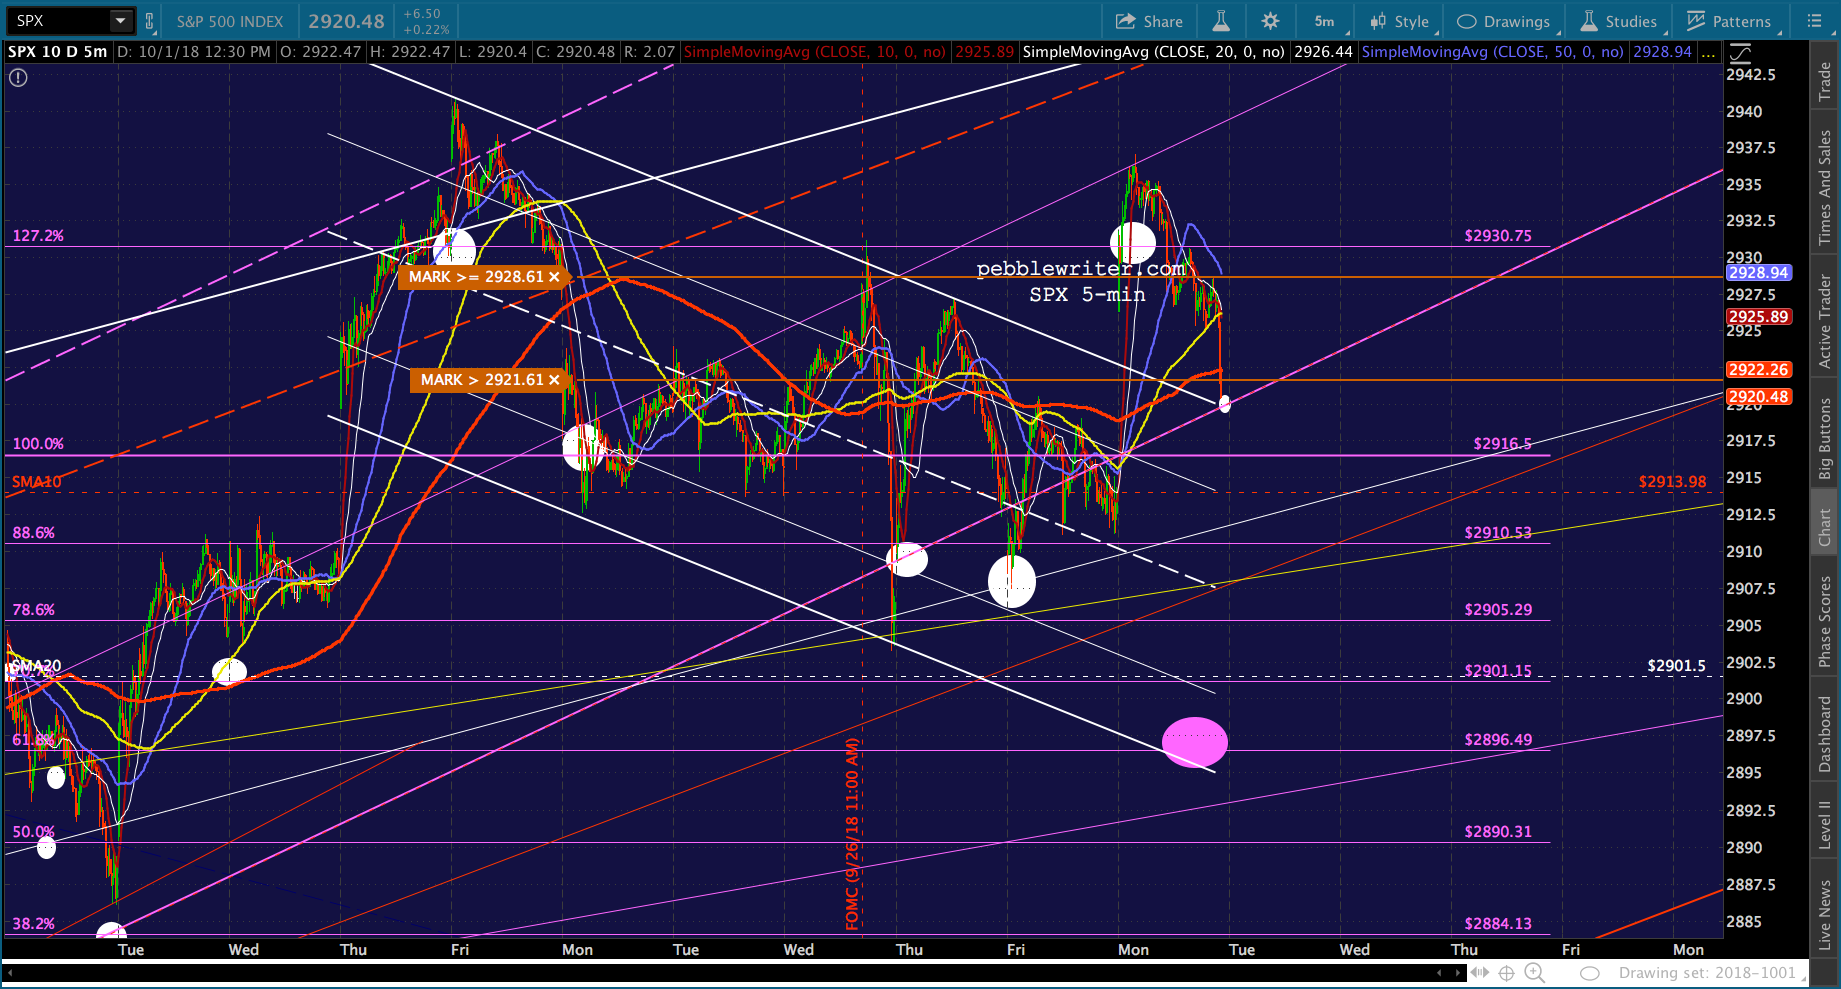
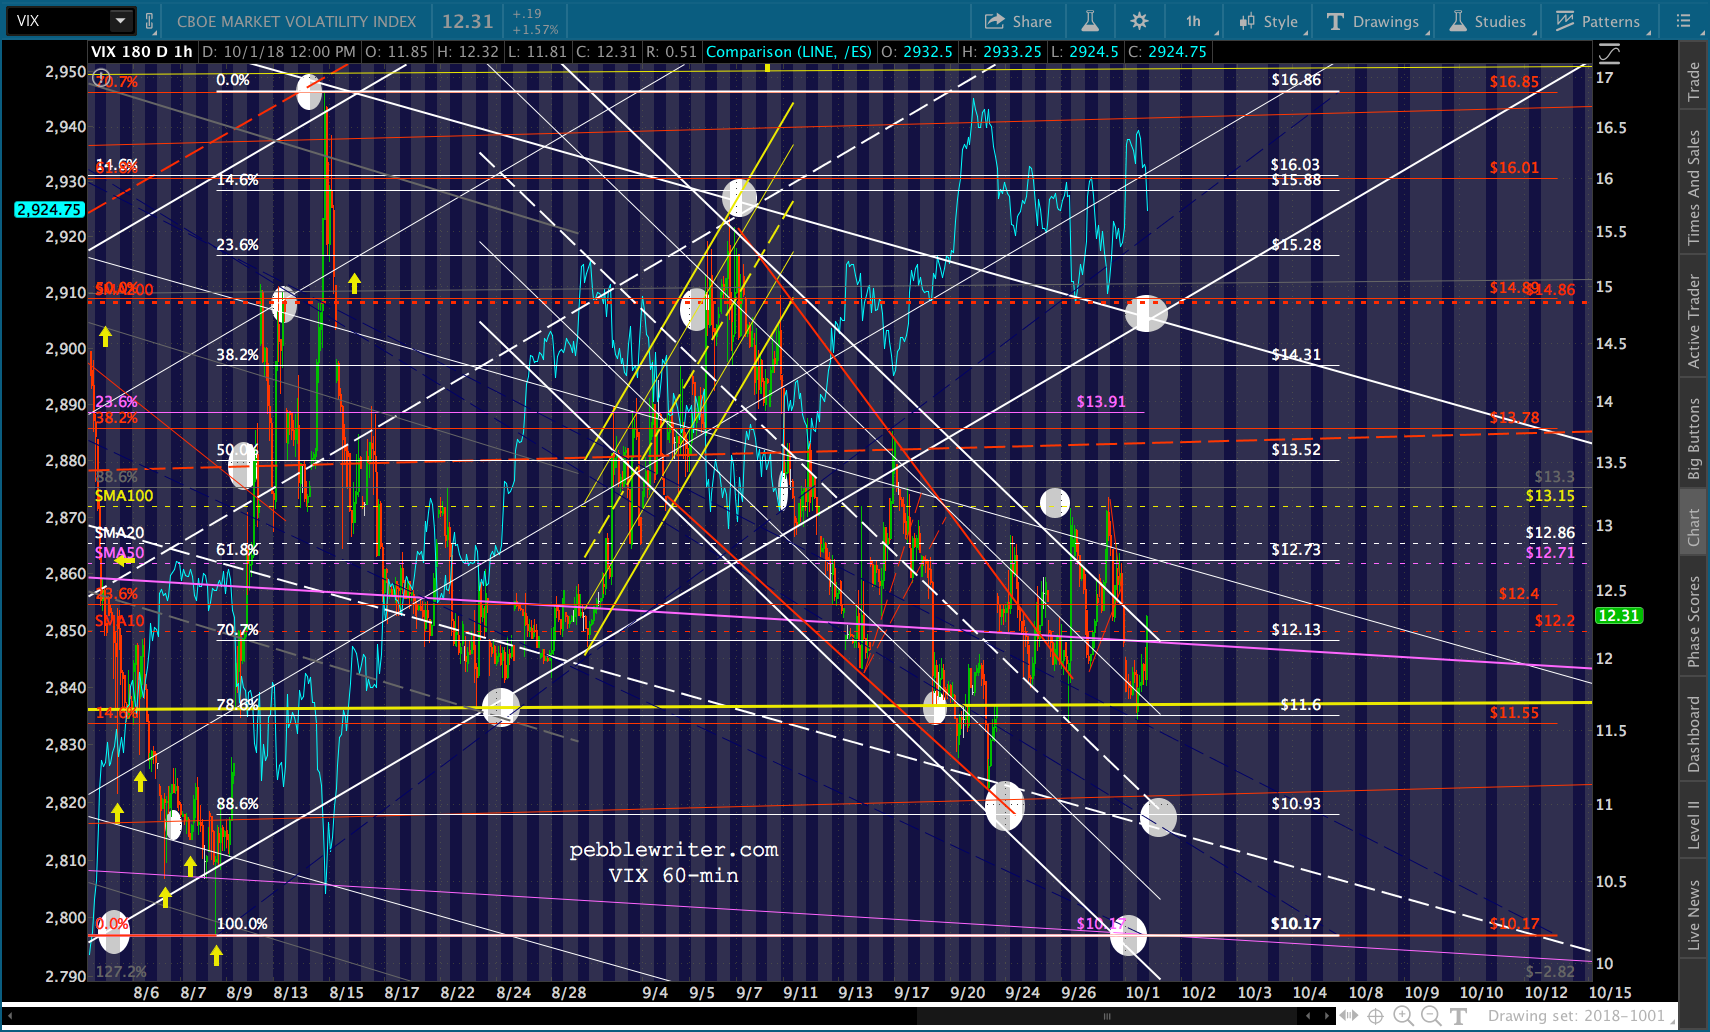 After tagging the yellow channel bottom, VIX has risen back out of the falling white channel. We saw this happen last week (without the yellow channel tag), but it turned out to be a head fake. The channel tag adds more legitimacy, meaning we’re likely to see SPX drop further.
FWIW, Robert Shiller was in the news today comparing this market to the late 1920s.