

Way back in February [see: Feb 13 Update on RUT] we noted that RUT had reached the top of a very long-term channel and was having trouble punching through.
The next few days are very important, as RUT has an opportunity to break above the yellow channel that dates back over 20 years. If it can…it will leave the rising yellow channel in the rear view and won’t face overhead resistance until the purple 2.24 at 1493 and the 1.618 at 1514.09.
As it happened, RUT couldn’t break out. It gained a few more points over the next two weeks, then reversed by 5.6%. It tried again in May. That attempt failed, too, resulting in a 5.2% drop. But, it still wasn’t done trying. In July it pushed through both the 1.272 Fib and the top of the yellow channel — only to tumble 7.1%.
This time was more serious, as the white channel dating back to its Feb 2016 lows broke down and RUT dropped through its 200-day moving average. But, it wasn’t quite done.
In our September 19 Update, I pointed out that — due largely to a series of strong collapses in VIX — RUT was knocking on the door yet again.  Would it be able to punch through this time?
I think it’s going to come down to what the USD does tomorrow. If DXY finds support between here and 88.68, then stocks could get a nice boost and maybe RUT can break out this time. If not, and if oil/gas tumble further as we’re expecting, then a drop to the SMA200 around 1385-1392 would make a lot of sense, with 1296 next in line.
As it turned out, DXY found strong support the very next day — spiking higher and not looking back. But, oil and gas decided to spike higher, too. CL suddenly popped above a long-term trend line (on bearish news) and RB aborted the plunge from its dramatic Aug 31 peak. Oh, and VIX spent the next several sessions making new lows. In other words, RUT had plenty of algo firepower this time, and popped through the yellow channel top where it just tagged our upside target of 1514.09.
So, it’s a good time to ask what’s next for the index — especially as SPX and ES have also reached overhead resistance.
continued for members…
First, the big picture showing the yellow channel that was just broken out of.
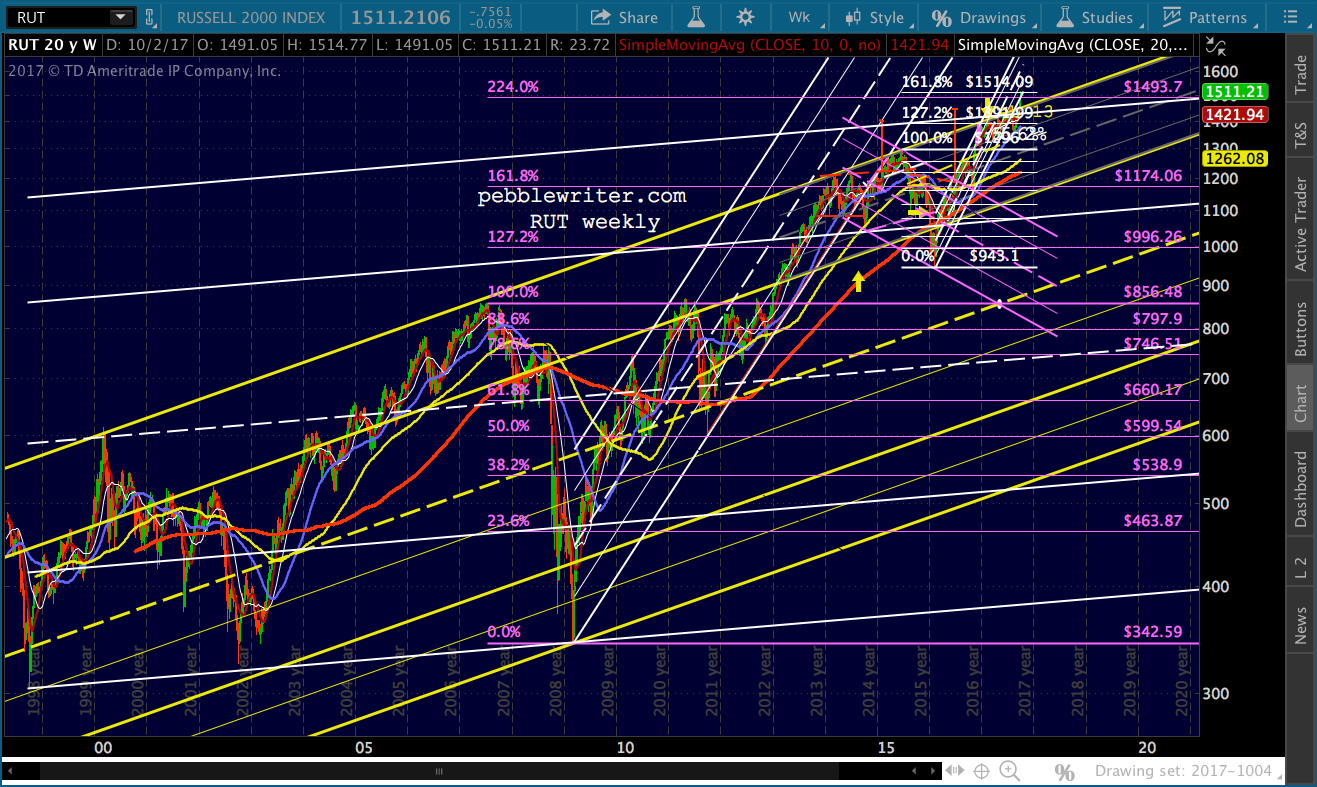 We’ll zoom in a little bit…
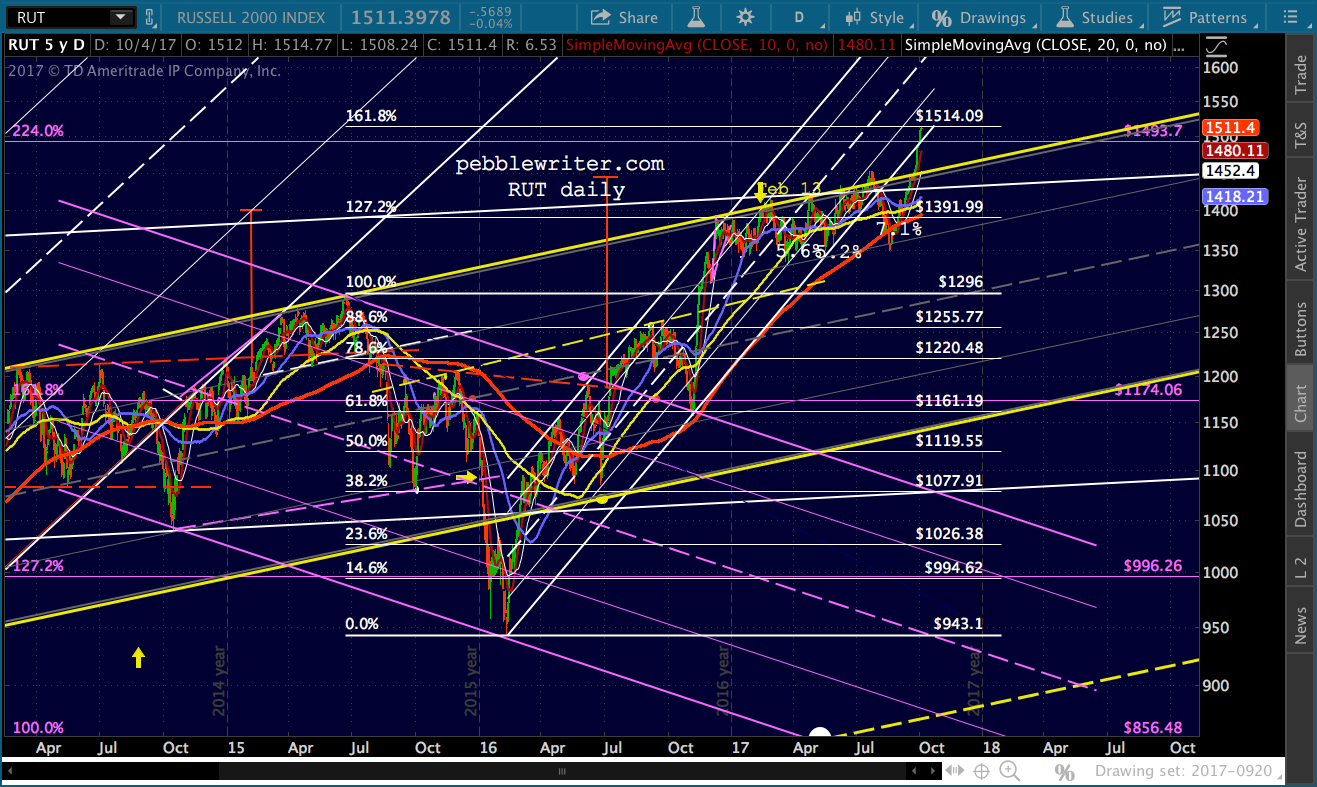 …and, just a bit more. Note that in addition to the 1.618, the larger scale 2.24 was also tagged. So, we have more than just one reason to reverse here. In the bulls’ favor, the rising white channel was rejoined — typically a positive development. Of course, it depends on whether or not RUT can hold the white channel bottom – now, about 1495.
 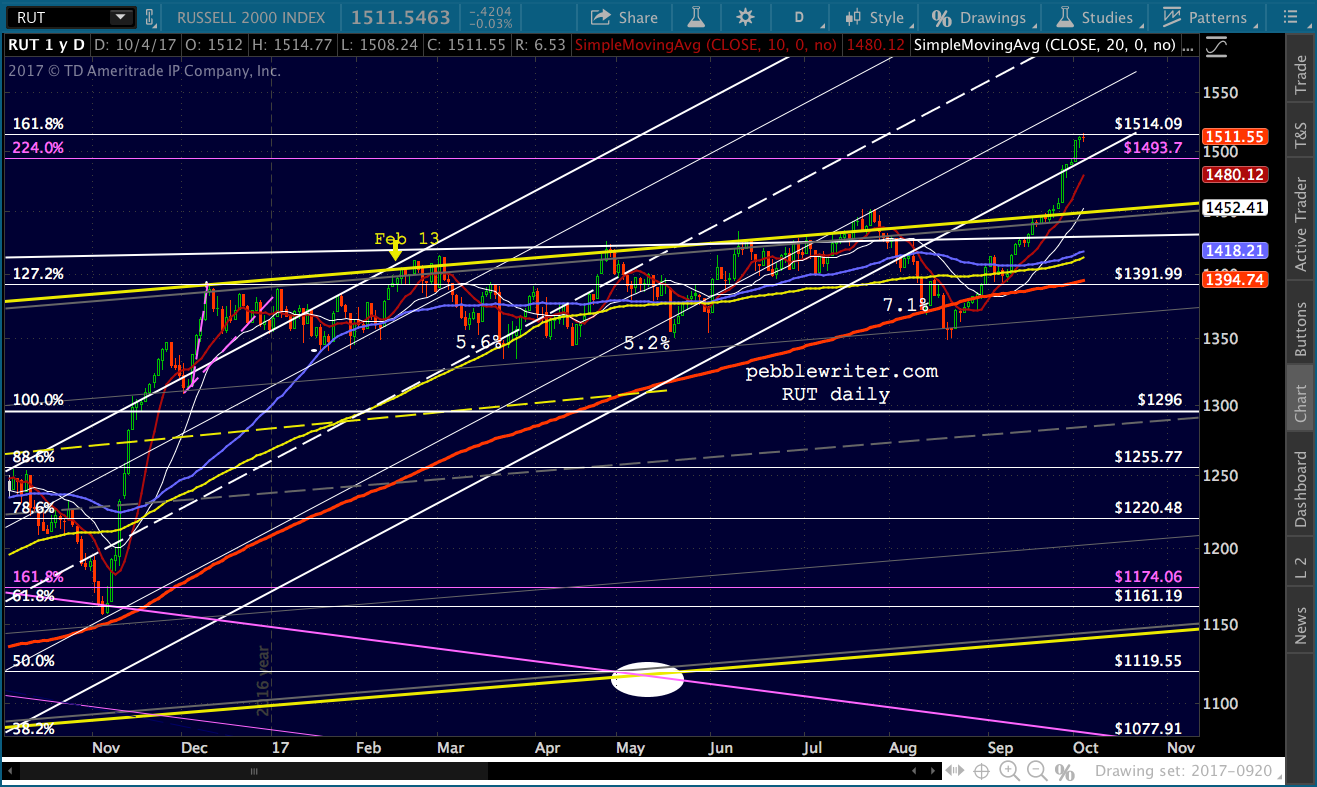 If not, look for RUT to at least backtest the yellow channel top, now at 1450 (a 4.2% drop and my base case.) If that should fail, then things get really interesting. RUT has proven to not have great staying power (it’s harder to manipulate than SPX or DJIA.) If 1450 breaks, then the 1.272 at 1391.99 comes into view — about where the SMA200 is currently.
If RUT somehow holds 1514.09 and the reacquired rising white channel, then it doesn’t have much resistance until it reaches 1733 — another 14.5% higher. In other words, that yellow channel top will continue to play a huge role in what to expect next.
Stay tuned.