

In our last update on RUT [see: Feb 13 Update] I noted that RUT had returned to test an important Fib level at 1392 and the top of a long-term channel after a very modest setback the first time around a few months earlier.  The path forward was a little murky, so I laid out both sides of the ledger.
Head fake, or a sign of weakness? The next few days are very important, as RUT has an opportunity to break above the yellow channel that dates back over 20 years… At this point, support is up to 1330 and, after that, at 1296. If it can break 1400, it will leave the rising yellow channel in the rear view and won’t face overhead resistance until the purple 2.24 at 1493 and the 1.618 at 1514.09. The latest IH&S targets 1444, which is in the middle of nowhere.
As it turns out, I was fairly close on the targets — RUT found support at 1335 and rallied as high as 1452 — but, things aren’t all that much clearer.
RUT pushed above 1392 the very next day, but couldn’t make any headway. Thirteen sessions later, it was back below 1392, tumbling 5.6% to make new lows. It mounted another effort in late April. Again, the rally failed and it fell 5.2% (but, to higher lows.) More failed rallies followed in June and July, with the last producing a 7% decline. Every time RUT rallied, it produced a higher high. And, every time it slid, it produced a higher low — except the last. The Aug 18 low was slightly lower than the May 18 low.
It might not matter, but that decline also represented a breakdown of the rising white channel which had been guiding prices higher since Feb 11, 2016 (yep, the day oil bottomed) and also produced a rare drop through the SMA200.
The SMA200 was since recovered, but RUT has now reached a key Fib retracement of the latest drop and is…drum roll please…back at the top of the rising yellow channel. At the risk of repeating myself: “head fake, or a sign of weakness?”
continued for members…
First, for those wondering how it turned out the way it did, note that VIX played a huge role in each higher high by collapsing each time RUT was in trouble. Aside from global thermonuclear war, there’s nothing to keep it from doing so again.
 RUT is back at the yellow channel top and .886 of the latest drop.
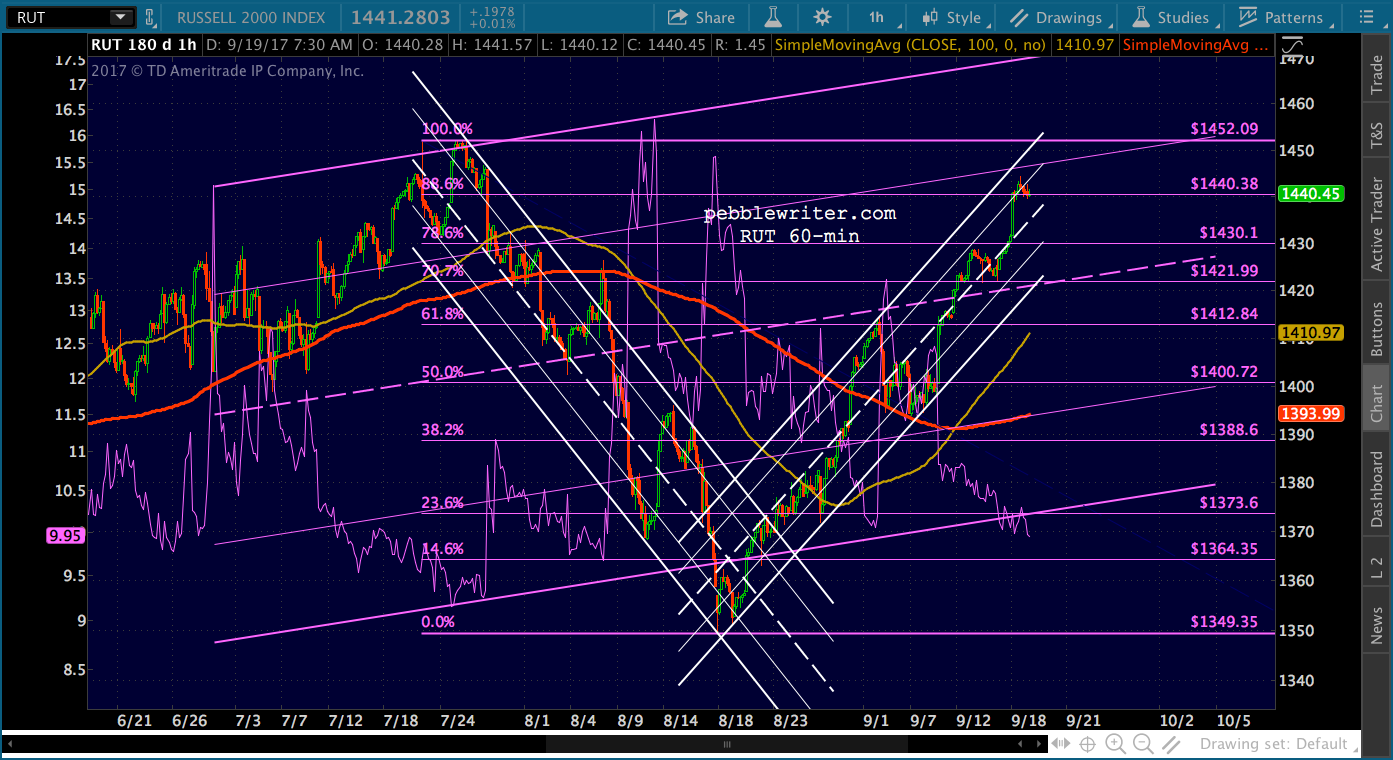 Should we focus on the .886 Fib and yellow channel top? And, what about the broken white channel…bearish, right?
Ordinarily, absolutely bearish. Yet, RUT has made a career out of pushing higher after its channels break down. The latest white channel itself is such a response to the breakdown of the previous white channel.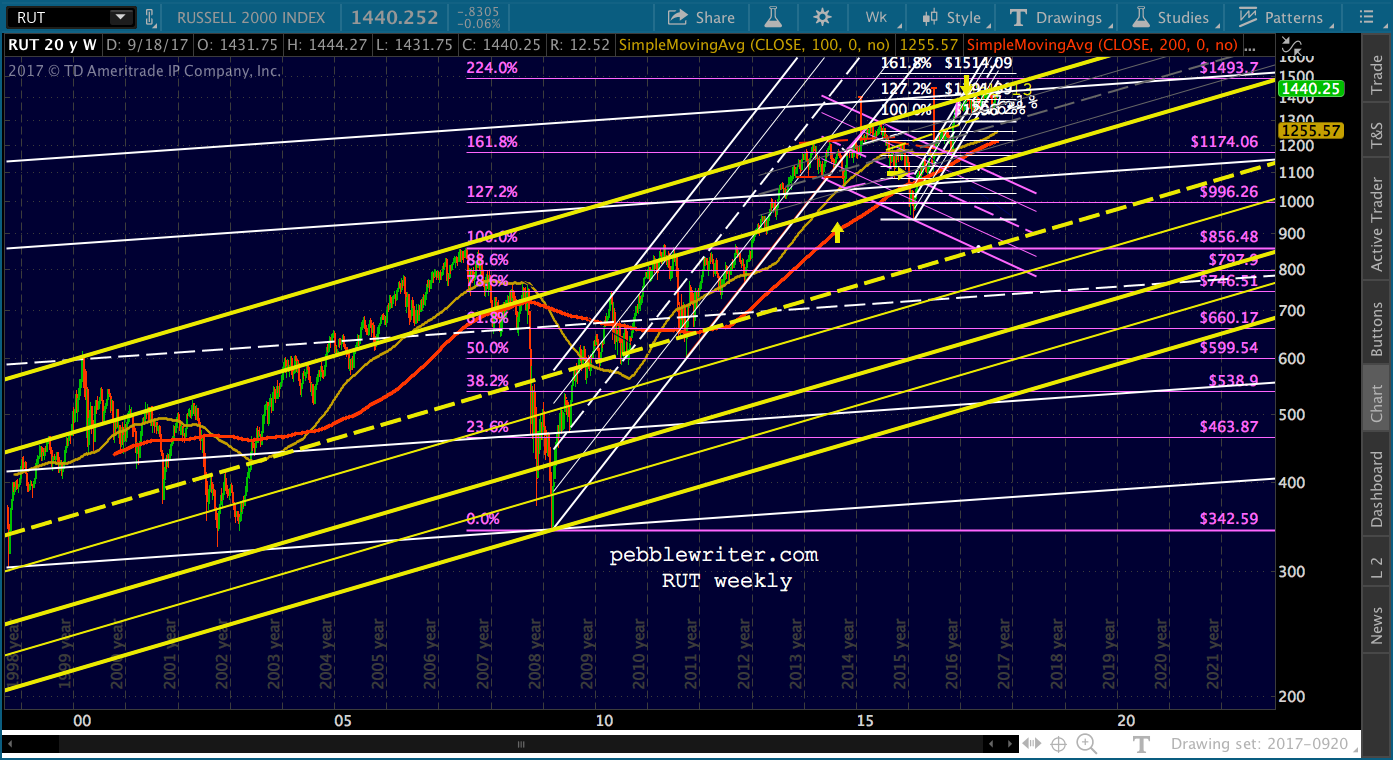 In other words, this is charting dirty pool. Nothing surprises me much anymore. In fact, it needn’t break out or break down at all. It could continue to ratchet higher for the rest of the year, two steps forward and one step back.
Clearly, if RUT fails to push through the .886 at 1440.38 and previous high at 1452.09, we can look for another 5-7% drop. Though, with the SMA200 approaching the 1.272, they might try to put a floor in at 1392. If things go to hell, it’s worth noting that the 1296 high (Jun 2015) has yet to be backtested. That would be a 9.9% drop. There hasn’t been a drop that big since the one ending in Feb 2016.
I think it’s going to come down to what the USD does tomorrow. If DXY finds support between here and 88.68, then stocks could get a nice boost and maybe RUT can break out this time. If not, and if oil/gas tumble further as we’re expecting, then a drop to the SMA200 around 1385-1392 would make a lot of sense, with 1296 next in line.
Stay tuned.