

The dominoes are all lined up so nicely. Who’s going to tip the first one over? continued for members…
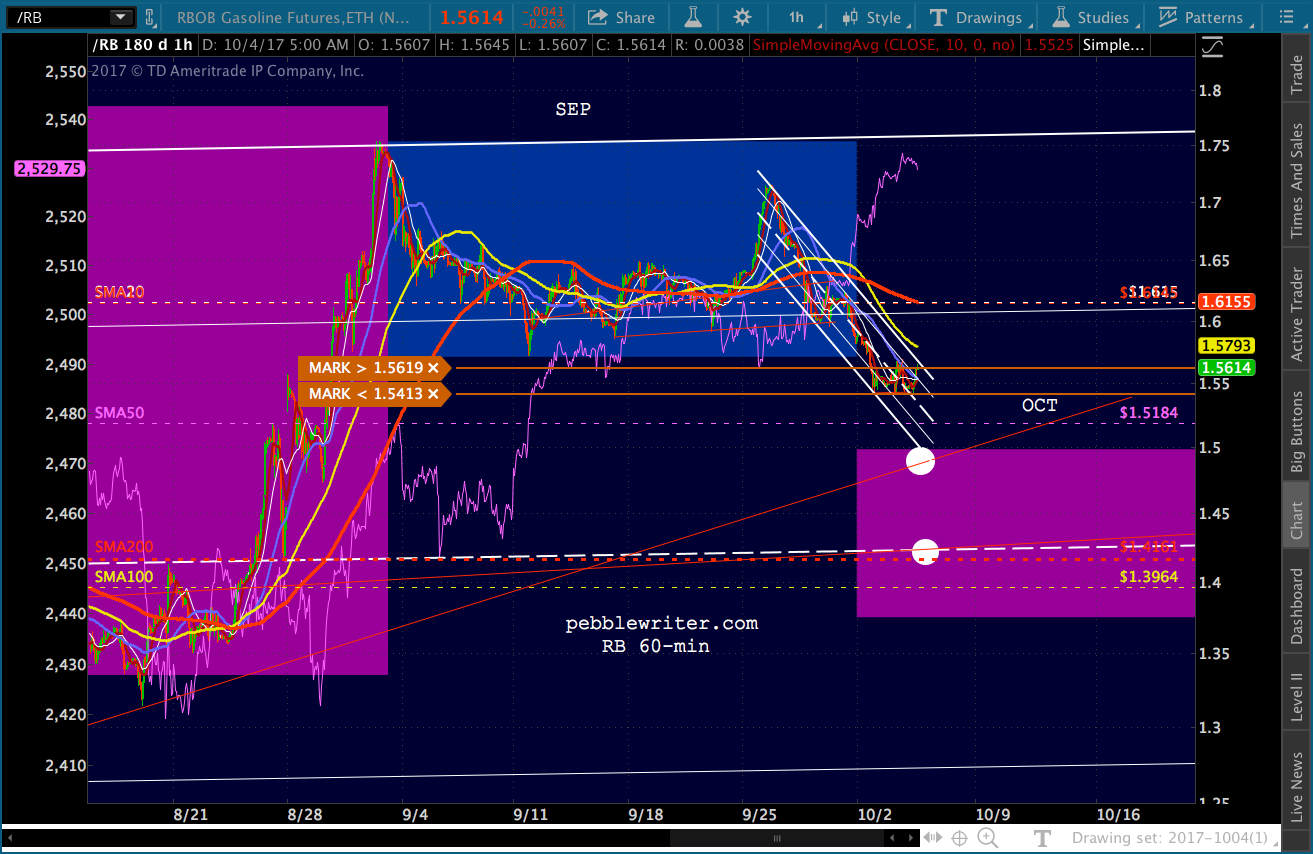
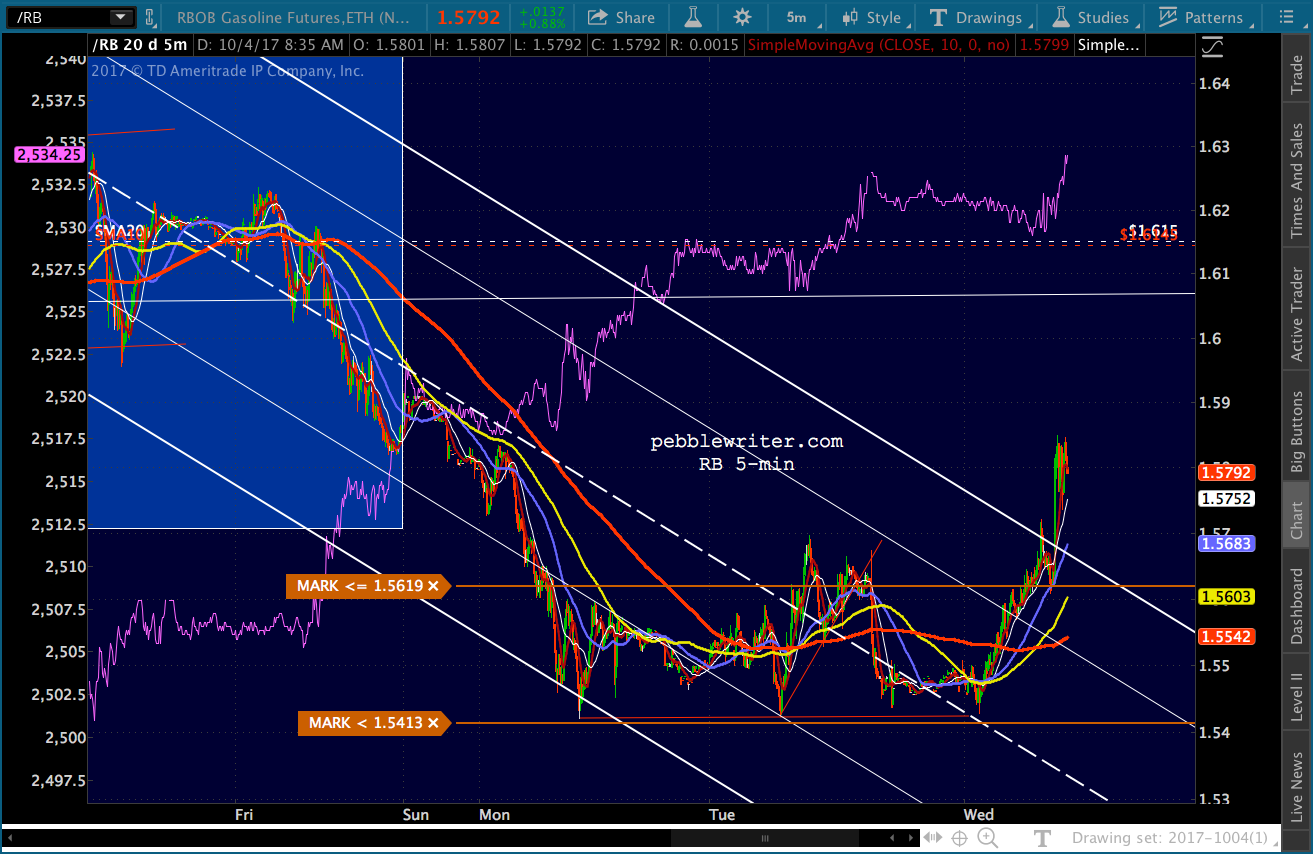
I’ve drawn in the price range from October 2016 for RB. Yesterday’s API data was fairly bearish. Hopefully, we’ll get a good read on where the Fed’s going from this morning’s EIA report. The falling white channel looks workable and would accommodate a quick plunge, with or without a recovery.
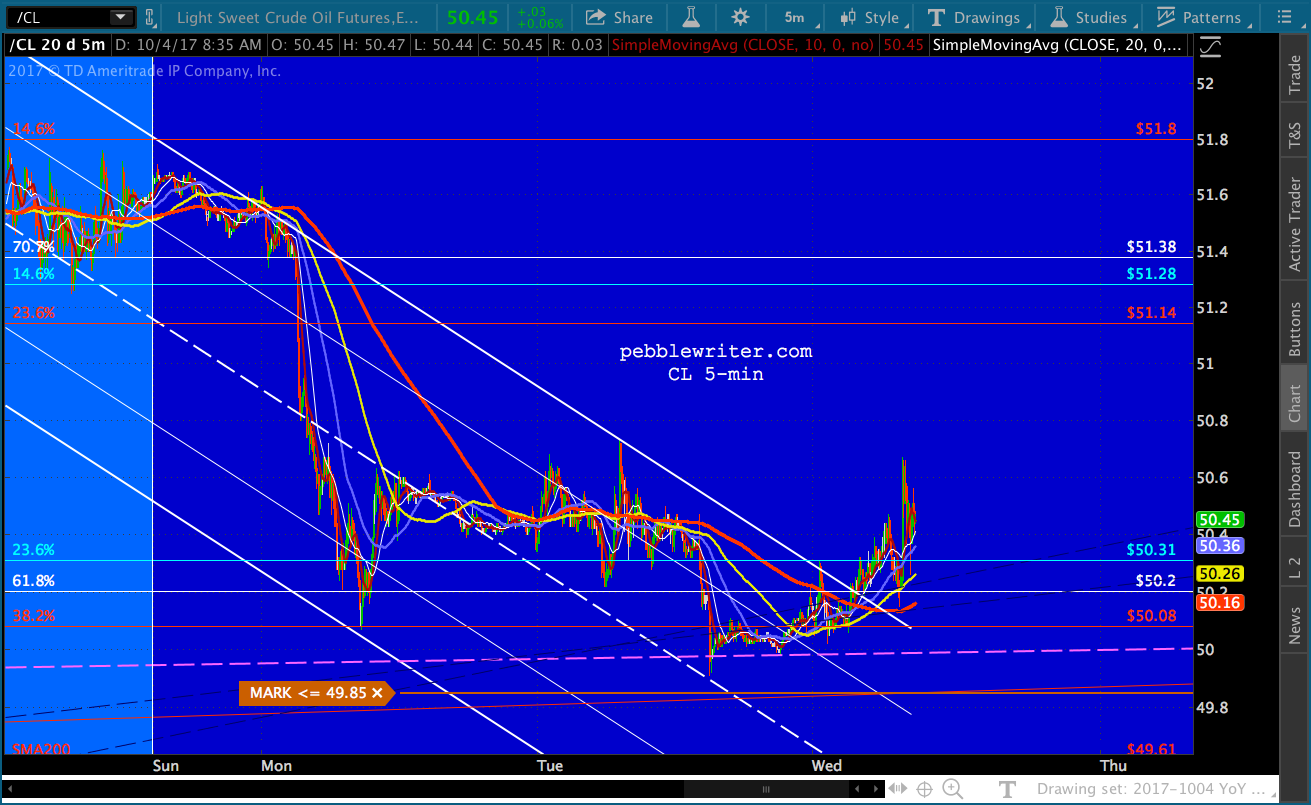
 CL, positioned fairly neutrally for CPI purposes, is still hanging just above its SMA200.
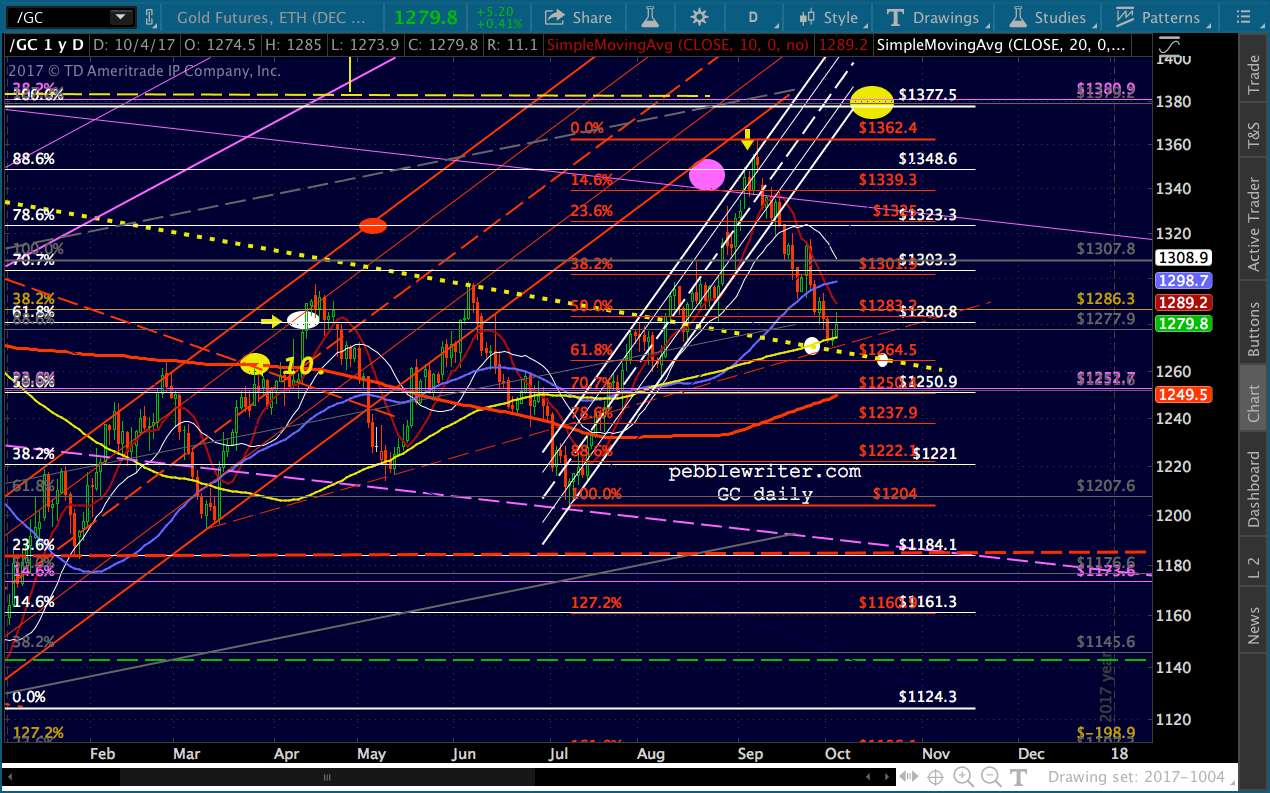
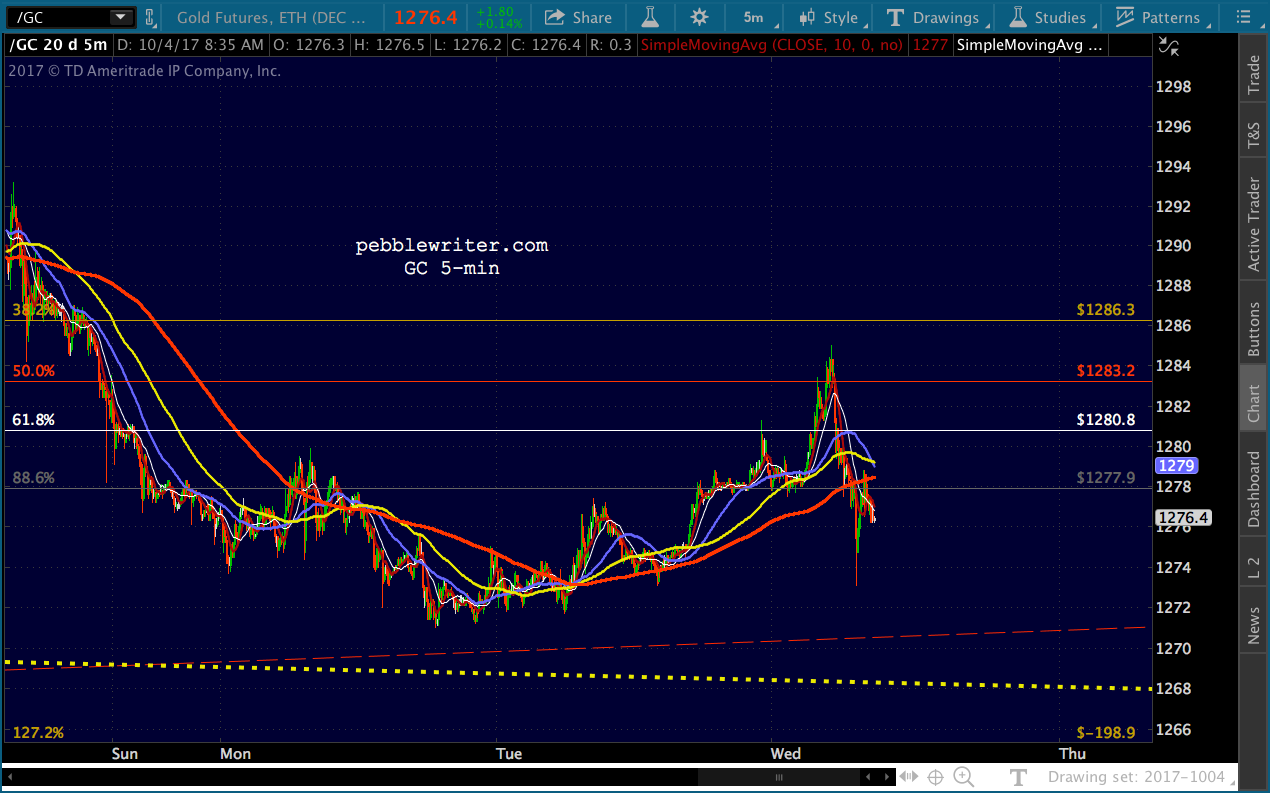
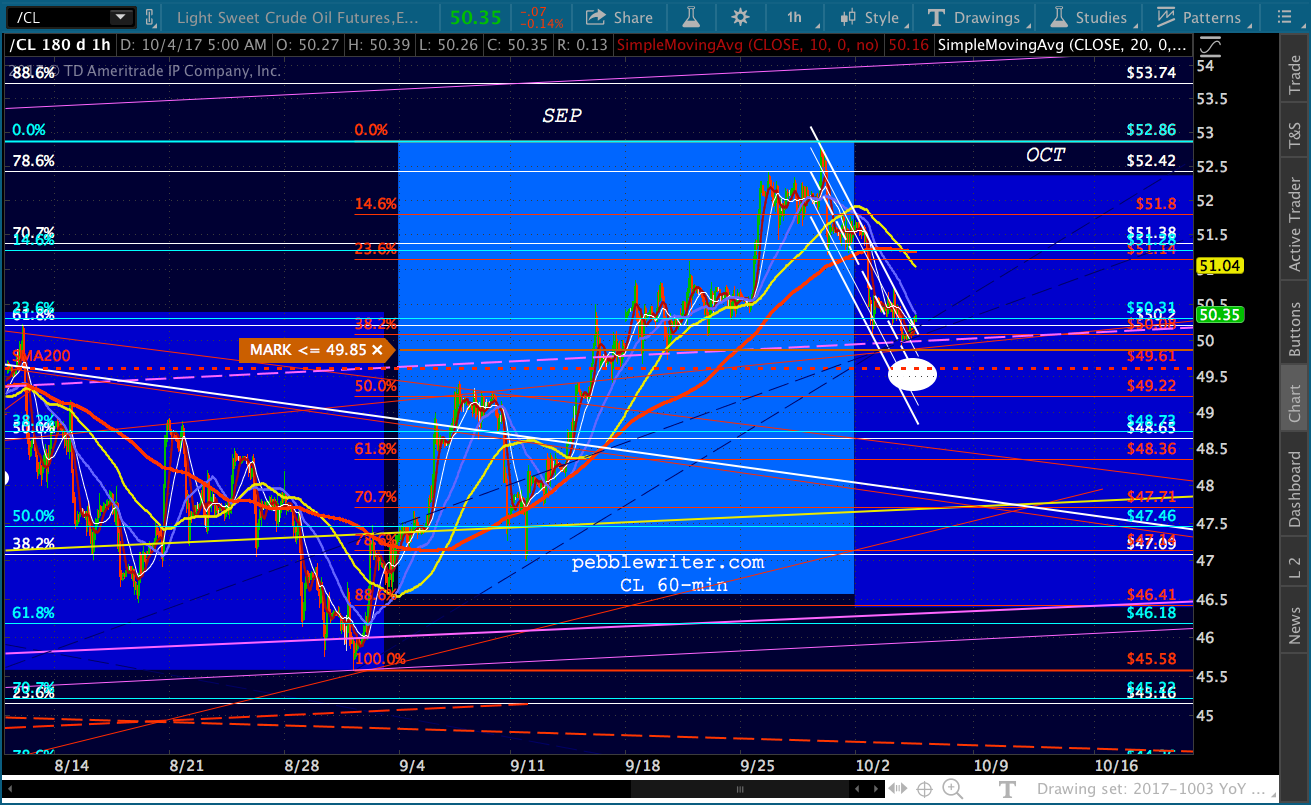 GC got a nice bounce overnight but seems to be backing off.
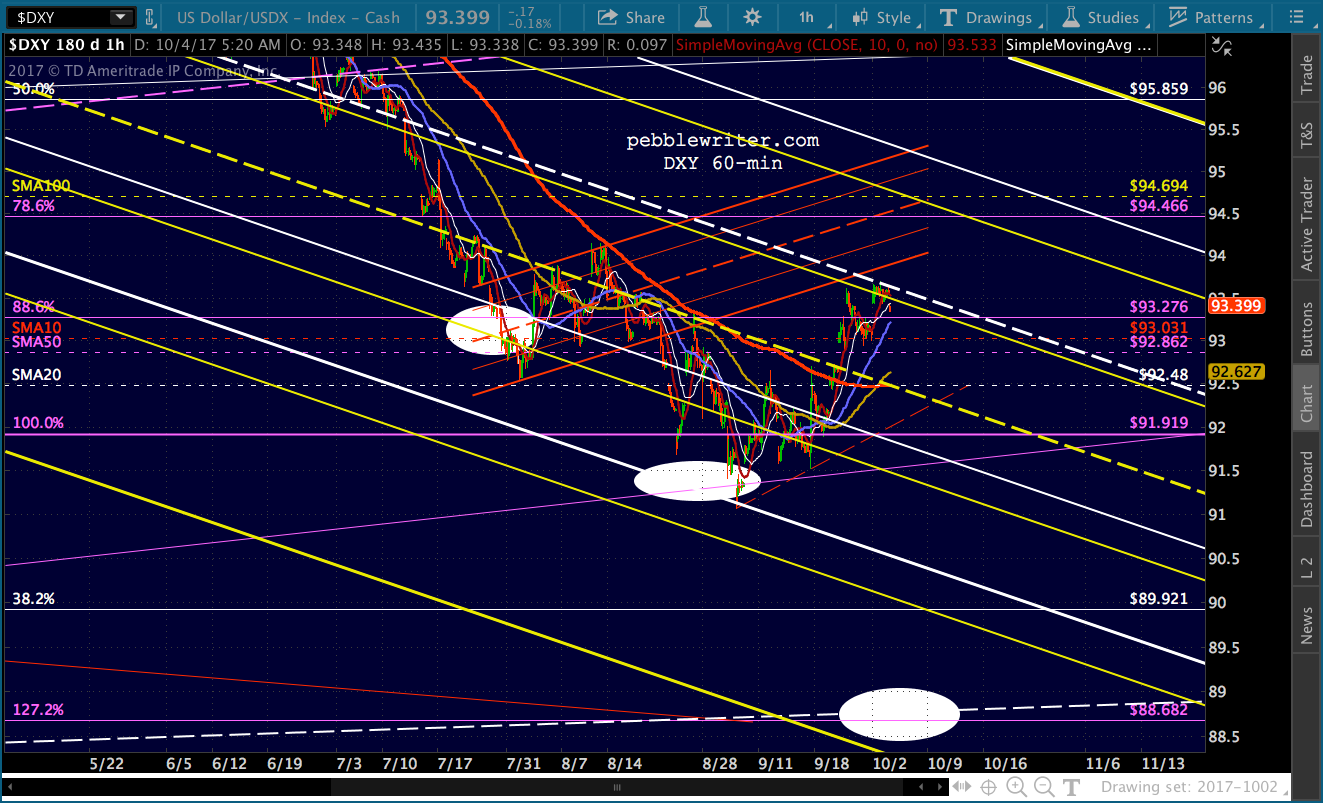
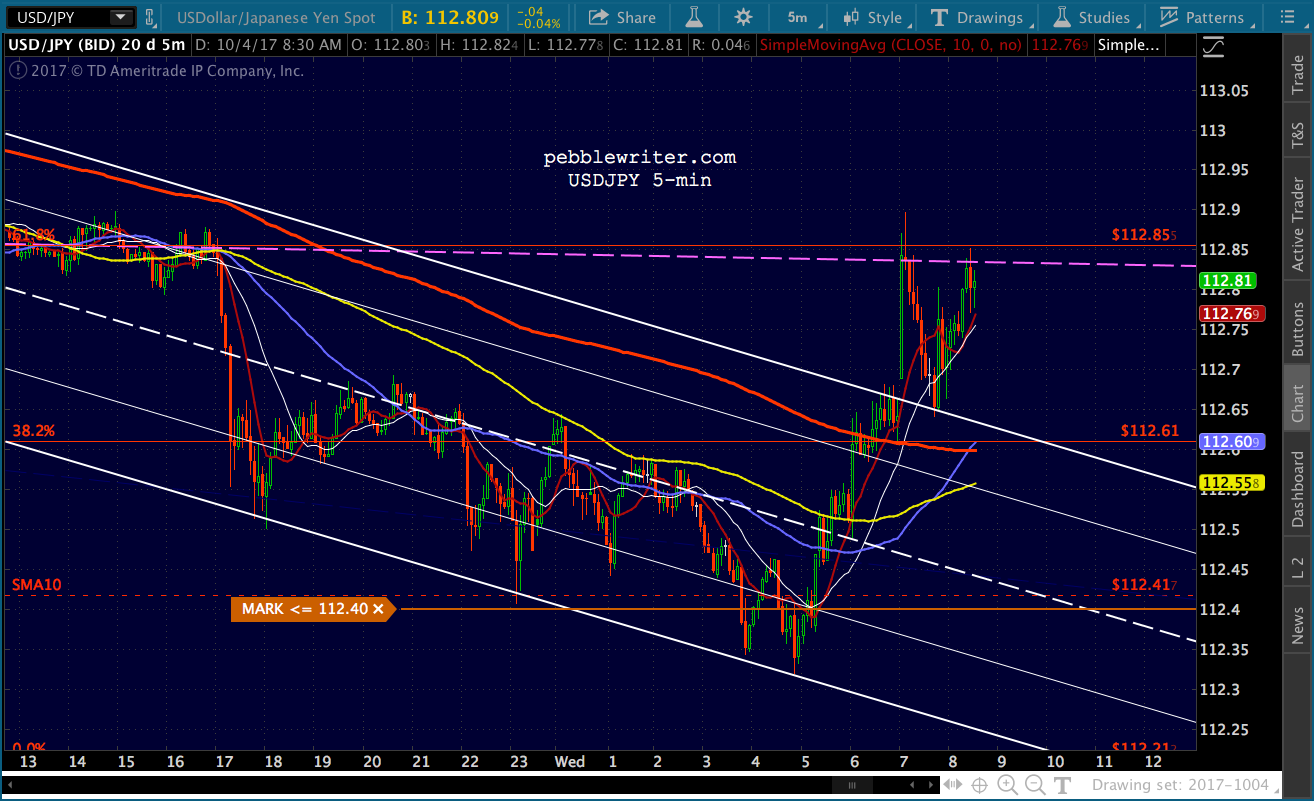
DXY is fading on speculation that Yellen’s replacement will be just as dovish as she is.
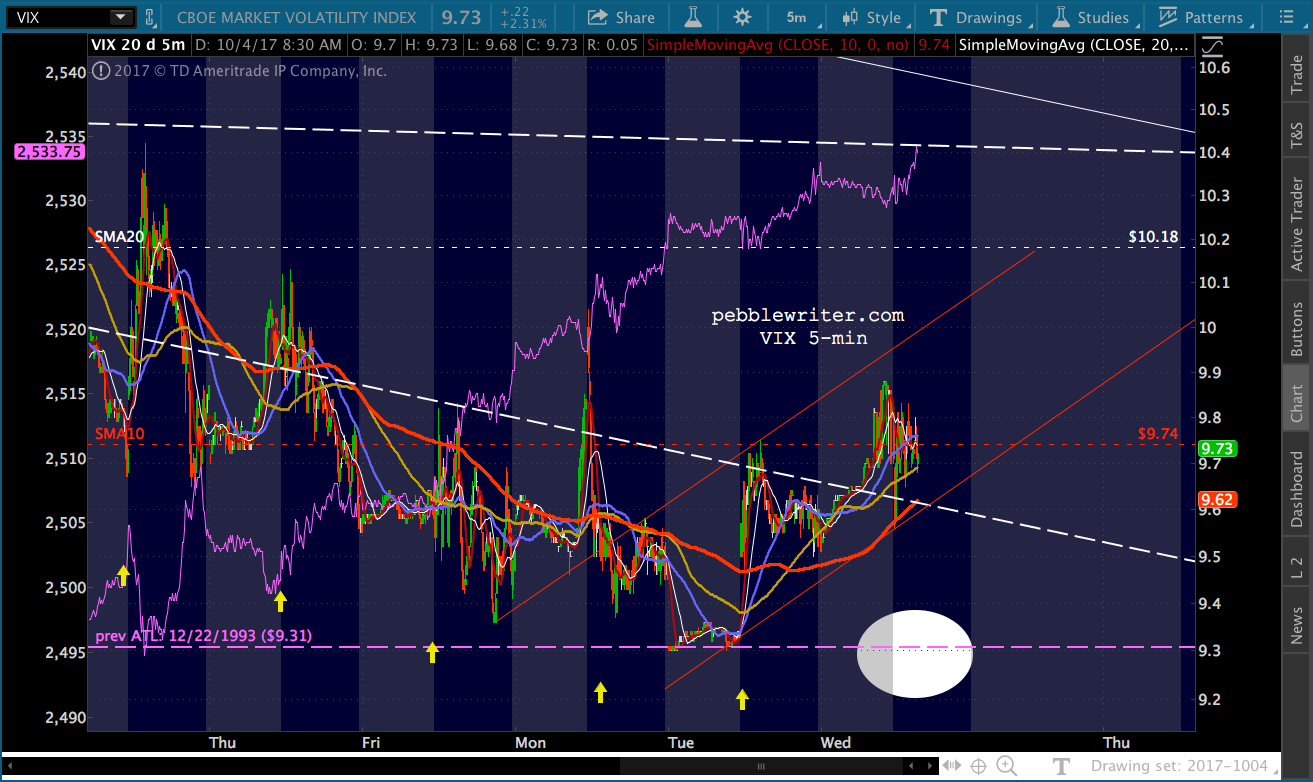
VIX still has a nice pathway to the SMA200…
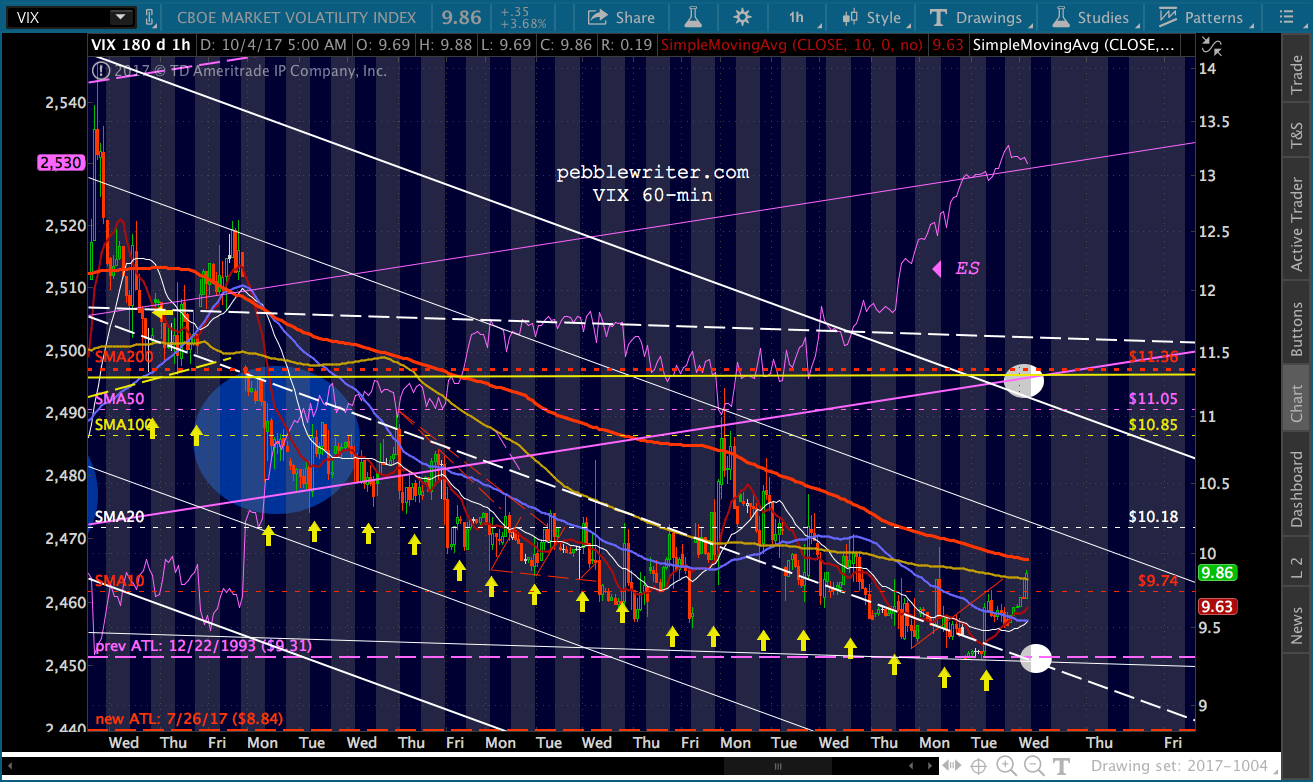 …but, as we go to press it’s behaving pretty much like it always does — a plunge off the overnight highs in order to prop up stocks.
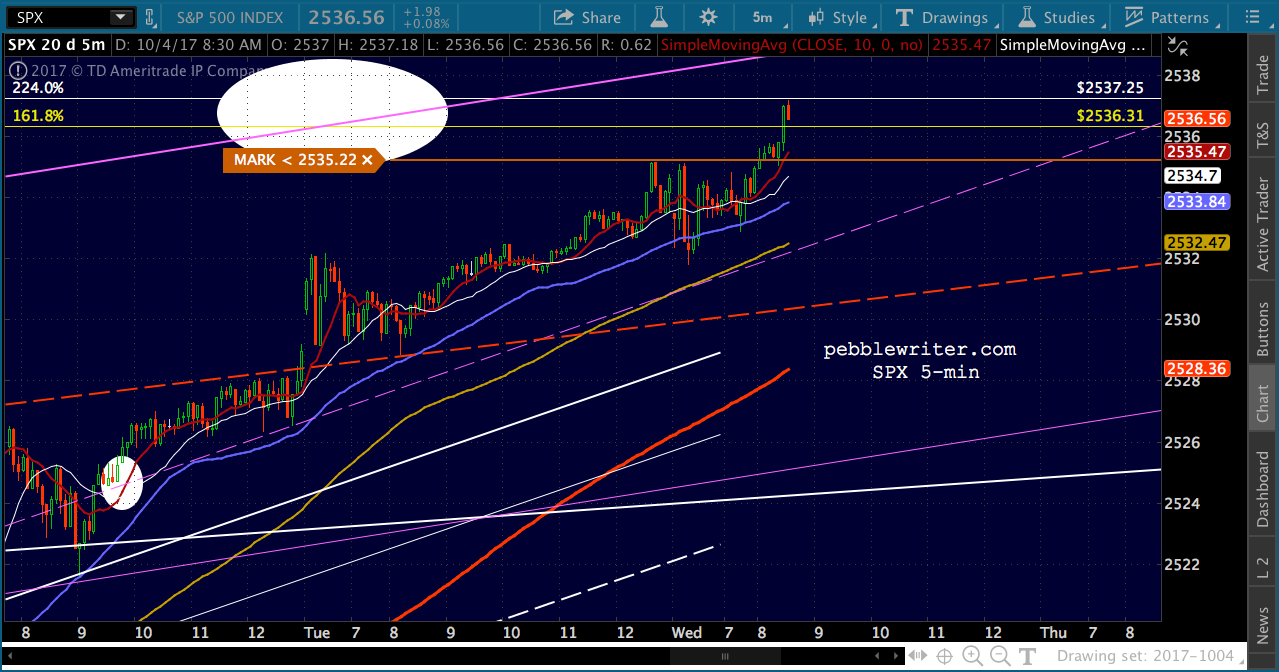
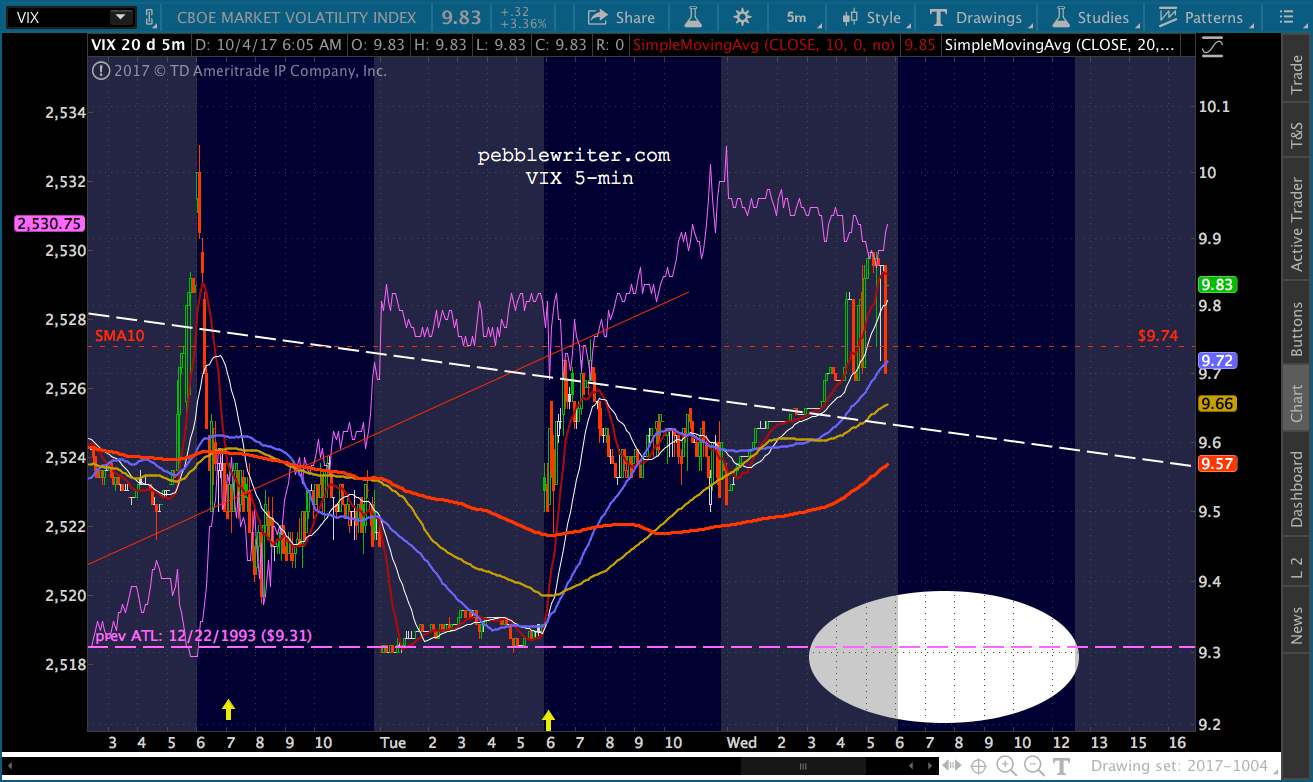 I still like the idea of a 2500 backtest.
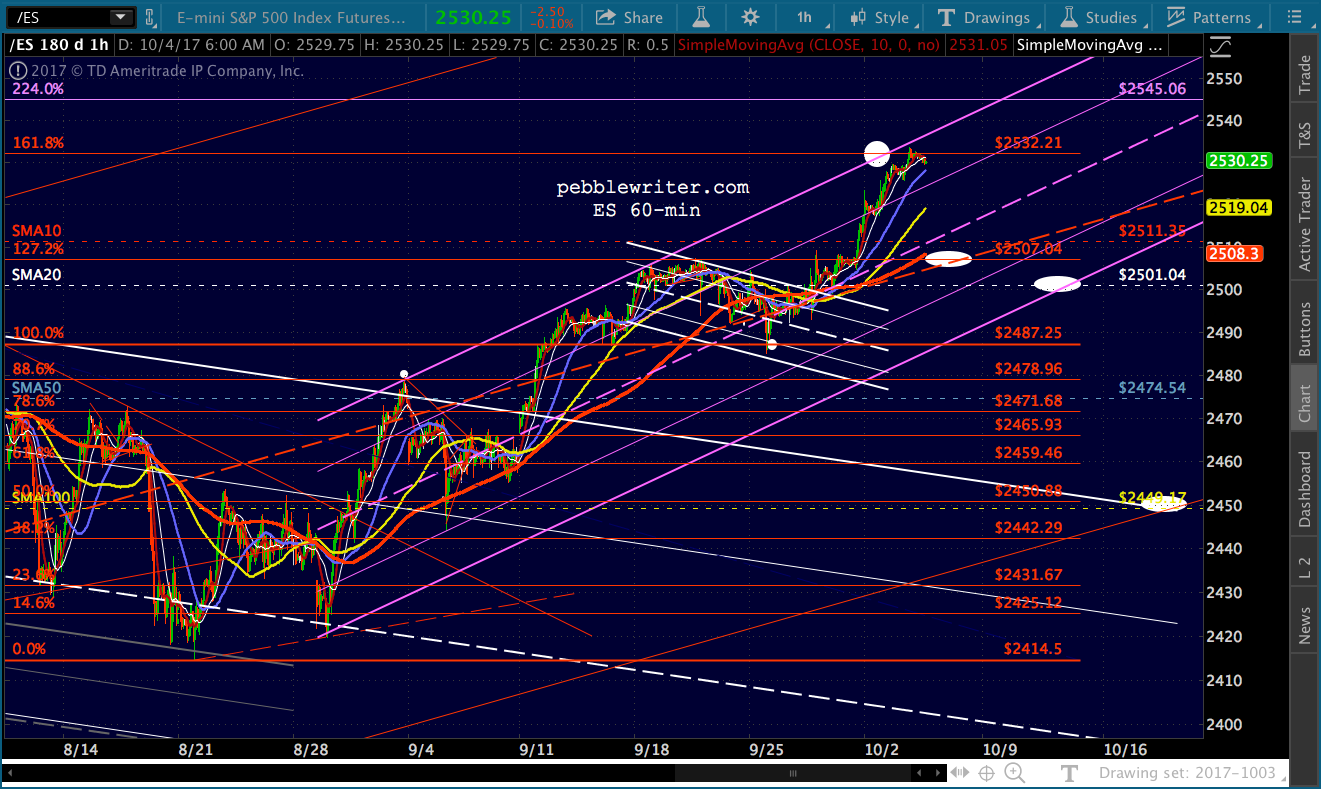 But, a reminder that SPX didn’t quite reach its 1.618. It might hold things up.
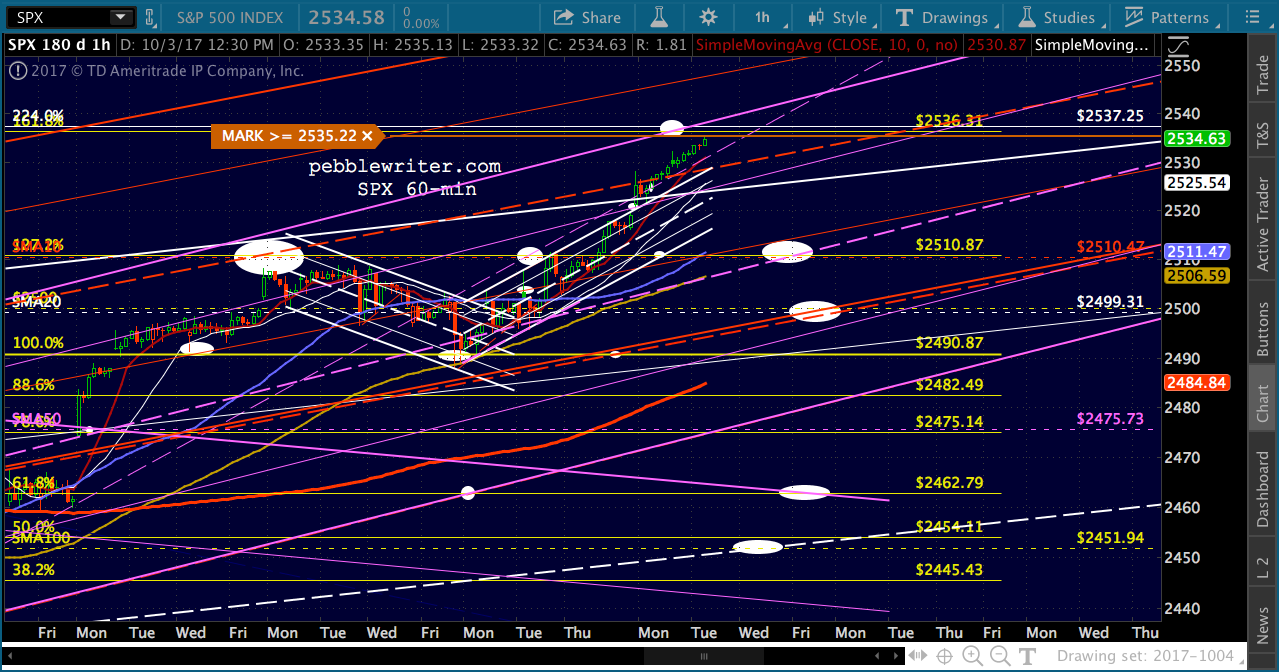 UPDATE: 11:35 AM
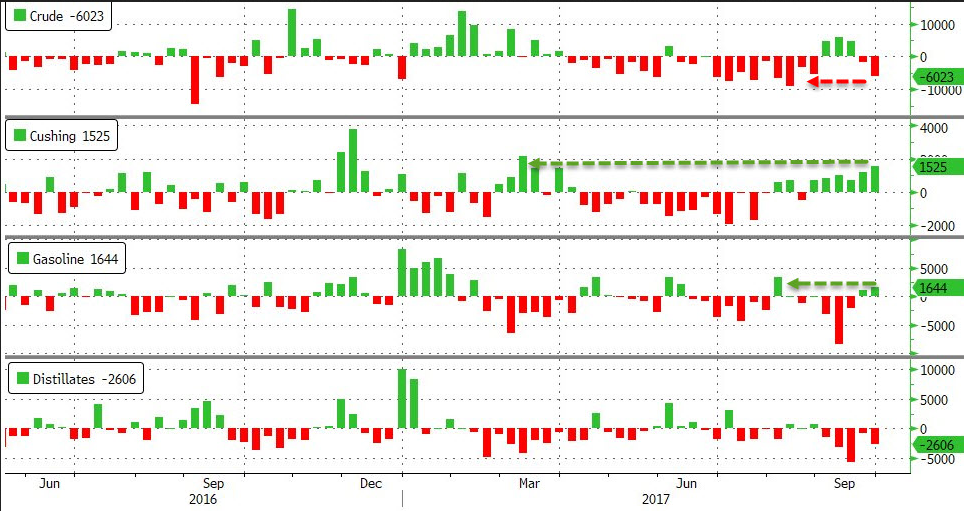
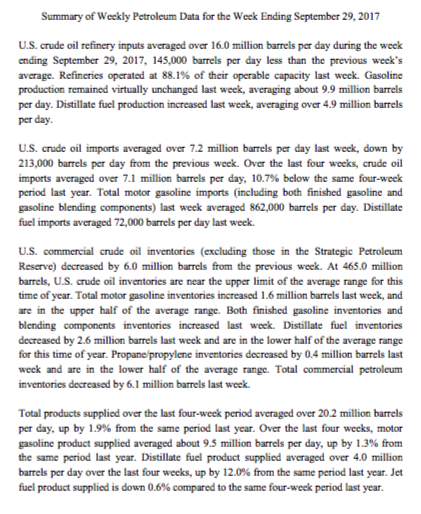
Big build in gas and Cushing, but a strong drop in crude. CL and RB’s initial reaction is a spike higher, which helped SPX get to the 2.24. Decision time…
Comments
4 responses to “Charts I’m Watching: Oct 4, 2017”
I’m going to guess we close at 22,666.66
Pretty darn close!
Dow 22666? Hmm, markets like that 666 number for a change in direction.
I sure like the idea of it. Looks like TPTB intend to push through resistance here for DJIA and SPX. Big surprise.