

It has been interesting to watch fundamental analysts try to square WTI’s price action with the data and news flow over the past couple of years. This May 5 article on CNBC.com was fairly typical of the chatter a few weeks ago.
Oil prices plunged below $44 a barrel overnight in a matter of minutes, putting the market on edge as futures tested yet another key technical level. Traders blamed forced margin calls and computer trading for the so-called flash crash but were not quite sure what caused the drop.
The May 5 mini-crash was no surprise to our readers. As I noted in our May 5 daily update, we’ve been tracking a rising channel for over a year — a channel which broke down several days earlier when oil also dropped through its SMA200. We had had a downside target of 42.84, which CL came fairly close to (43.76) just after midnight, going back to Mar 10 [see: One Way or Another.]
The following day, as the fundamental crowd was coming to grips with the lousy supply/demand picture and forecasting a crash in prices, I reminded members of what really mattered:
CL could go a little further, but will obviously wait until the new highs are secured.
As it turned out, oil was done falling (SPX reached new all-time highs the following session) and its 19% rebound over the next several weeks helped keep stocks on the rise. Its May 18 pop back above its SMA200 was instrumental in SPX rebounding after it had reached our 2354.15 downside target.
We had another mini-meltdown last week, this time with less warning — but, featuring all the same issues. Again, we had a strong signal before it happened. As we noted the morning of May 25:
CL and RB are at the top of long-term channels that could put an end to any further escapades.
A few hours later, it landed right in the middle of a smattering of downside targets ranging from 48.76 to 49.50 — a 5.05% single-day drop, its second biggest of the year. It reached our next lower downside target the following day.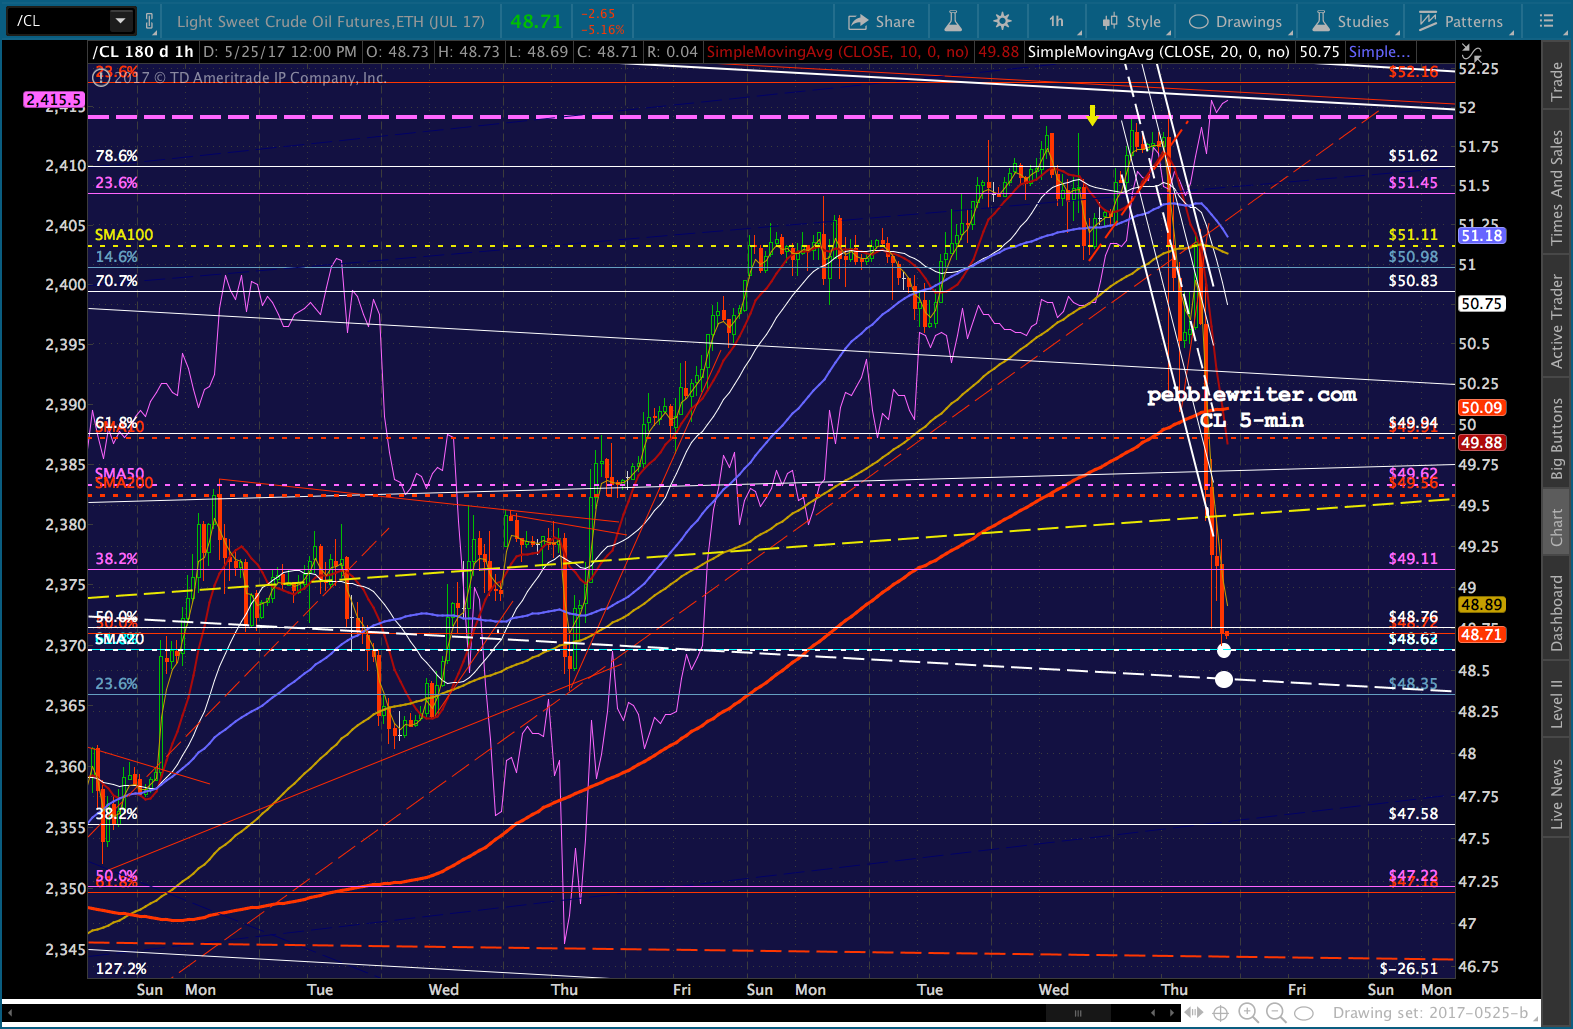 If fundamentals aren’t driving oil prices, what is? And, what does this latest plunge mean for prices going forward?
continued for members…
Remember, CL is trying to walk a fine line between supporting stock prices and keeping inflation under control. CPI is seemingly back under control.
 And, today’s PCE report indicates it’s under control, coming in at 1.5% for April.
 The EIA just released May’s average gas price: 2.303, a 1.6% decrease from April and only a 4.7% increase from May 2016. Note that this is a substantial change from last month, when an 18.4% increase in gas prices generated a 2.2% increase in CPI.
 Under the circumstances, May CPI (to be reported June 14, same day as the next FOMC decision and a press conference) seems almost certain to drop to or below 2.0%. If so, how can one argue for higher rates? Even at 2.1% and PCE at 1.7%, it seems that a rate increase is unlikely.
I think that’s exactly the “out” that the FOMC wants. And, I think investors are increasingly aware that this is a real possibility. I think this is why DXY can’t seem to get out of its own way. If they can keep the USD aloft, the Fed might have found a nice sweet spot — with inflation high enough to justify slightly higher rates if/when they think it makes sense, but low enough that it won’t necessitate a hike.
The CL charts themselves, ignoring any of the above background/theories/implications, seem to support this forecast. The highlighted monthly periods have been marching steadily lower. Note that the corresponding 2016 periods topped out with June. Unless CL breaks out of the large or small falling white channel, the YoY comparison is set to turn negative.
If it does, it seems as though 2% (or lower) CPI would be a gimme. And, if CPI dips to 2% or lower, then the FOMC will have all the headroom they need to slow, halt or even reverse any tightening.
July 2017 should offer some respite, as July 2016 encompassed the drop from 49.53 to 40.57 — almost the entire drop to the right shoulder marked with a yellow “S.” So, oil/gas fueled inflation could rebound even if CL doesn’t.
All the suggests that downside should be limited during June, but could pick up in July. An exact replica of the ranges from 2016 would look something like this. But, there’s a serious problem with the above scenario: July dips too low. Here’s why.
  Everyone knows that when oil crashed from 147.27 in July 2008 to 33.2 in Jan 2009 (a Fibonacci -78% BTW) it accompanied a crash in equities. What most people don’t know, however, is that it accompanied a crash in inflation. CPI fell from its peak of 5.6% in Jul to 0.0% in Jan.
 We get a sense of the impact of energy prices by comparing the core CPI which excludes food and energy (and, IMO, is a made-up number.) Core CPI remained comparatively flat over the same period.
 It’s safe to say that late 2008/early 2009 is when central bankers panicked. CPI turned negative, stocks were losing ground fast, and QE was instituted.
But, it’s also fair to say that stocks started rebounding soon after oil did. Oil’s subsequent rise from 33.2 in Jan 2009 to 114.18 in May 2011 (+243%!) correlated strongly with SPX’s 105% rise from 666 in Mar 2009 to 1370 in May 2011. They both topped out on the same day: May 2, 2011. Also in May, CPI reached 3.6% after registering only 1.6% in Jan. An equivalent move here in 2017 would see May CPI reported at 5.2%.
Gas prices rose from 3.058 to 3.849/gallon. It was the highest level ever reached except for — care to take a guess? — the peak reached in July 2008. That summer, SPX plunged 22% while CL plunged 38%. They both bottomed on the same day: Oct 4, 2011.
 To summarize: 5.6% CPI was a problem in Jul 2008, and oil crashed. 3.6% CPI was a (slightly lesser) problem in May 2011, and oil crash (slightly less.) 2.7% CPI was becoming a problem in Feb 2017, and oil…has corrected mildly.
There’s not only a correlation, but there’s a pattern that makes sense. Higher oil prices leads to higher gas prices which lead to higher inflation which leads to higher interest rates. The US can ill afford higher interest rates, especially with $20 trillion of debt — twice what it was in 2008 — on the books.
Interest rates spiked higher after the US election — the so-called reflation trade. Note the leap in 10-yr rates above the red TL that halted every previous peak in rates since 2007.
 We suspected then, and we know now, that oil prices were increased in order to keep stocks on the rise through the end of the year. CL peaked on Jan 3, the first session of 2017 and have only declined since.
You might argue that, at 2.21%, 10-yr rates aren’t as big a problem as they were at 5.32% in 2008. But, that increase in debt makes a yuuuge difference. Treasury Direct shows that 2016’s interest expense was nearly as big as 2008’s and 2011’s.  2017 is on track to beat 2016’s total by a large margin. If the YTD rate of increase (+19%) holds, 2017 interest expense will be around $500-515 billion. Suddenly, higher oil prices, higher inflation and higher interest rates seem like a very, very bad idea.
As we discussed about 1000 words and many hours ago, it’s important to acknowledge how important oil prices are to stocks. A few observations:
- the Feb 11, 2016 bottom in oil (26.05) reached the white .886 retracement and permitted SPX to backtest the critical1823 level.
- the subsequent rally was greatly responsible for SPX’s rise to 2270 in mid-December
- the decline since then has been largely offset by a collapse in VIX to historical lows.
Bottom line, the correlation is a little sketchy — at least, for now. If oil breaks out of the falling white channel, however, it will almost certainly drive interest rates higher and require the FOMC to hike rates. This would presumably strengthen the USD and the USDJPY, thus supporting stocks.
If oil breaks down below the purple channel bottom, then it will almost certainly ding inflation, interest rates, the USD and stock prices — as occurred in early 2016. Lower interest rates are a necessity; so, it stands to reason that lower inflation and, thus, lower oil prices are as well. Given the price levels seen in Jun 2016, it wouldn’t be hard to generate low YoY comparisons. It will give the FOMC an out in terms of raising rates. This should put pressure on USD and USDJPY, but that’s better than an ill-advised rate hike.
 Note that CL recently dropped through its SMA200 and tested the falling white midline. But, it bounced right back above the purple channel bottom and the yellow TL. Given the issues with either course of action, I expect it to trace out a triangle until, at least, the FOMC can offer some direction in two weeks’ time.
 Unless it breaks out before then, I’d avoid any large, directional bets.
I recognize that I’ve wandered very far afield in this “update on oil.” Maybe I’ll take tomorrow and do some much-needed editing. But, I think it’s critical to understand how all these puzzle pieces fit together.
I plan on taking the day off tomorrow to focus more on the big picture. I feel like I made some important progress today, and would like the opportunity to go back over it with fresh eyes.
GLTA.