The 46-pt rally off our downside target on the 18th (2352.72 vs 2354.15) has left SPX with some interesting options. More importantly, it makes an important statement about shifting algo influences — leading to some (IMO) mistaken notions regarding the FOMC’s next steps. While the USD bounced nicely where expected, the fireworks are far from over — which says a lot about the odds of a rate hike.
continued for members…Note that EURUSD is still very much up in the air regarding a breakout or breakdown from the purple channel top. And, USDJPY is still trending sideways, despite ample opportunities to strengthen its base with a bounce off support.
 It’s very evocative of CL, which is straddling the fence between a meltdown and a rebound.
 As for SPX and ES, their charts are a mess.
 The machinations they went through to avoid a simple backtest last week were rather stunning. Assuming SPX finally tags its SMA5 200 (2411.89) today — now that it’s above the May 16 highs — it will have been seven sessions since the last tag.
ES has potential to backtest the SMA10/20 at 2392-2393 — so, we’ll look for the 4 point deficit to expand in the first 30 minutes. But, that would require some pretty impressive moves by USDJPY and VIX.
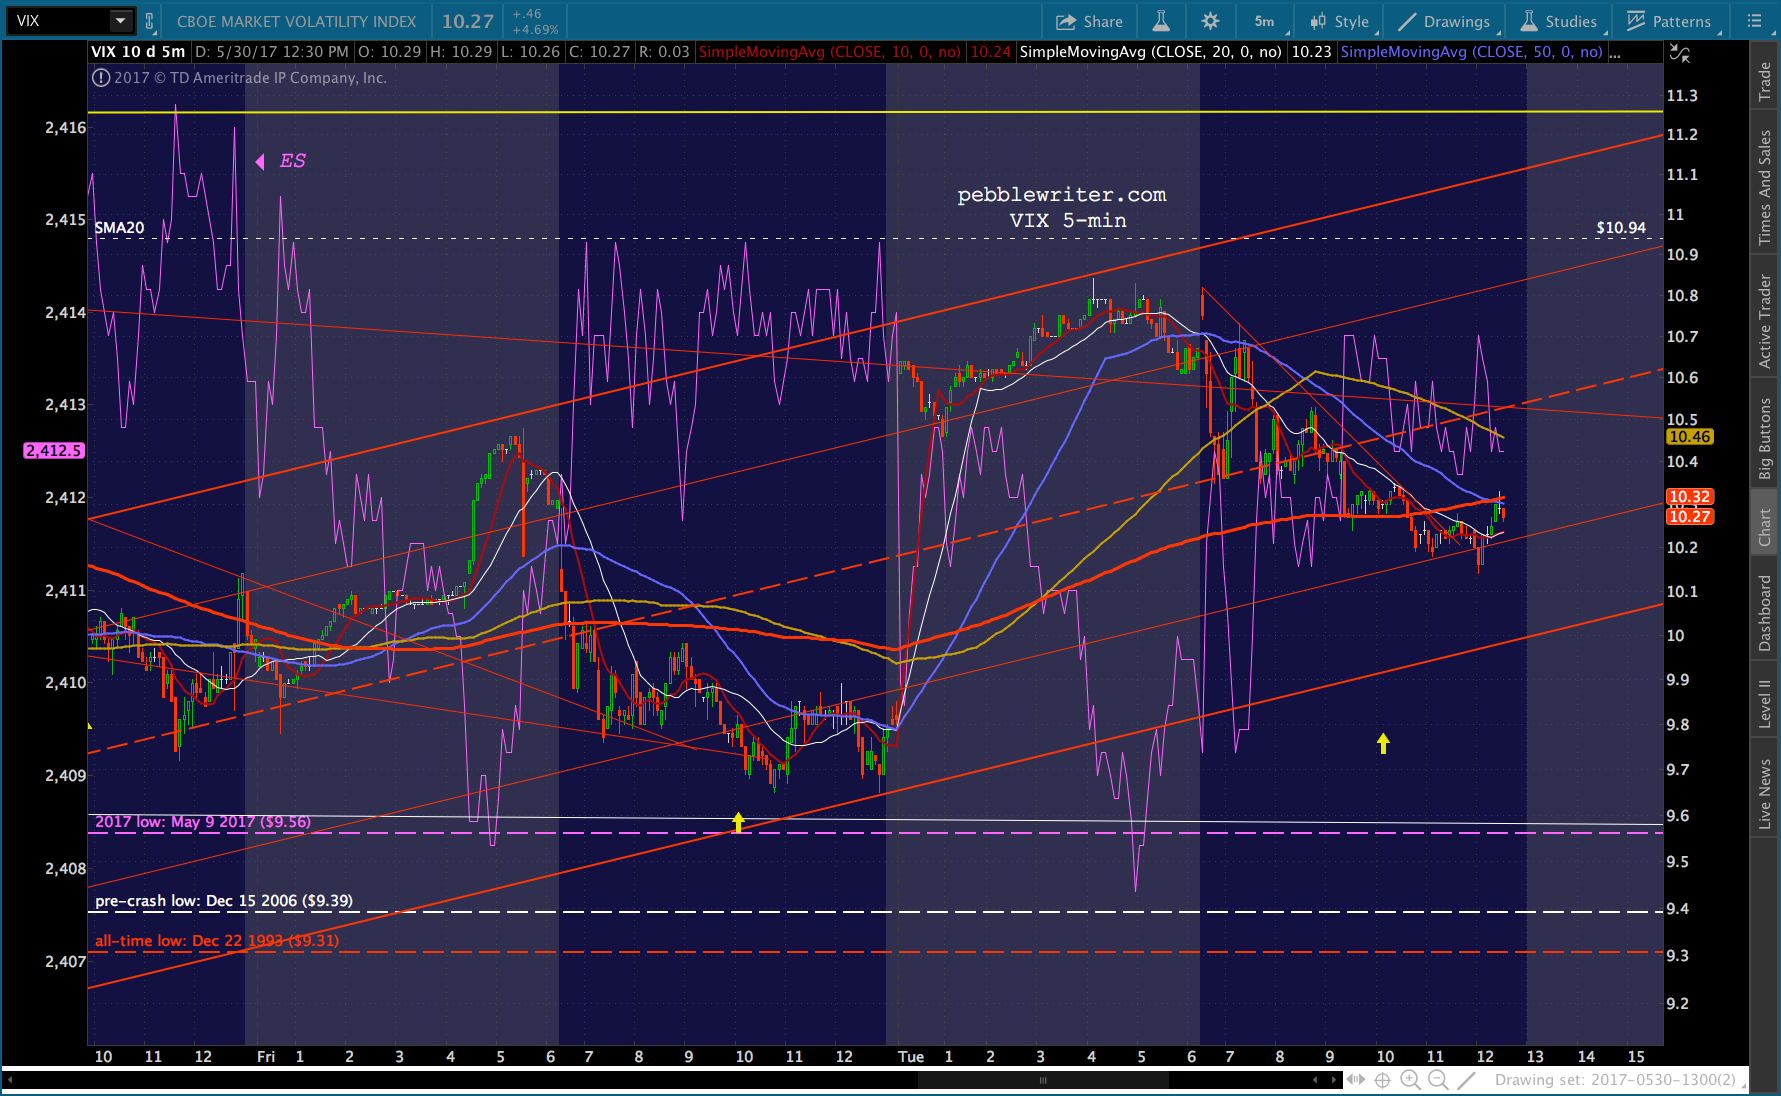
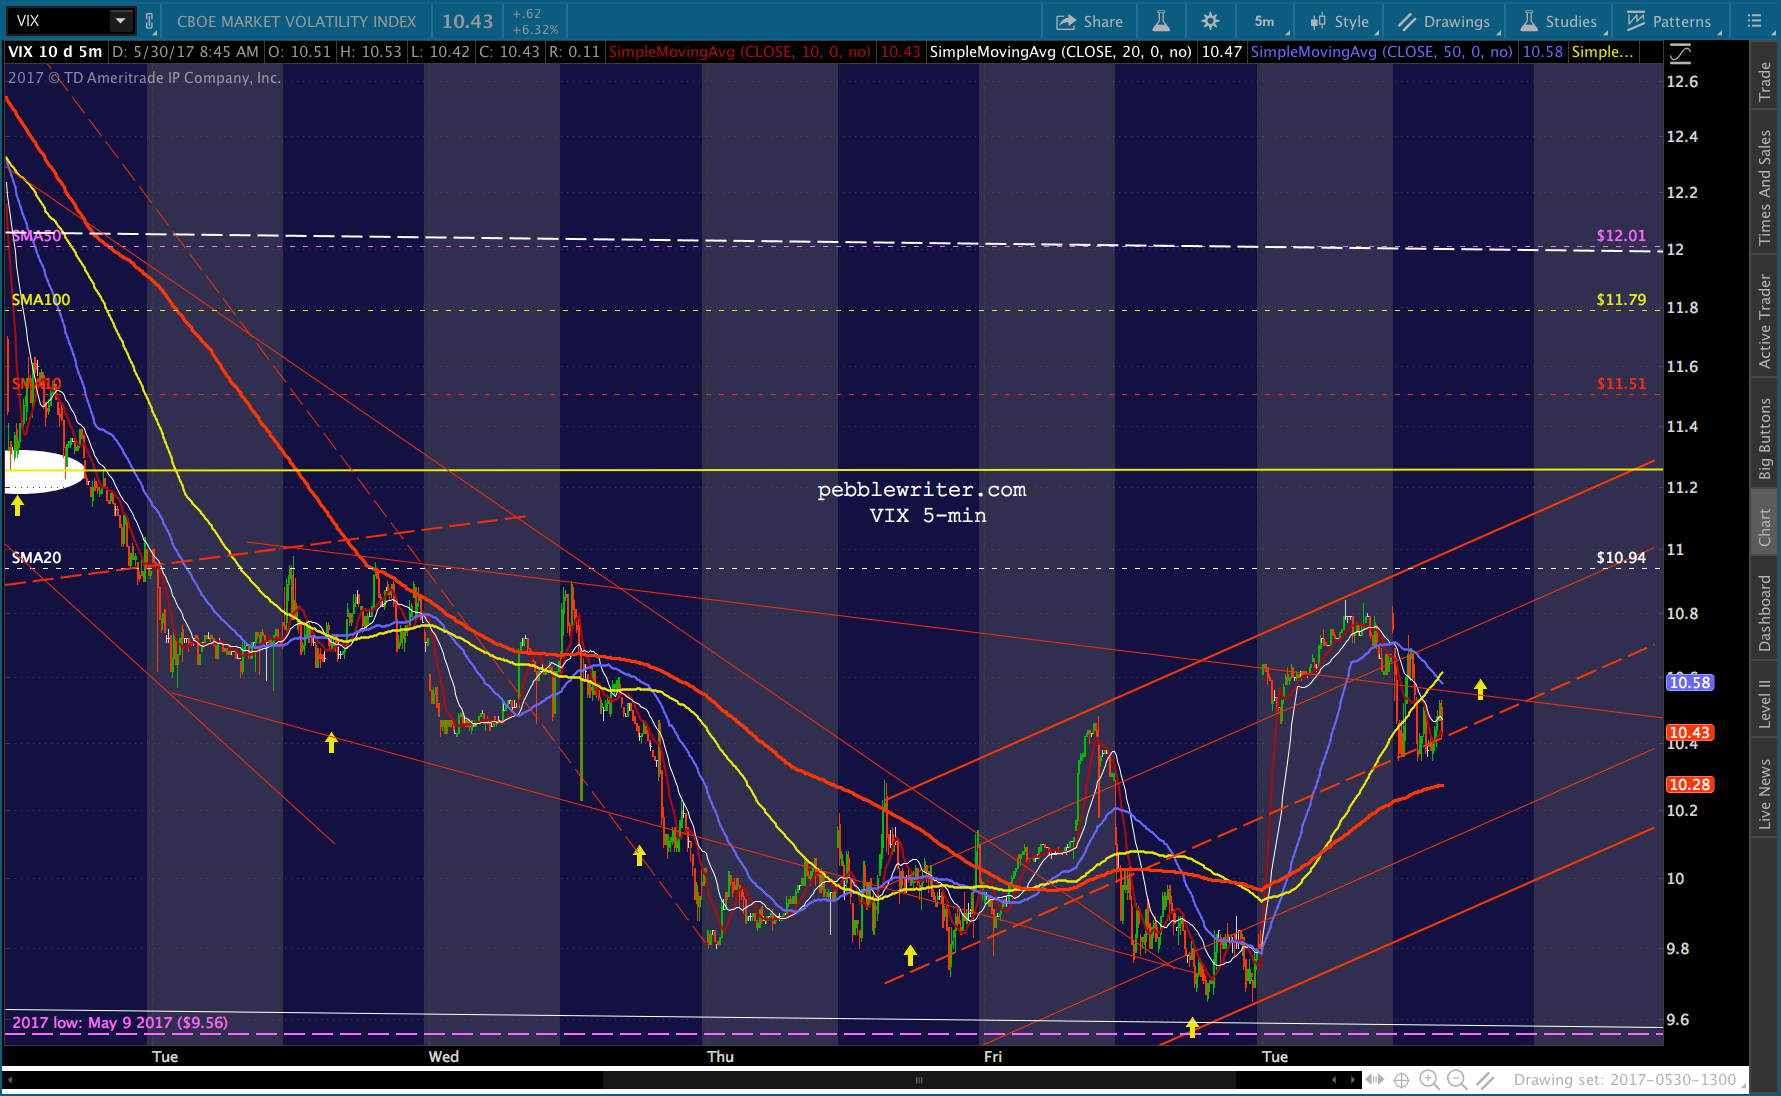
 VIX made the rally possible — spending 24 of the last 27 sessions below the yellow channel bottom. But, it has rallied overnight and is in position to play the spoiler again.
 Although it has been effective in keeping SPX aloft, I think the algo action has managed to back the FOMC into a corner of sorts. CL at 50+ is problematic from an inflation standpoint. That leaves USDJPY and VIX to levitate stocks.
The recent weak economic data has hardly inspired confidence in a rate hike, meaning the dollar should continue to have a hard time rallying. This leaves VIX, alone, as the major supporter of stock prices. How long before traders start calling bullshit on this mechanism?
The post-election rally that enabled stocks to break out was driven by a collapse in VIX and rebounds in USDJPY and, intermittently, CL. The data simply never supported it — nor the idea of a rate hike other than when CPI popped earlier this year.
I’ve always felt the Fed wants the inflation benefits of a strong dollar without actually having to raise interest rates — which could wipe out stock gains and decimate the already unbalanced budget.
So, they play with rates (and, especially, expectations of same) and oil prices in an effort to balance things out.
UPDATE: 9:35 AM
Our downside target and the yellow channel line. SPX should bounce here, though the channel bottom could still attract interest down around 2408.70.
 UPDATE: 9:40 AM
If the bounce is going to fail, this is the place. ES just tagged its SMA5 200. If it can climb back on top, SPX should be safe at least to 2414.50 where it can close this morning’s gap. 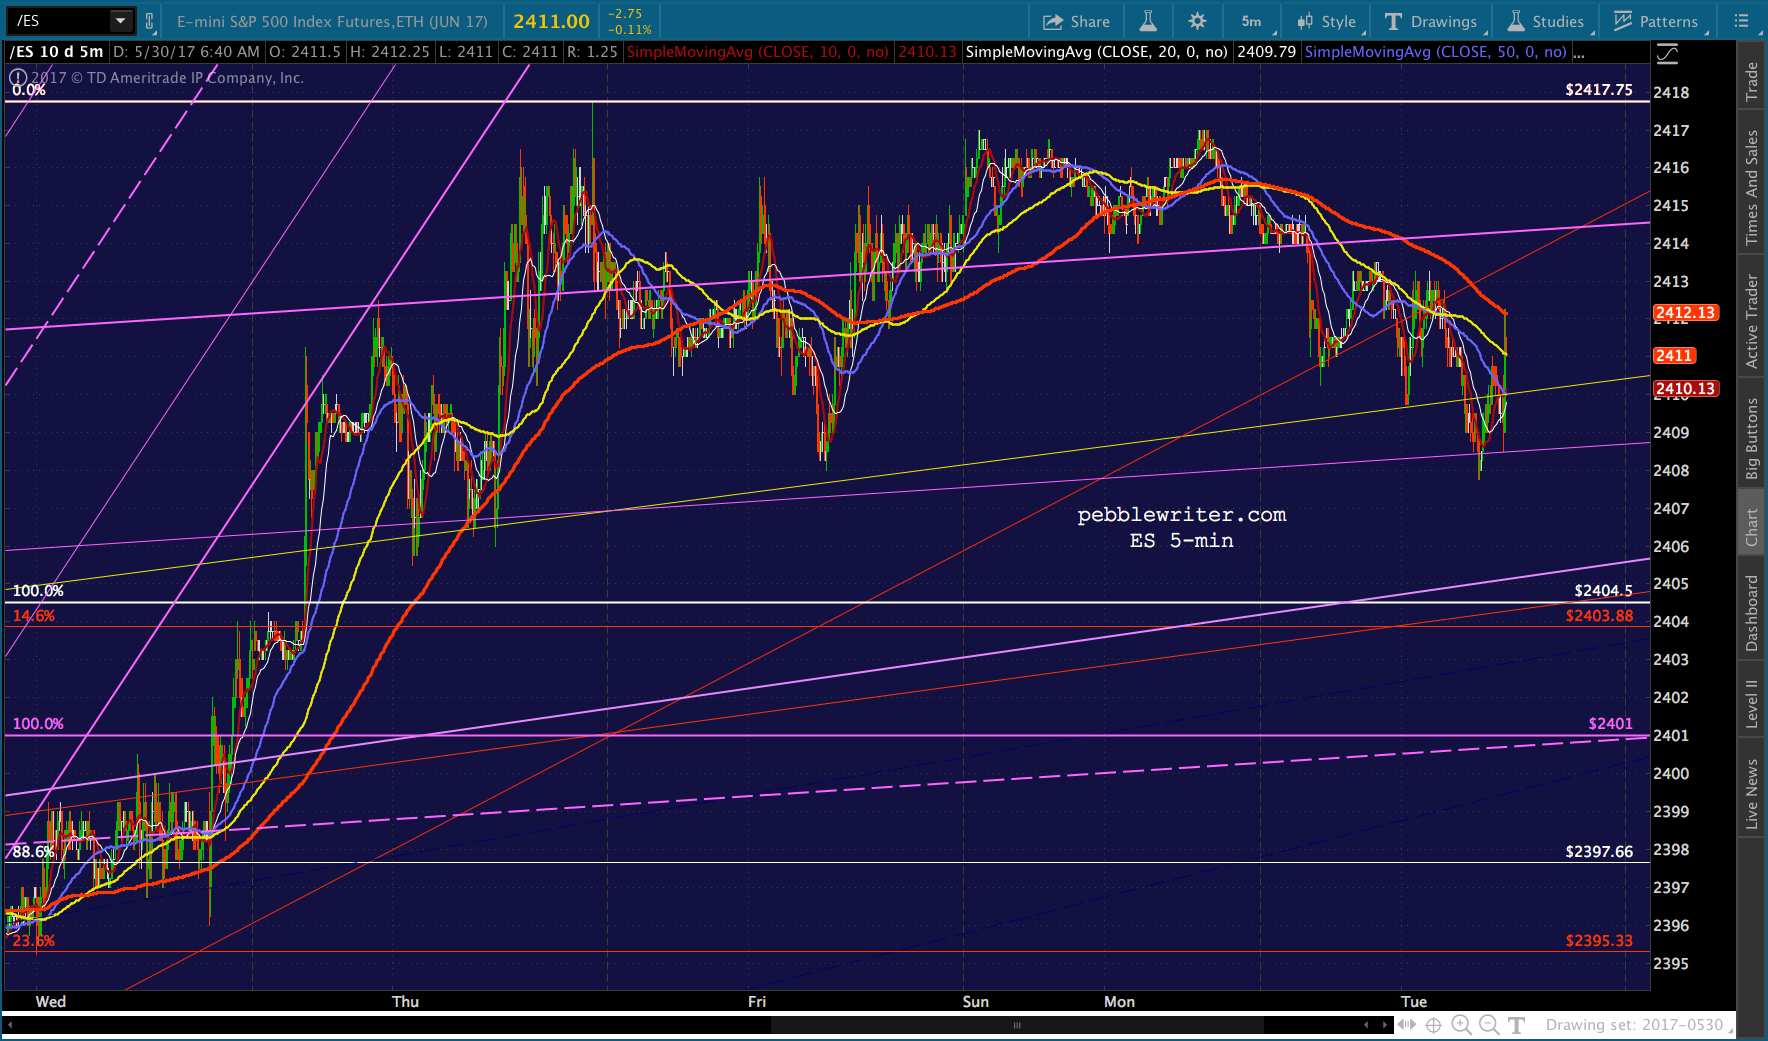
 UPDATE: 9:47 AM
For nimble traders, ES just backtested its red channel line. If it can’t hold the SMA5 200 on a reversal, SPX should play along nicely with a dip to 2408.70. I’d try shorting here, but with tight stops in case ES is just backtesting. Note that just below 2408.70 we have the former high and gap close at 2405.58. UPDATE: 10:18 AM
This qualifies as flushing out the rising purple channel. Sure, it could go further. But, a snapback rally, if we get one, would start here.
 Keep a close eye on VIX, which could break either way, and USDJPY, which is at TL support.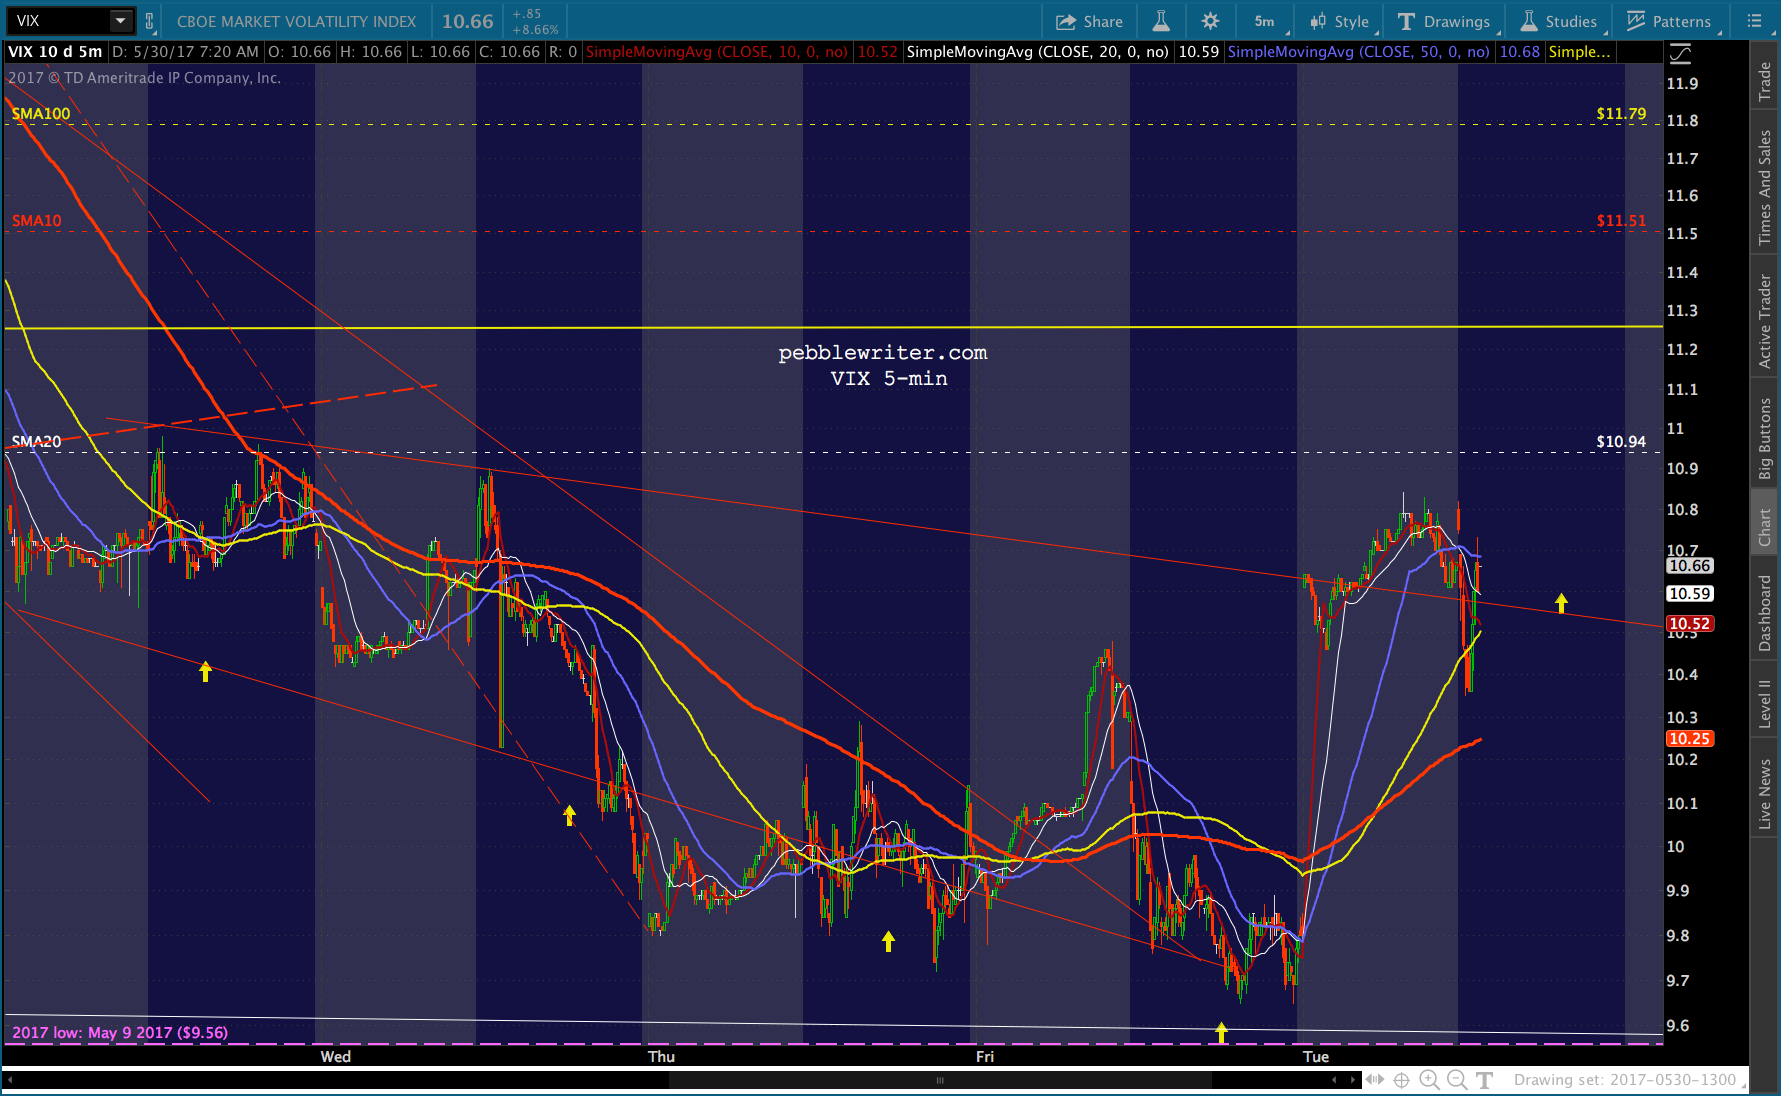
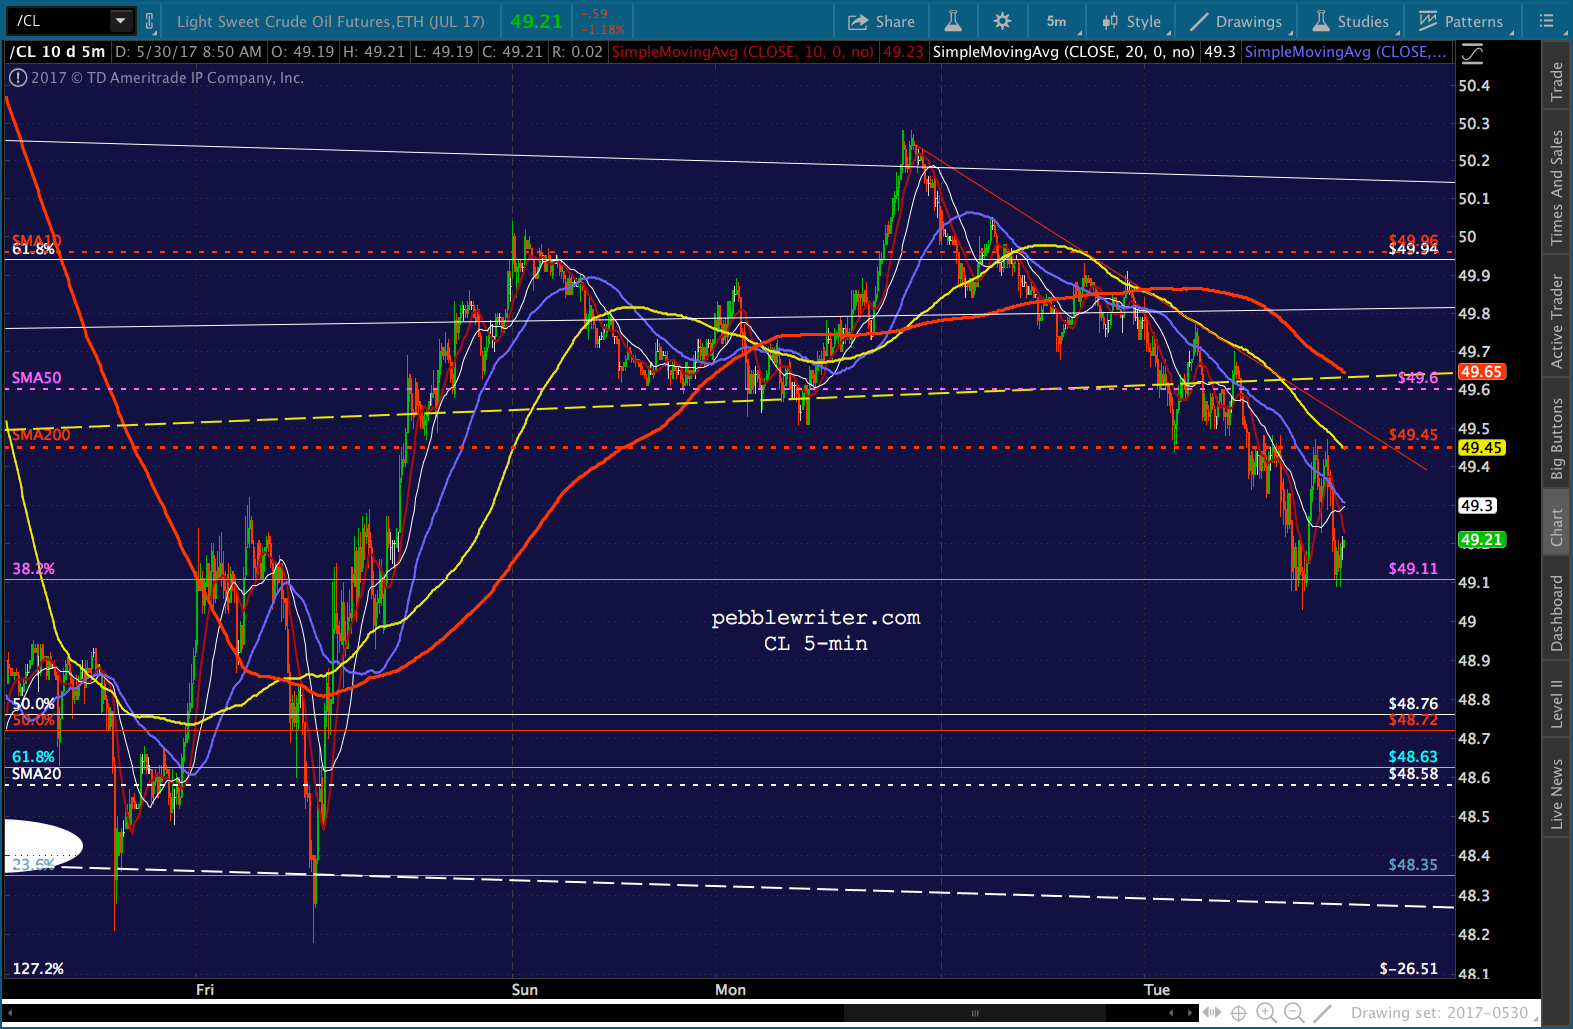
 CL is making a bid for a nice rebound — but, is about to run into the SMA200 at 49.45.
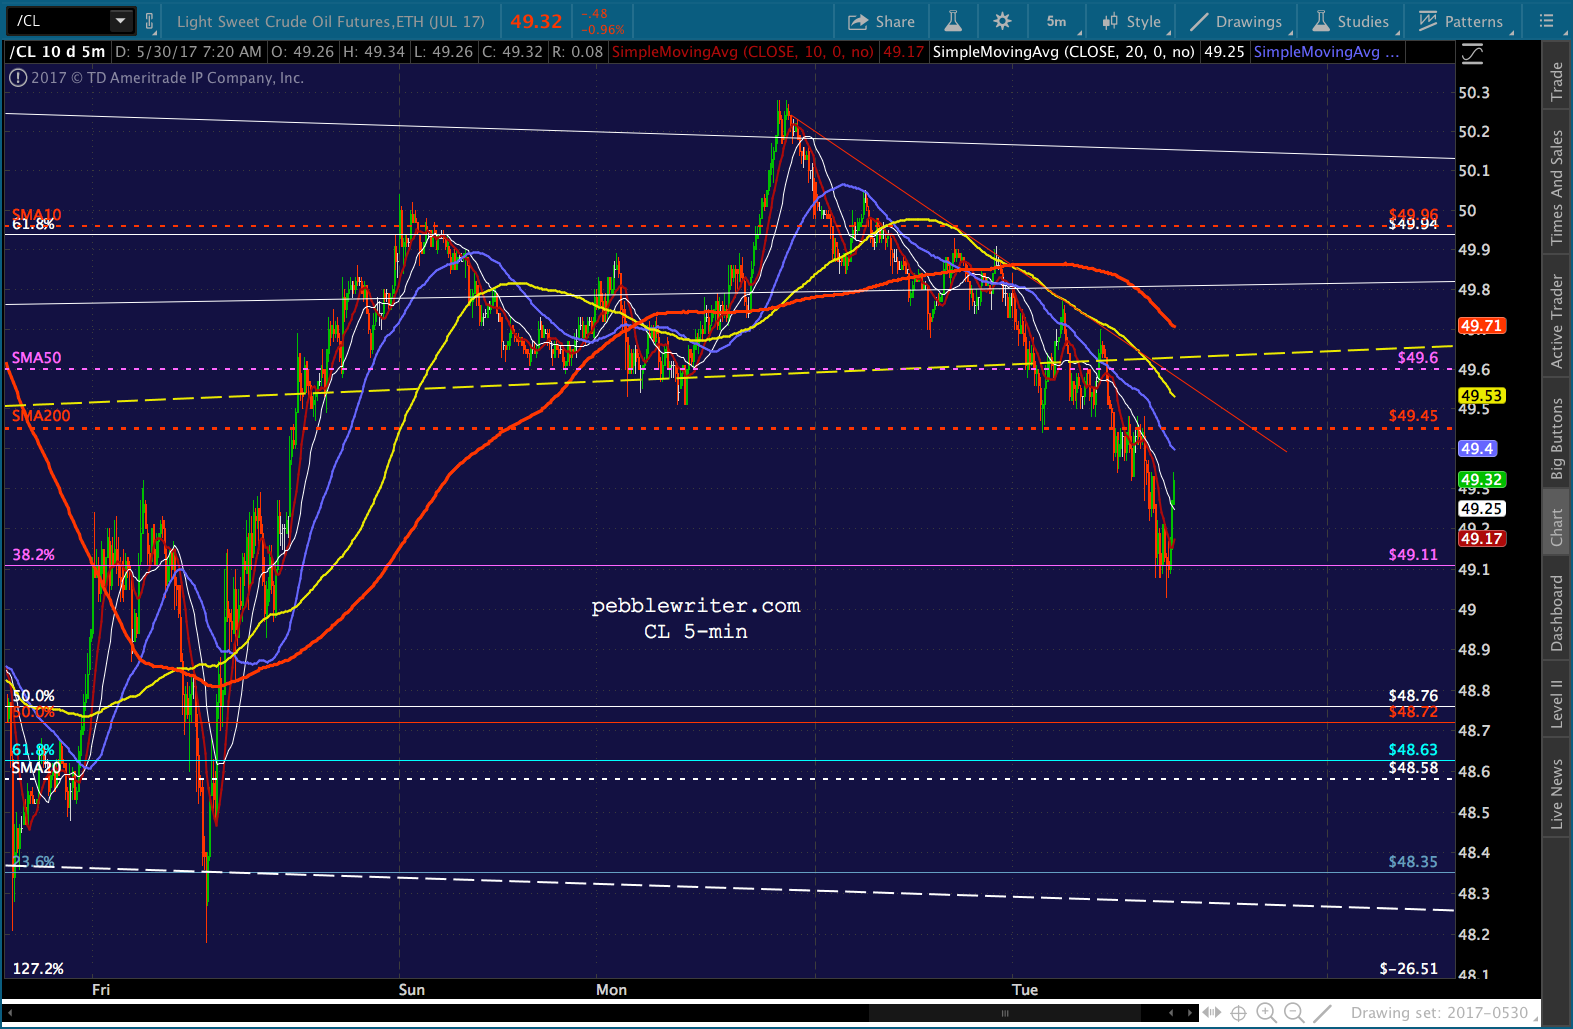 This is probably a good time to duck out and post the updated CL charts I worked on this weekend. Watch out for the descending SMA5 10, which could put a damper on SPX’s rebound at around 2411.70. A reversal there strongly suggests 2408.70 or 2405.58.
UPDATE: 9:52 AM
Putting the finishing touches on the oil post, but noticed that USDJPY has broken down and CL has reversed off its SMA200 — both good arguments for 2405.58. I’d revert to short here with relatively tight stops at the SMA5 200. Note that USDJPY is closing in on our SMA200 target at 110.15. The white channel midline, which was originally part of a nice intersection target for the pair, is just below at 109.95ish.
 UPDATE: 12:25 PM
VIX just reminded everybody that it’s still in charge of when and where equity prices go. Back to cash should it break down below its SMA5 200 and SPX out of the white channel at 2414.80ish.
 UPDATE: 1:45 PM
SPX needs a boost to break out — or, at least avoid breaking down — and VIX suddenly decides to drop through its SMA5 200. When have we seen that trick before? Oh yeah, a little over an hour ago. Back to cash on any break above the white channel top.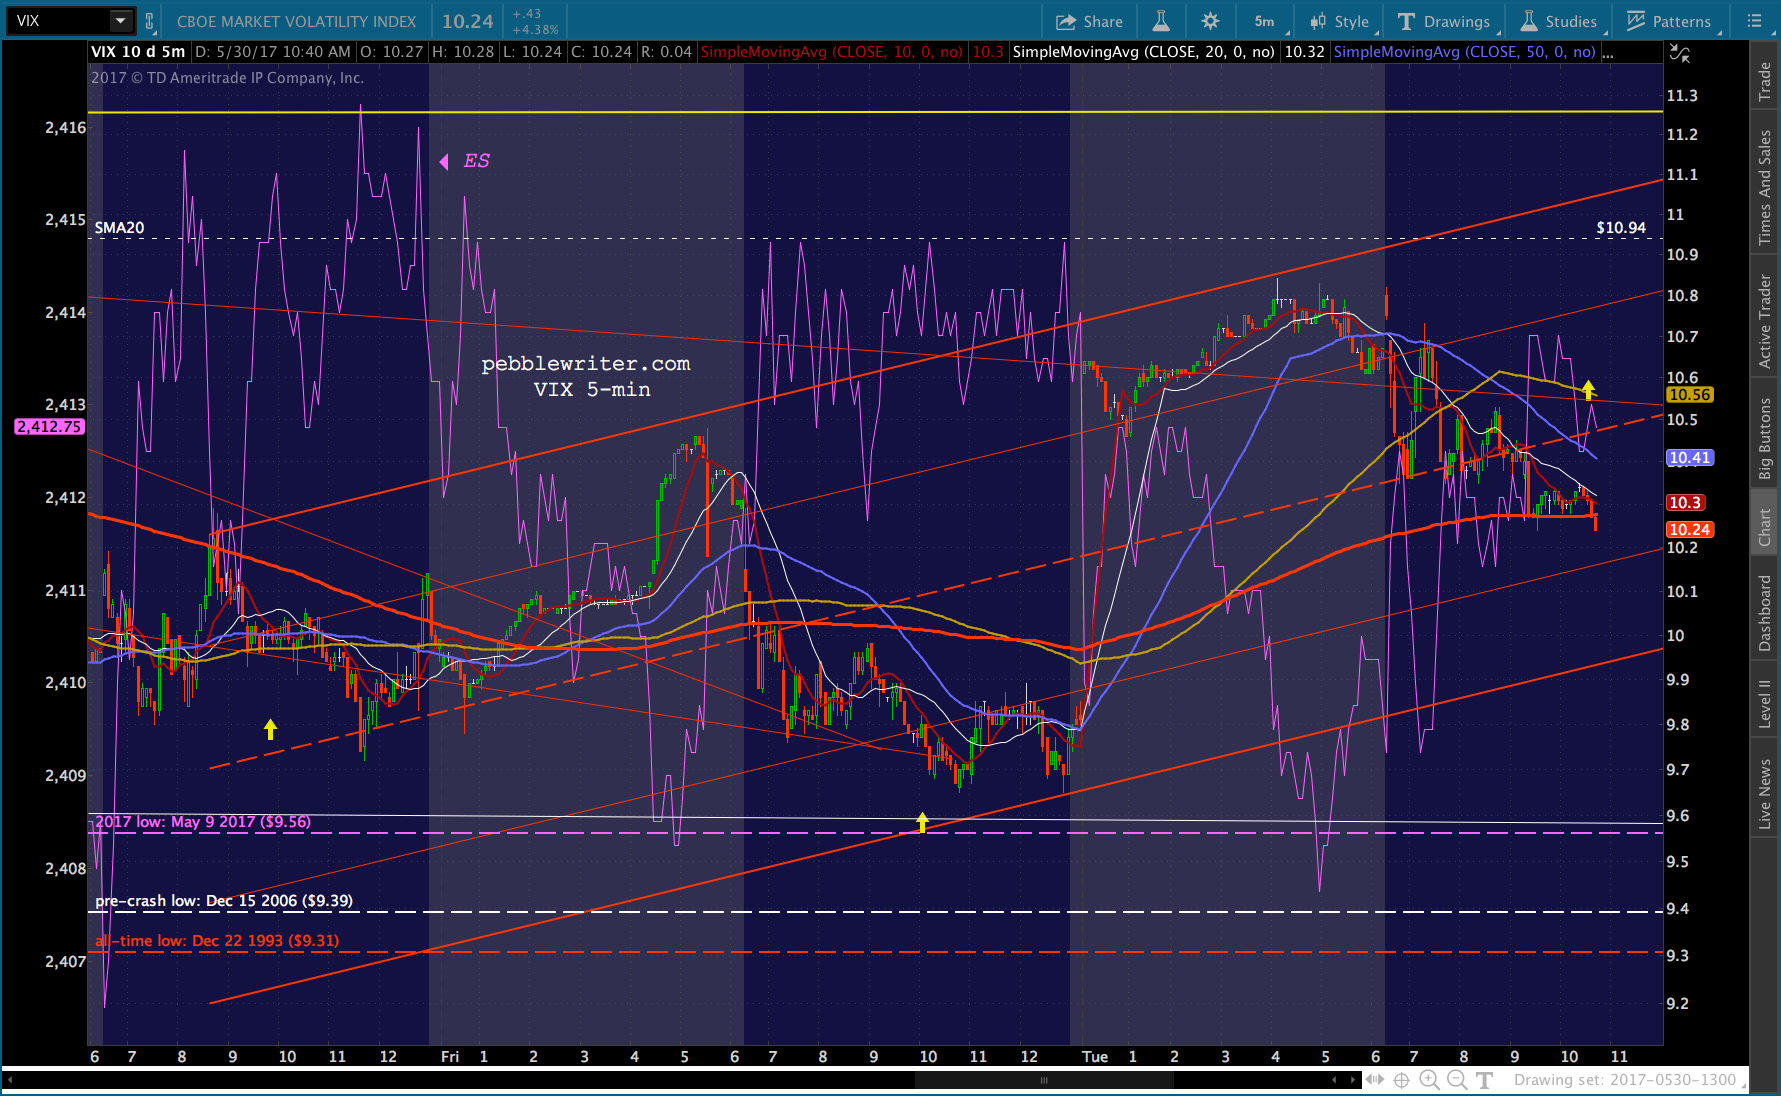
 UPDATE: 3:00 PM
VIX is breaking down further, meaning SPX will probably attempt a breakout here. UPDATE: 3:03 PM
VIX dumping, SPX pumping. I’d revert to cash if it does more than backtest the broken red channel.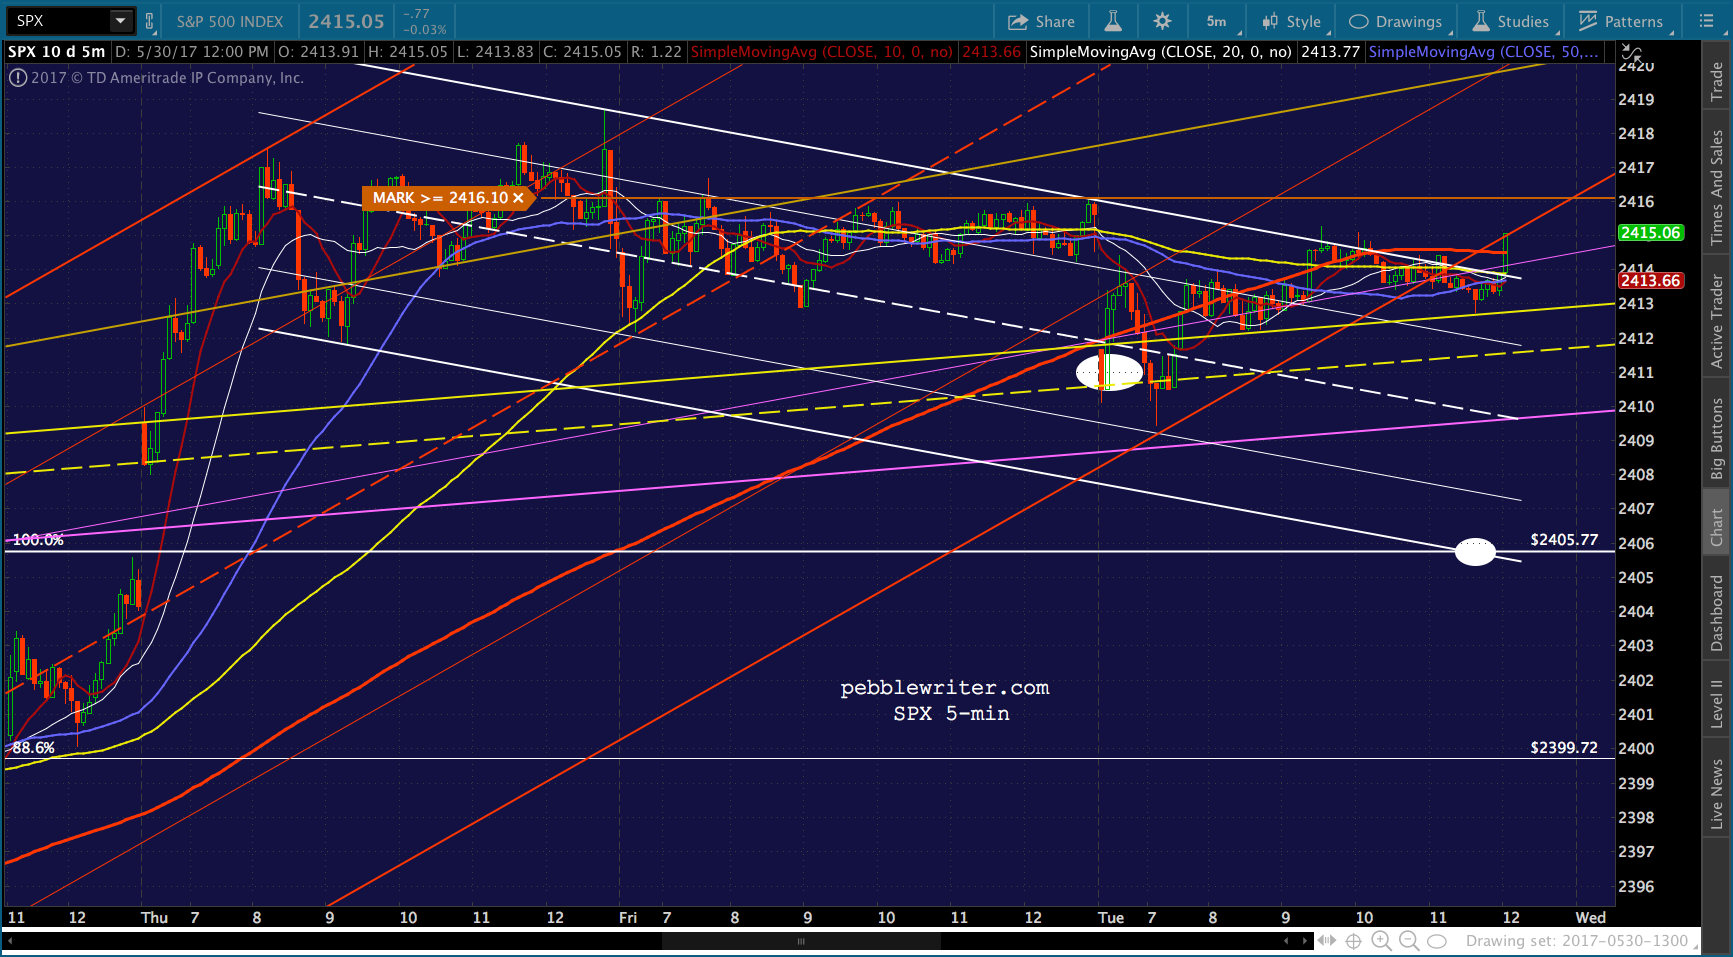
 UPDATE: 3:33 PM
It appears as though there won’t be any downdraft today, at least. Chalk up another victory to VIX, which always managed to dip just enough to keep SPX from dipping much at all. This is the logical exit point for anyone not intending to hold short overnight.
We’ve seen plenty of last minute levitations turn into gaps lower the following morning. That’s my base case, here. But, we’re also seen break outs on a gap higher. As always, only short overnight if you can hedge or handle the risk of a gap higher.