

Two weeks ago, it appeared that oil and gas had finally topped out and were ready to do some backtesting. From Once More With Feeling:
And, with a little over a week left before May’s CPI is written in stone, it’s time for CL and RB to implode — at least to their initial backtest targets. Even lower targets would put CPI back at 2%, but could be a drag on stocks.


It’s now too late for May’s CPI to revert to anything close to 2%. The EIA reported May 2018 average gas prices at 2.81, a 21.9% YoY increase — which should put May 2018 CPI at 2.6-2.8% (up from 2.5% in April), depending on how creative the BLS gets.
However, June 2017’s range was even lower than in May 2017. Current prices would yield a 27.5% YoY increase. The last time gas prices increased that much was in February 2017, when CPI came in at 2.74% — the highest it had been since Feb 2012.
Several interesting things happened on Mar 15, the day Feb 2017 CPI was reported.
First, SPX rallied 25 points off the previous day’s close and 42 points off the previous day’s low – not a bad day for stocks. It touched off a 68-pt slump, however. Stocks wouldn’t top the Mar 15 highs again until April 25.
Oil (WTI) prices fell 14.5% from Feb’s highs to Mar’s lows. Gas (RBOB) prices had fallen 11.3%. So, the seeds were already sown for a drop in CPI — which came in at 2.4%, 2.2%, 1.9% and 1.6% over the subsequent four months.
About the only bullish development was VIX, which plunged 15.5% from the previous day’s highs to 10.6, among the lowest levels it had reached in the past 10 years.
In other words, in the face of a mini-meltdown in oil and gas the algos were happy to take their cues from VIX. Is it any surprise that VIX is dipping below its 200 DMA as the market is about to open this morning?
As to CL and RB?

 Now that they have both tagged our initial downside targets, we’ll take a look at next steps, and what it might mean for stocks, bonds and interest rates. For a refresher on the relationship, see: Oil & Gas, Inflation and Interest Rates: A Delicate Balance or Goal Seeking?
continued for members…
First, it appears VIX will be used to limit the fallout from the drop if/when it occurs. By sitting on top of the SMA200, it should be quite easy to keep the algos happy: a little dip is all it would take (a bigger dip if necessary.)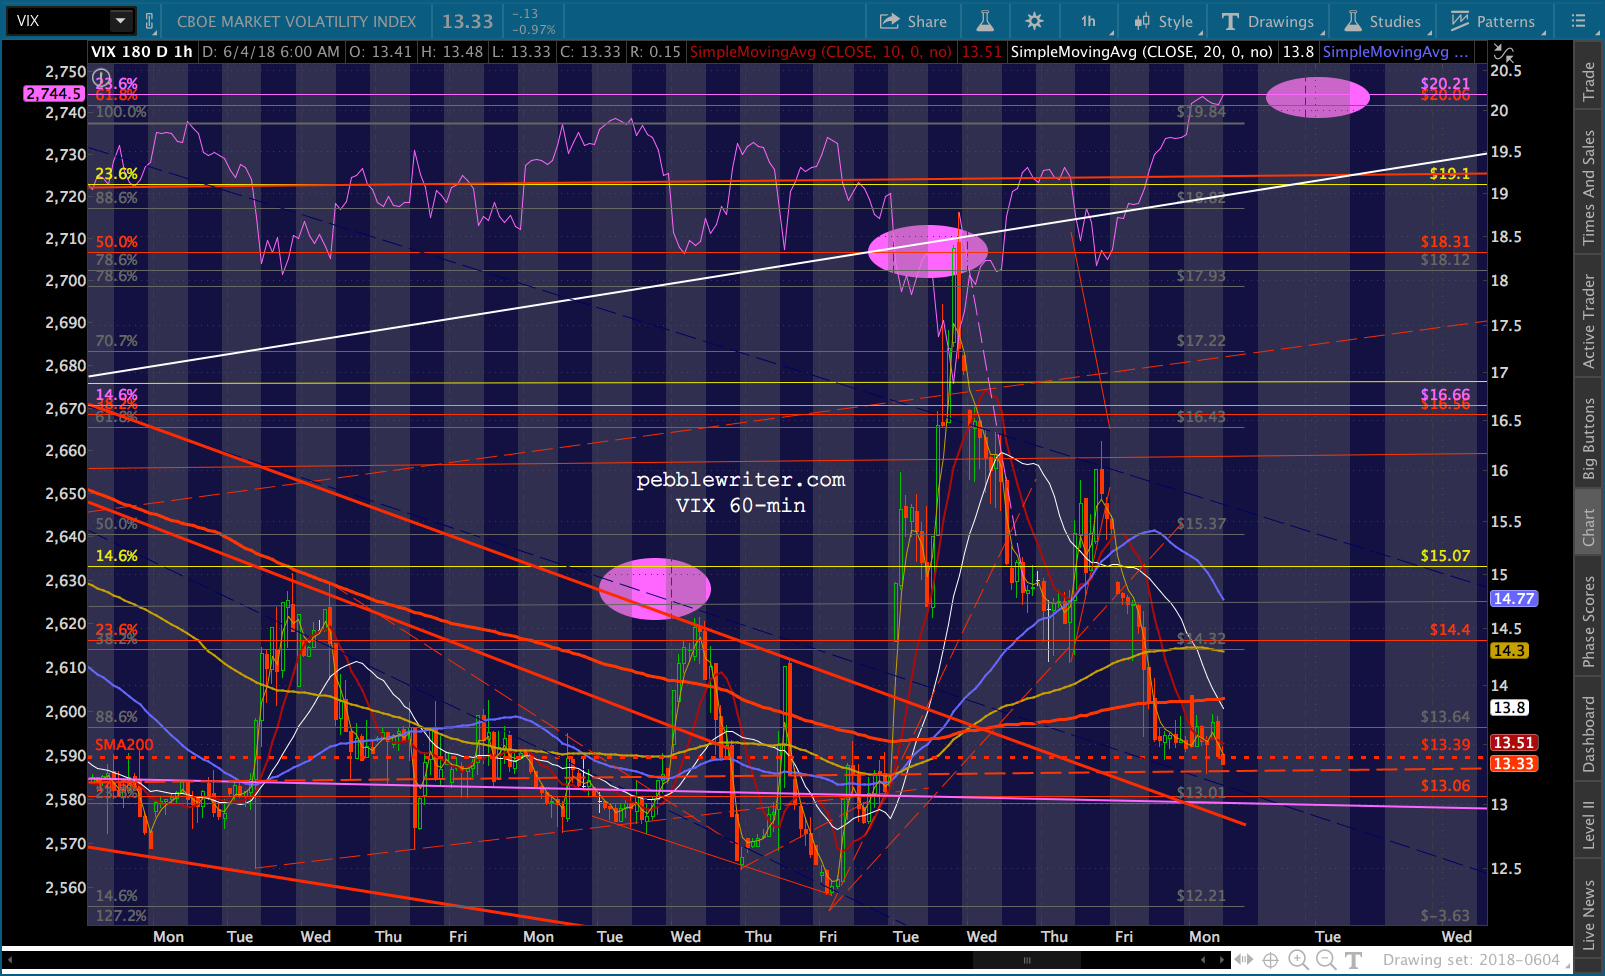

 Now, back to oil and gas prices…
In 2017, we saw a very strong correlation between gas prices and CPI.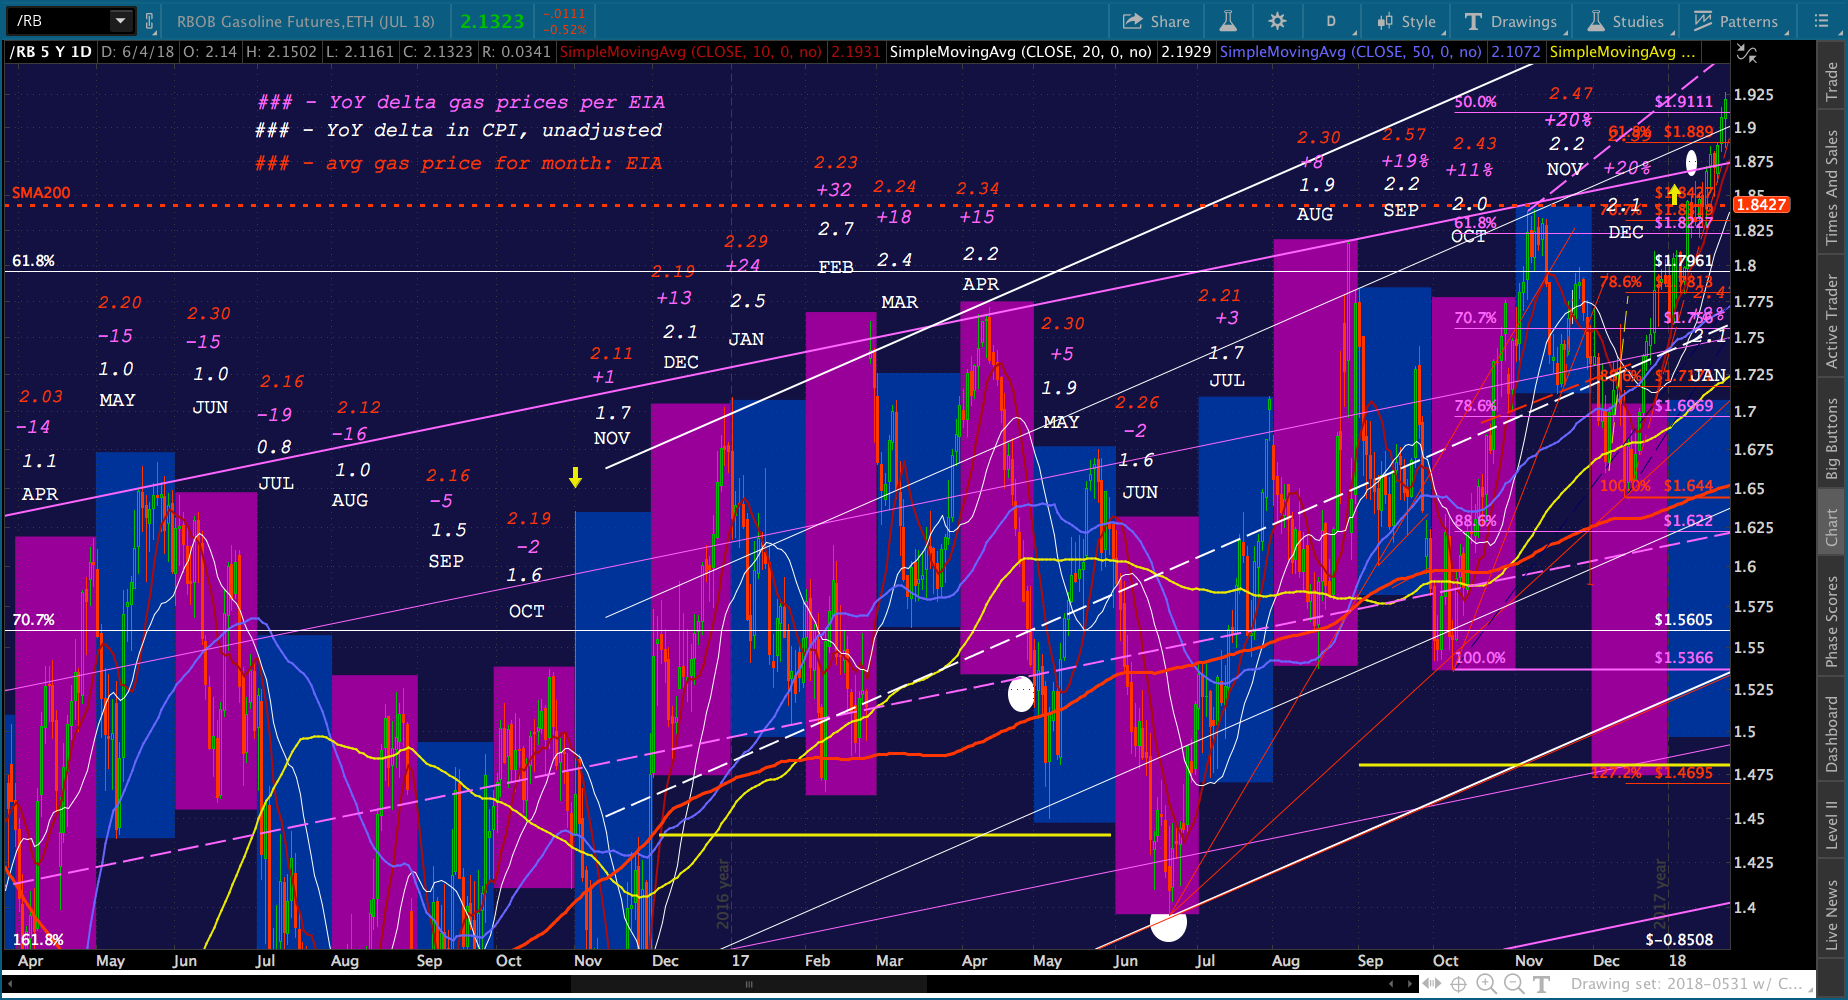 A reminder re the relationship between gas prices and CPI. Note the Feb spike and the seemingly deliberate effort to rein CPI back in.
 At the time, the concern was that the 10Y had shot up above 2.5%.
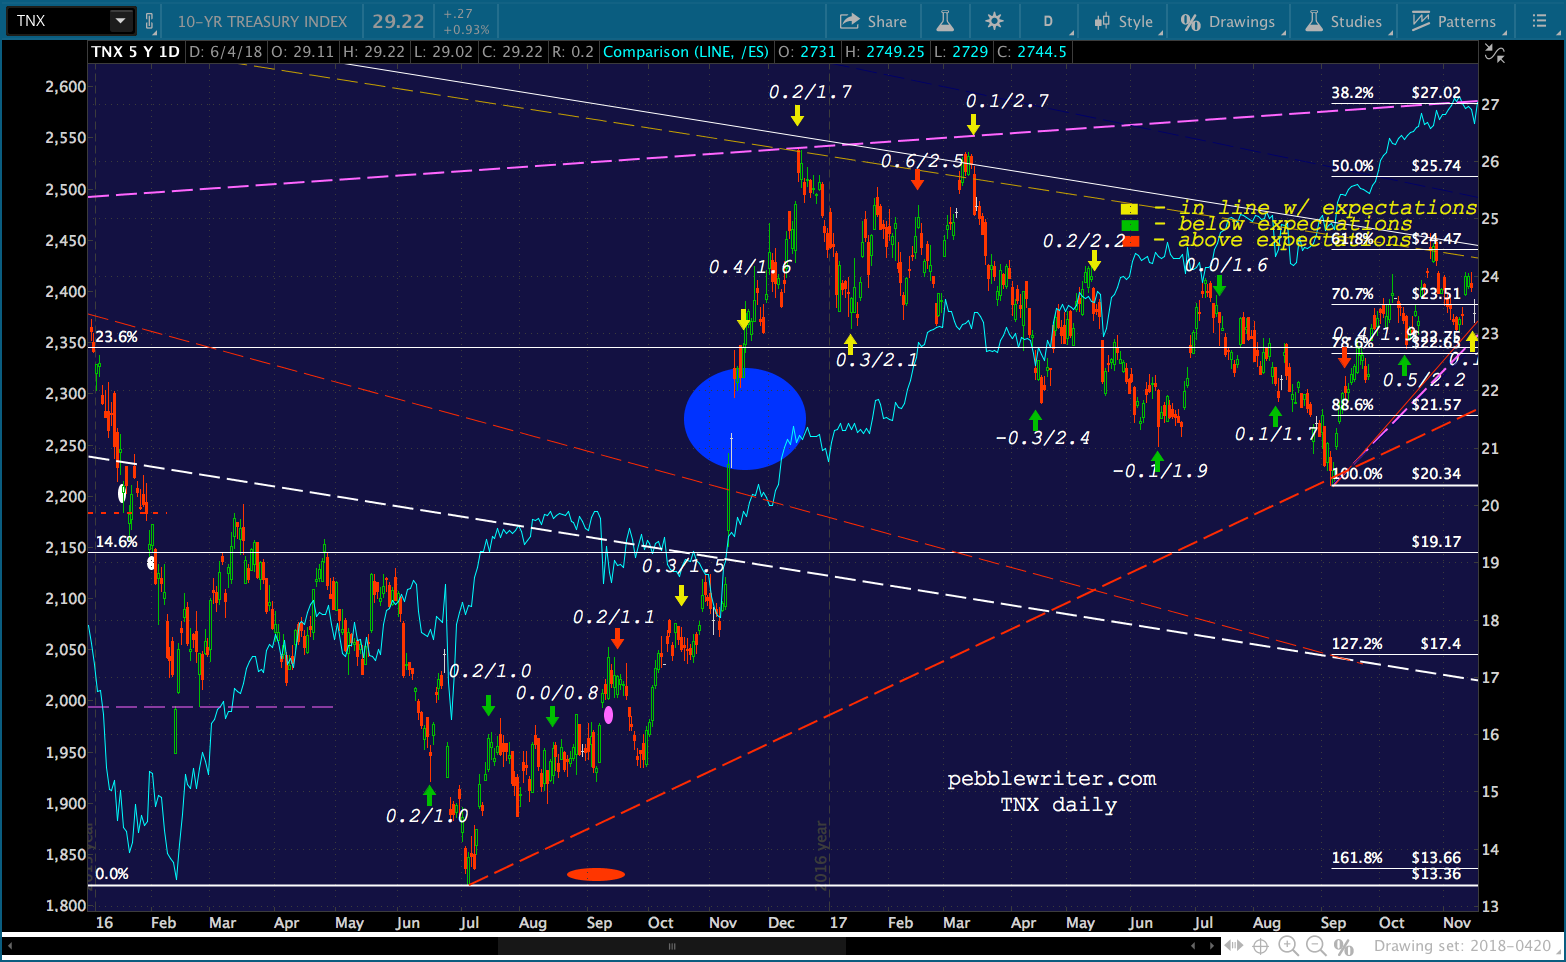 I take the time to look back at Feb 2017 because I think we’re back in the same boat. The market is acting bullish lately, but interest rates are uncomfortably high due to inflationary oil and gas price behavior.
Back then, SPX had rocketed higher largely on the rebound oil and gas prices had experienced since the Feb 2016 lows.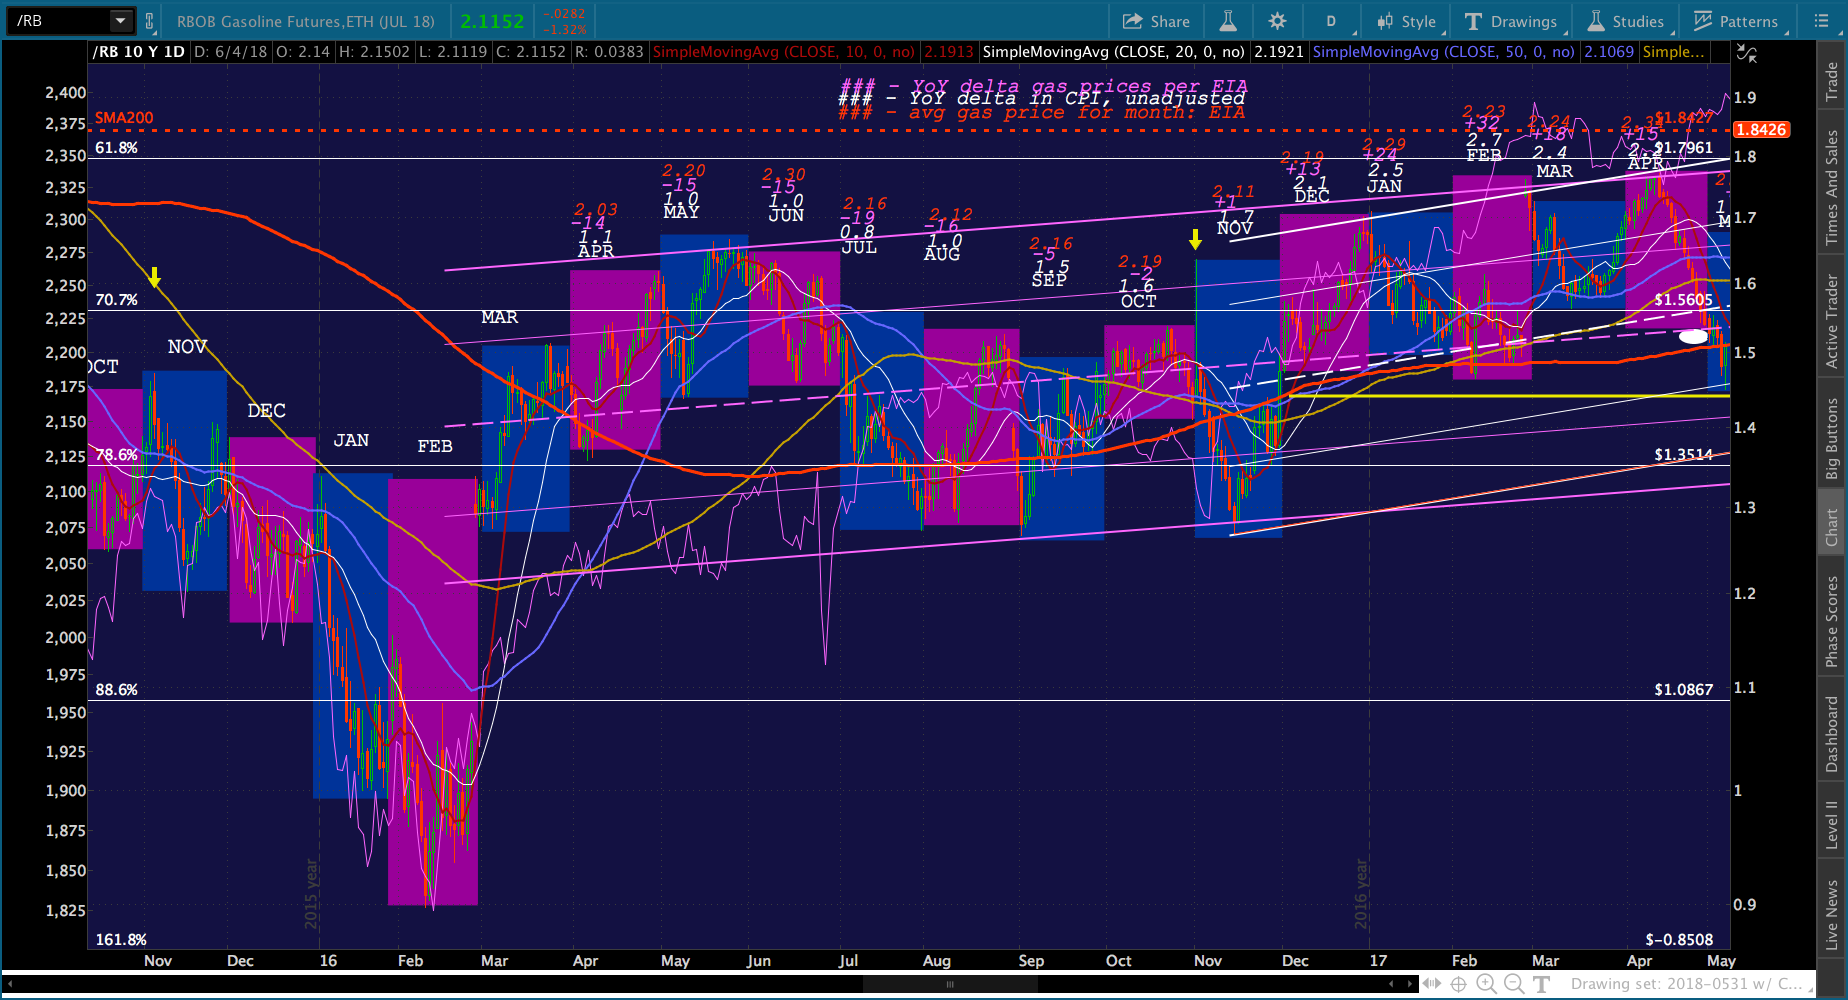 A close-up shows that late and early-month spikes and plunges have been the norm. Note the Feb 27 gap higher in RBOB. What was so important that RB should pop that much on the last two trading days of the month?
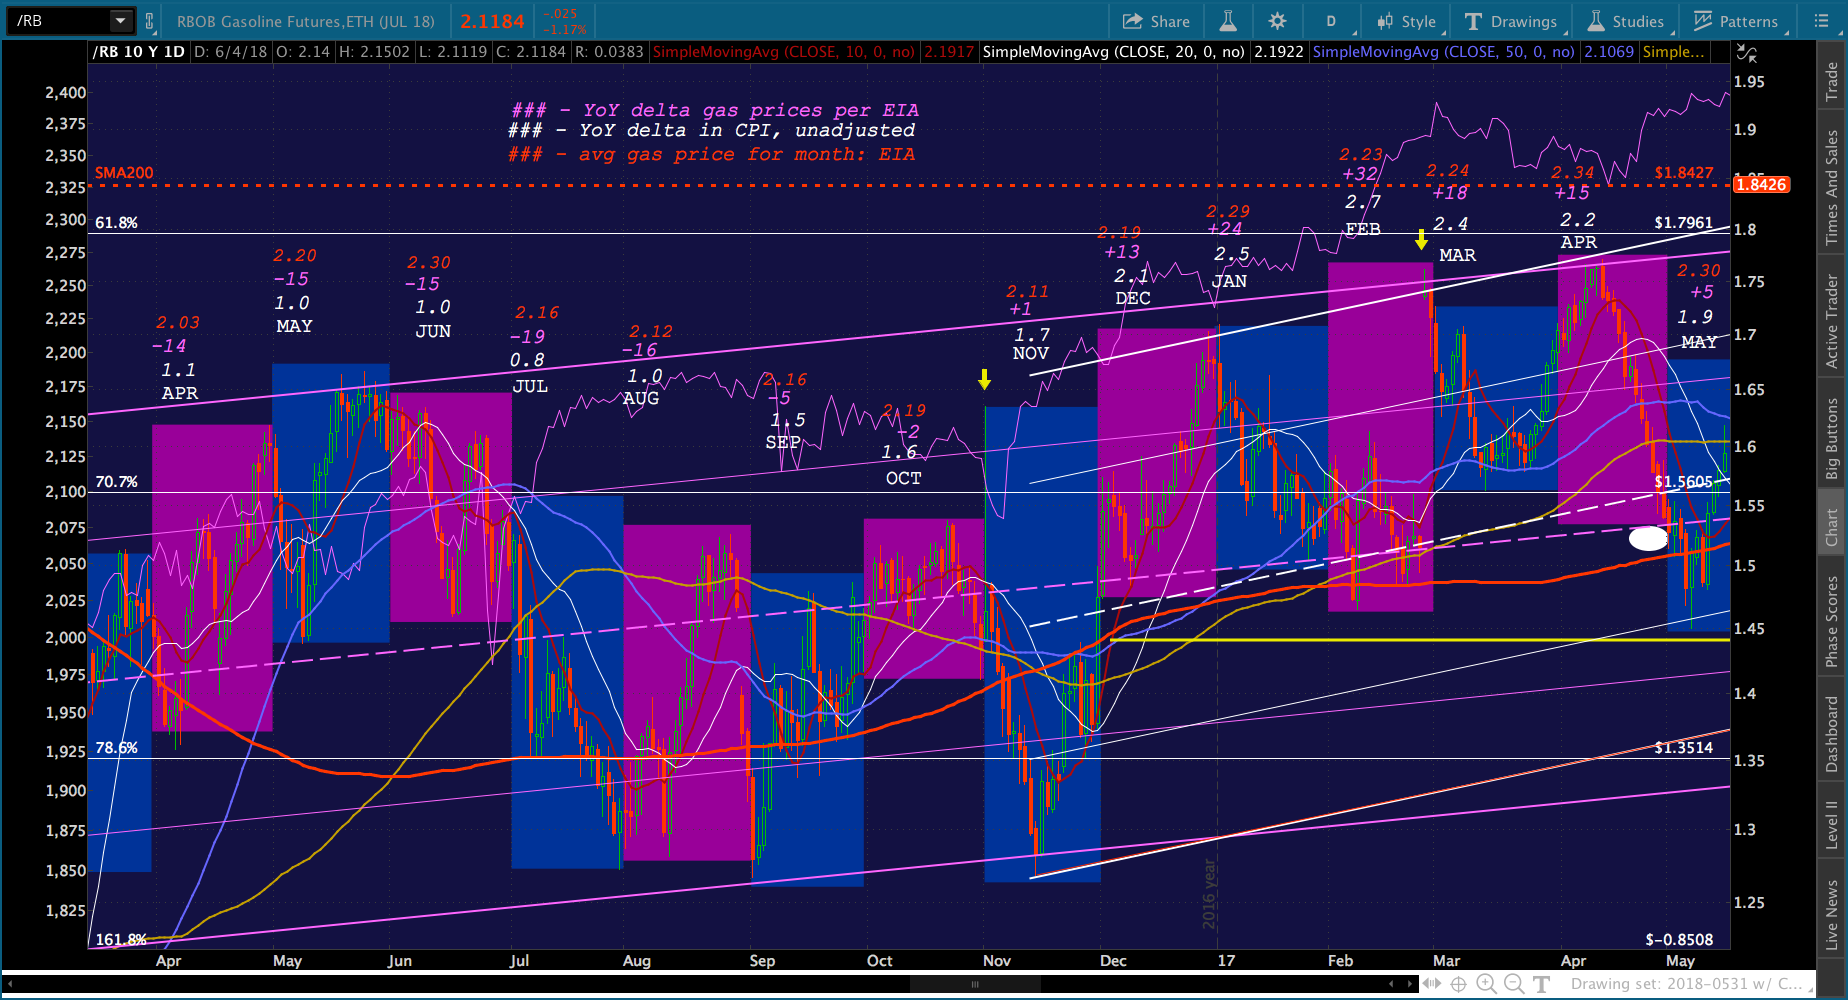 The answer is clear if we look at SPX. The spike helped SPX remain above the purple 1.618 extension instead of reversing at it. Remember, this was soon after the near-meltdown in the wake of the US election.
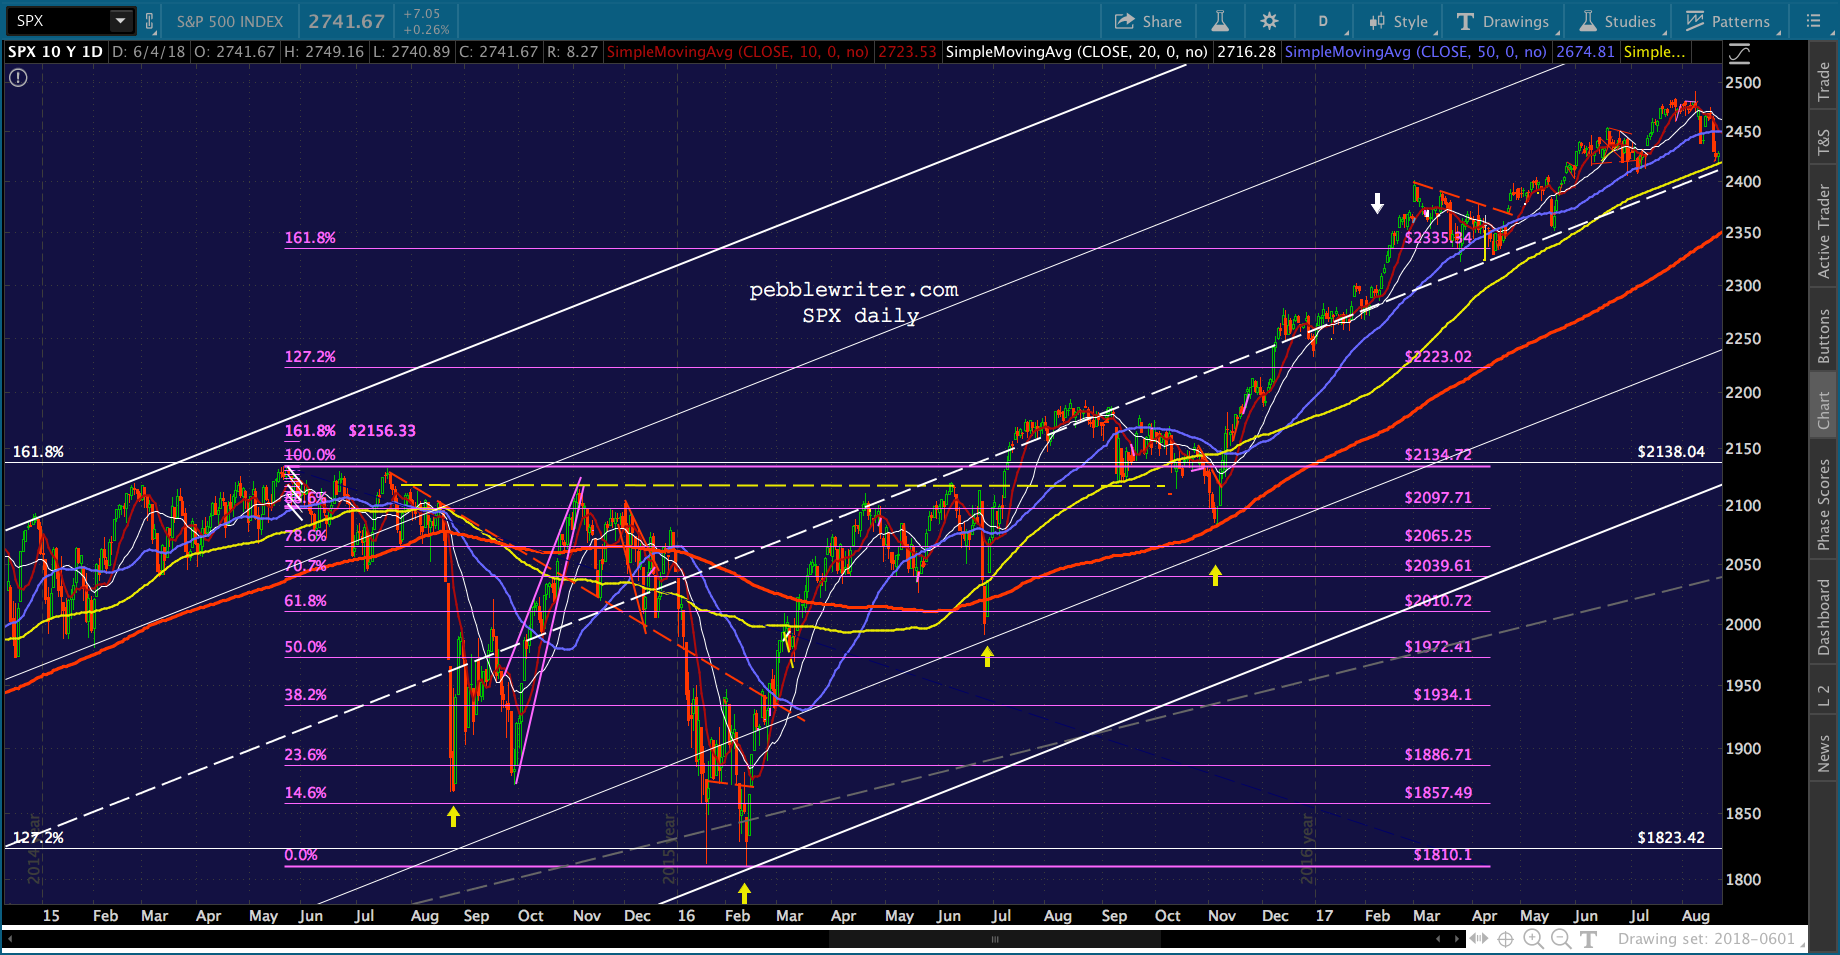 It had help, as mentioned before, from VIX.
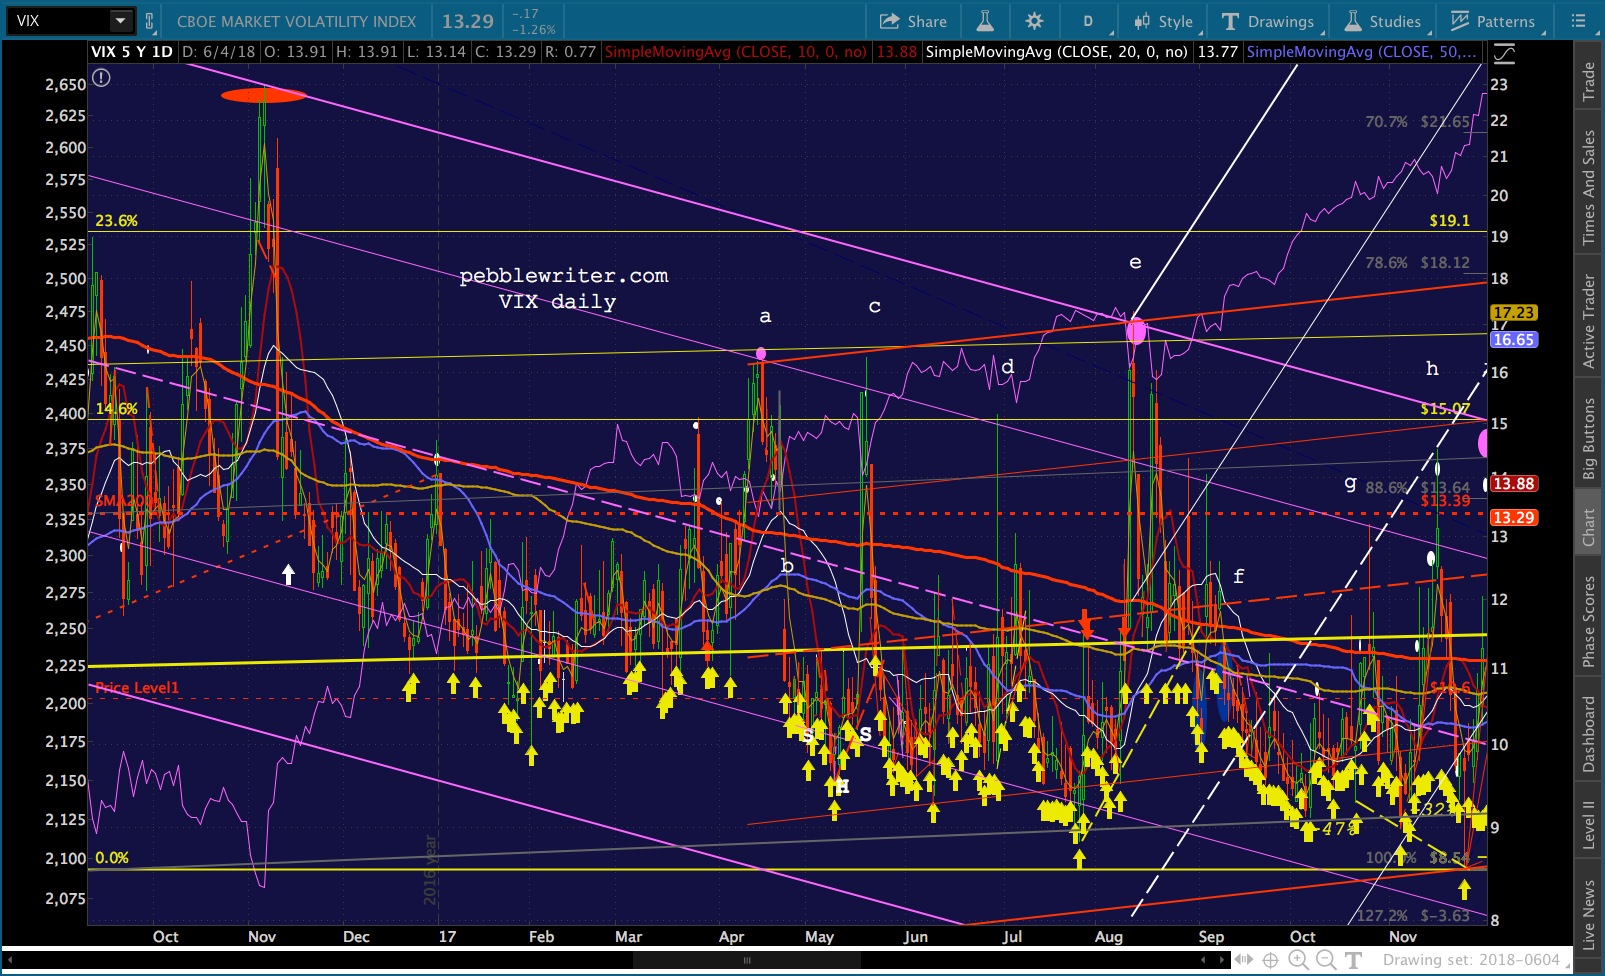 Obviously, the end of the month involved a contract expiration. But, note that the same thing happened at the end of Feb in 2016, 2017 and 2018 (the white arrows.)
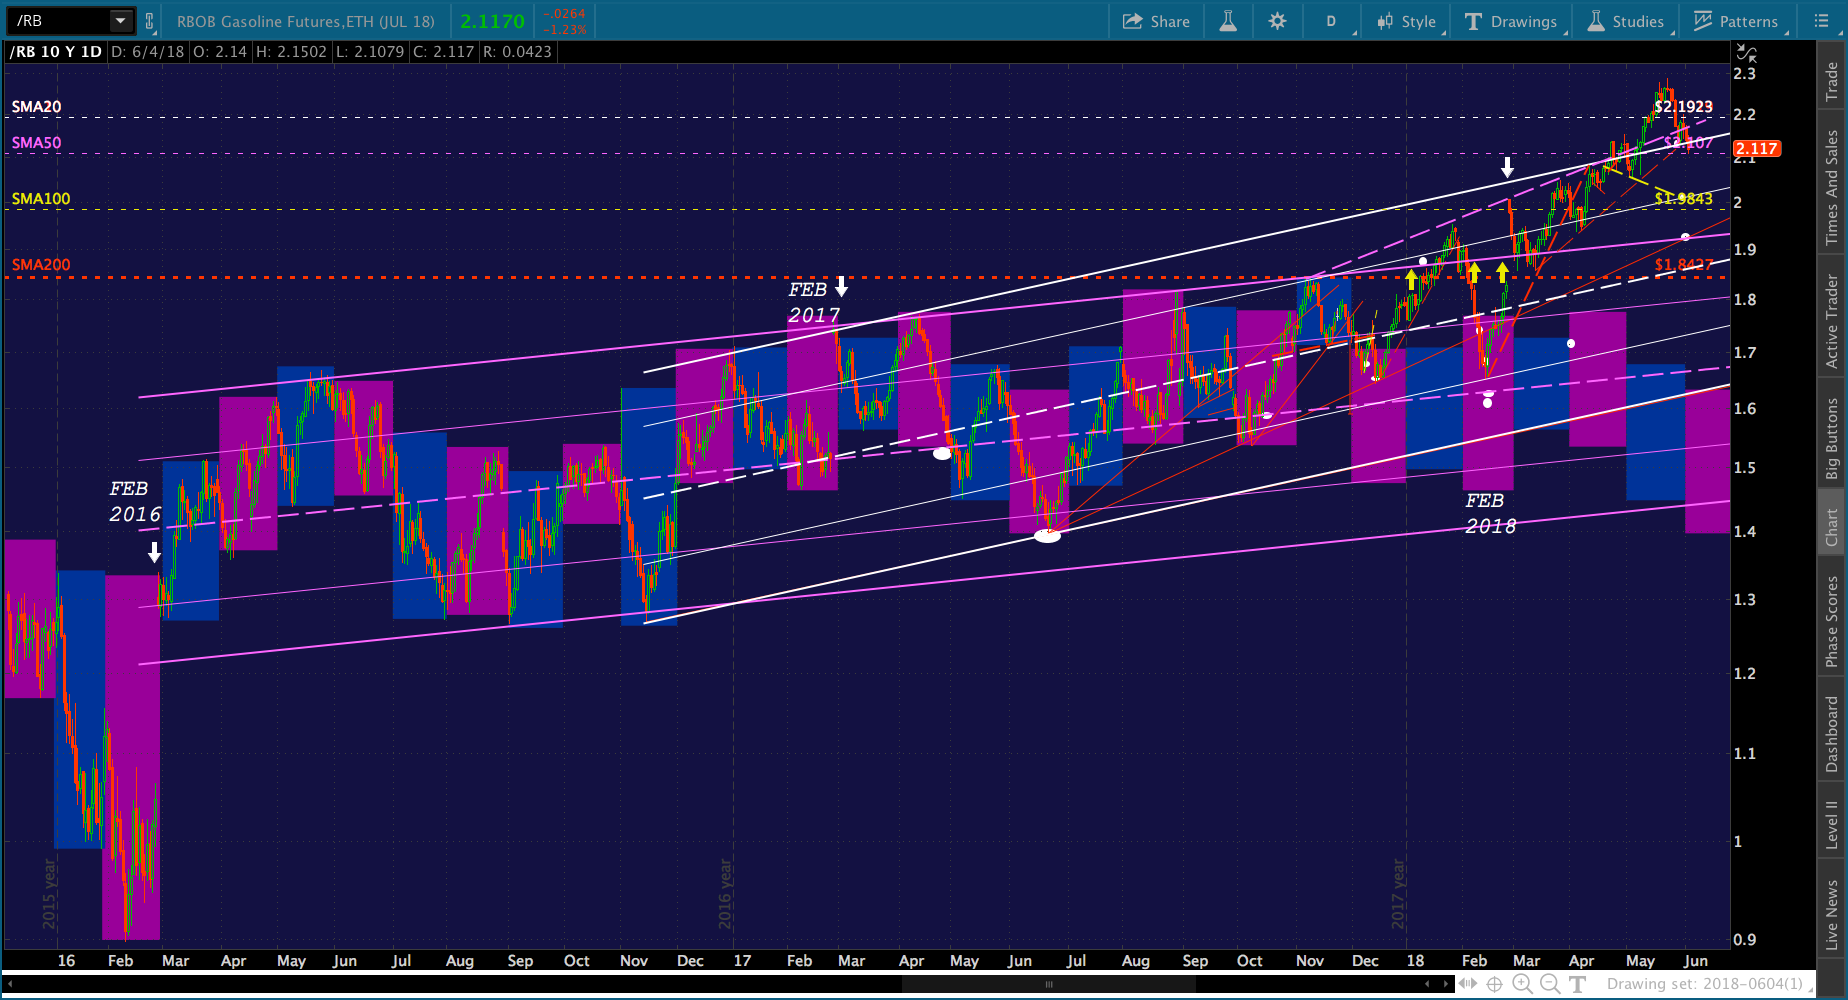 And, here’s where I need to do a little editorializing… I believe there’s a critical, fundamental battle going on between the powers of inflation and stability.
In the past, inflation of 4-6% or higher was acceptable for many investors. Stocks appreciated smartly along with real estate and other hard assets. 
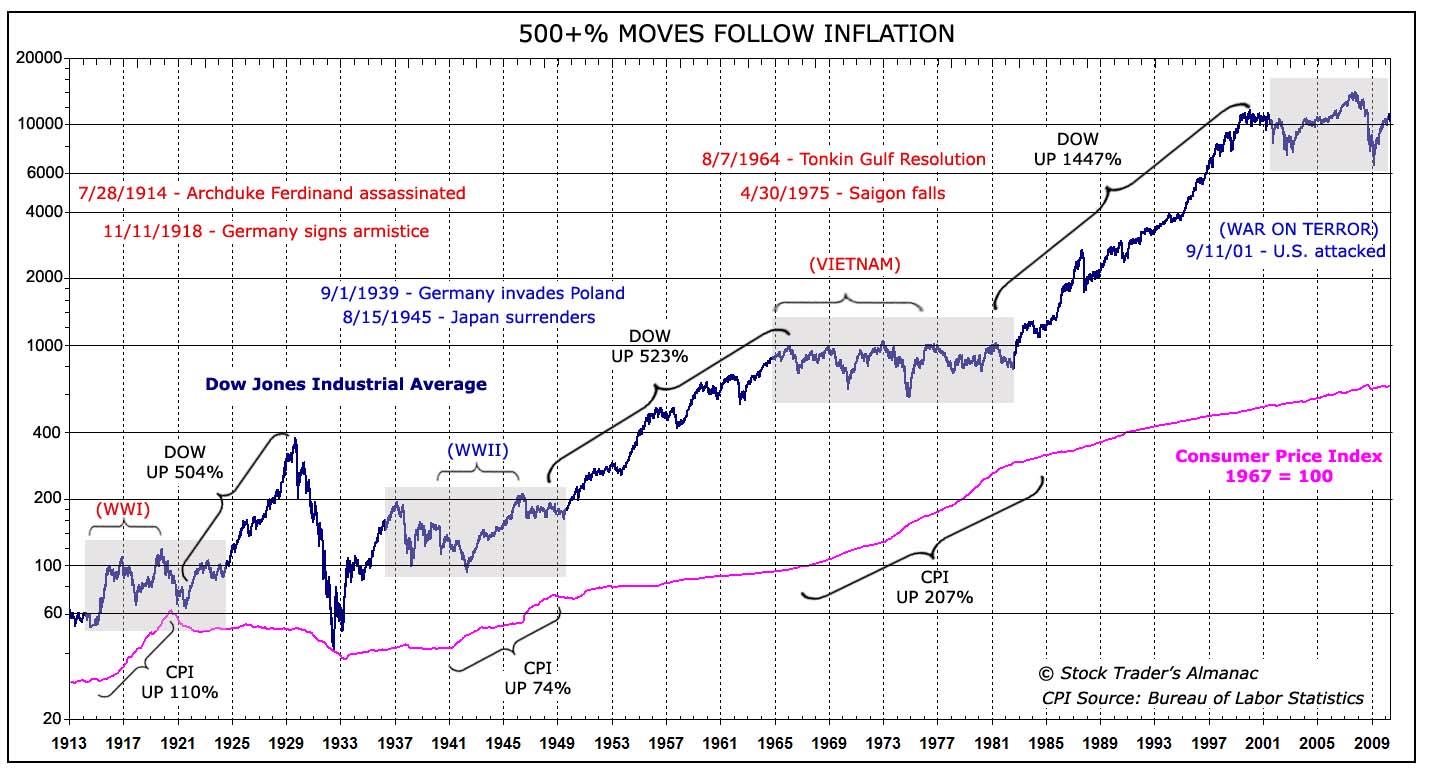 This symbiotic relationship might have continued ad infinitum had it not been for the GFC which saddled central banks (owners) and governments (owers) will trillions in debt. At $5 trillion, 6.6% on the 10Y isn’t that big a deal. But, with $21 trillion, it matters quite a lot.
The Fed, BoJ and ECB get it, and that’s why interest rates have been so low for so long. It’s also why they cannot be allowed to go back to historic norms.

So, as much as hard asset guys like Trump might like to have 4-5% inflation again, central banks know that it would be disastrous — at least until the debt has been reduced to a reasonable level. I don’t know anyone who believes that will happen any time soon.
Given all the above, I submit that the Fed and the Treasury are working to set an interest rate that will avoid economic catastrophe but maintain the value of the US dollar. Currently, the spread between US and most other countries’ 10Y is huge — which helps support the value of the dollar.
This is important, as the US is a net importer. A faltering USD would add to inflationary pressure and higher interest rates. So, the trick is to find an equilibrium — high enough rates to keep the dollar relatively high, but without arousing investor fears about too-high inflation. For the past few years, this magic number has been 2%.
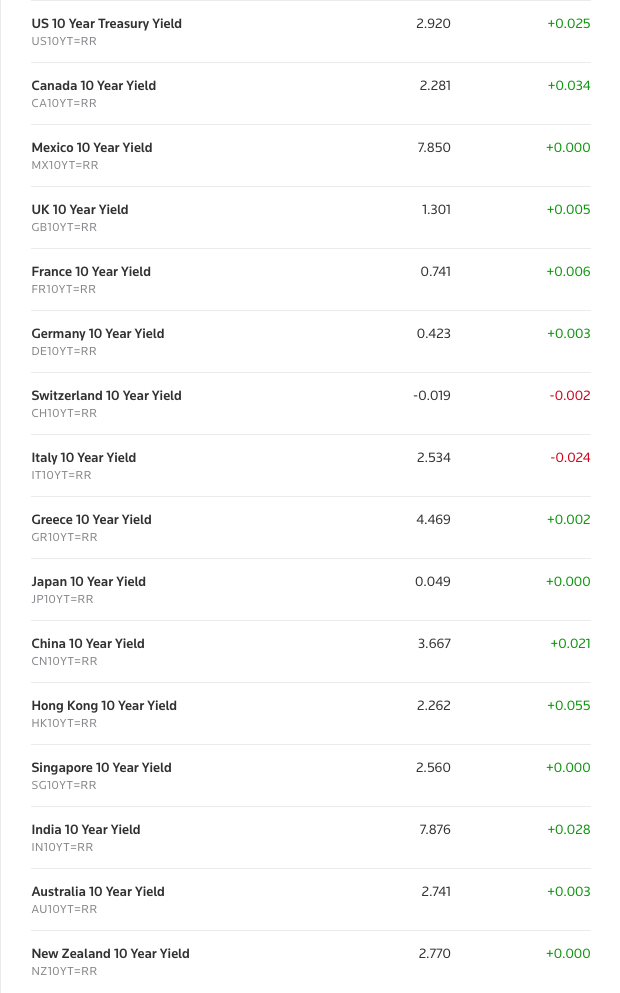 This means CPI of around 2%. The median rate on the 10Y since 2008 has been 2.21%. The median multiple of TNX to CPI over the past 10 years has been 1.26. So, a 2% CPI could be expected to produce a 10Y of around 2.52% – relatively close to the median interest rate. This is all a back of the envelope calculation, anyway.
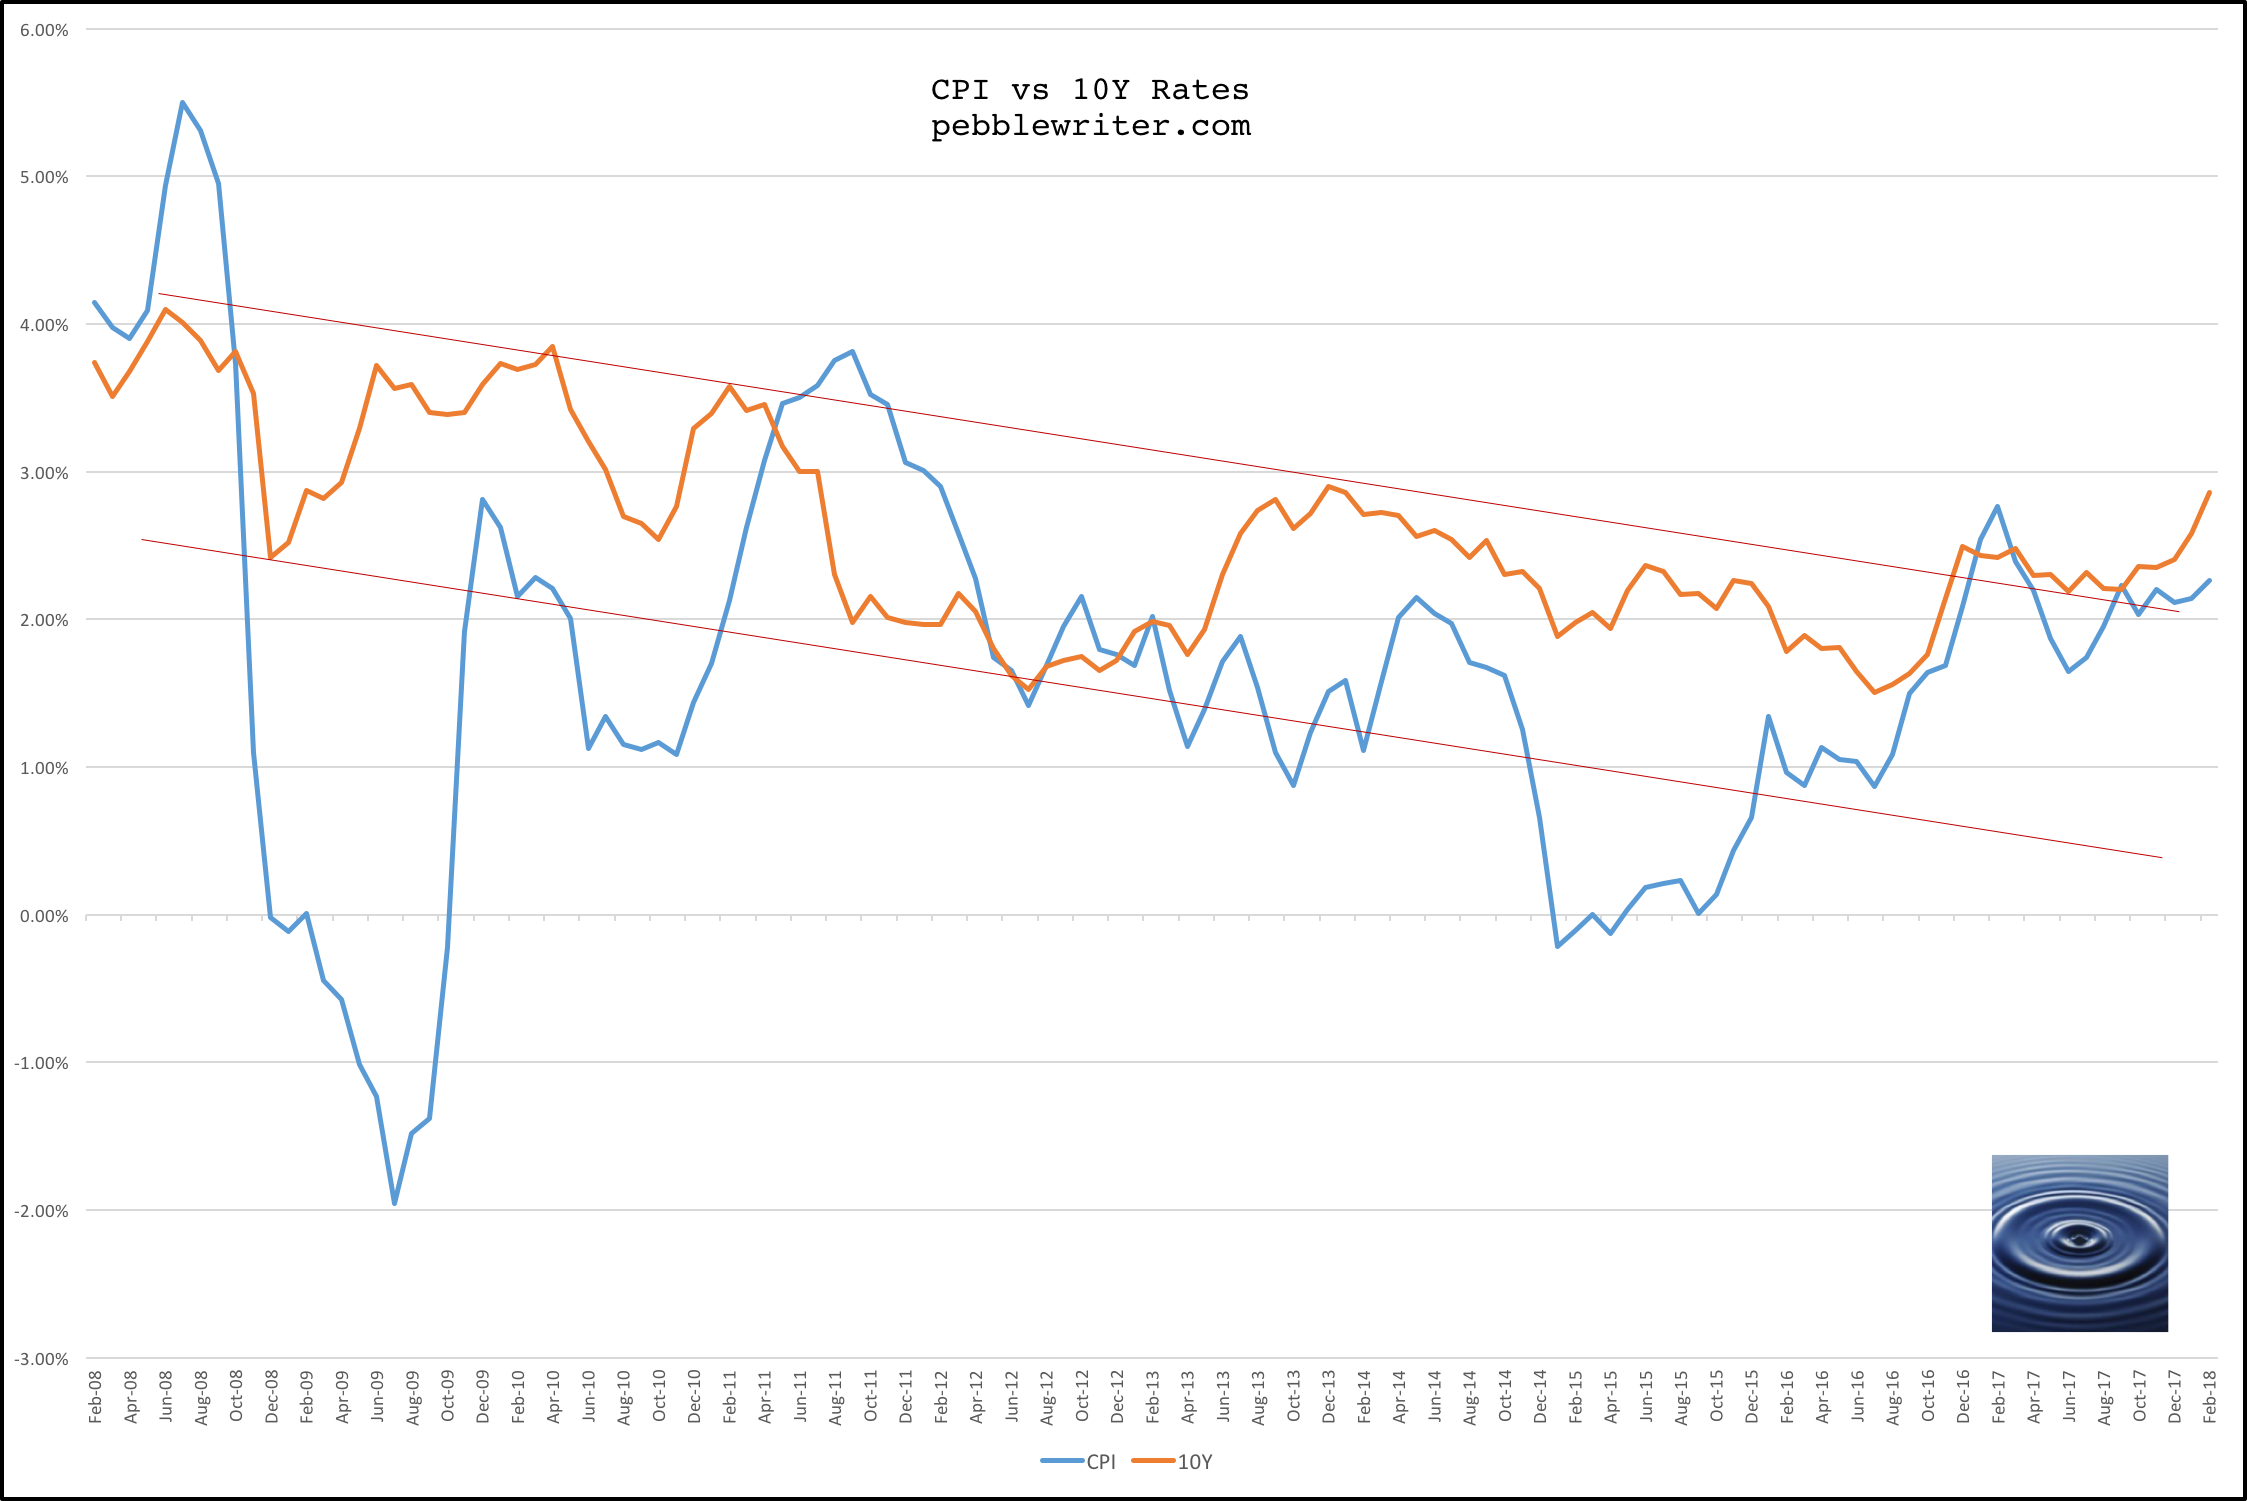 What would it take to register 2% CPI? I went back to 2008 and looked at those instances where CPI ranged from 1.8% to 2.2%. The average YoY change in gas prices when CPI ranged between 1.8-2.2% was 10.7%.
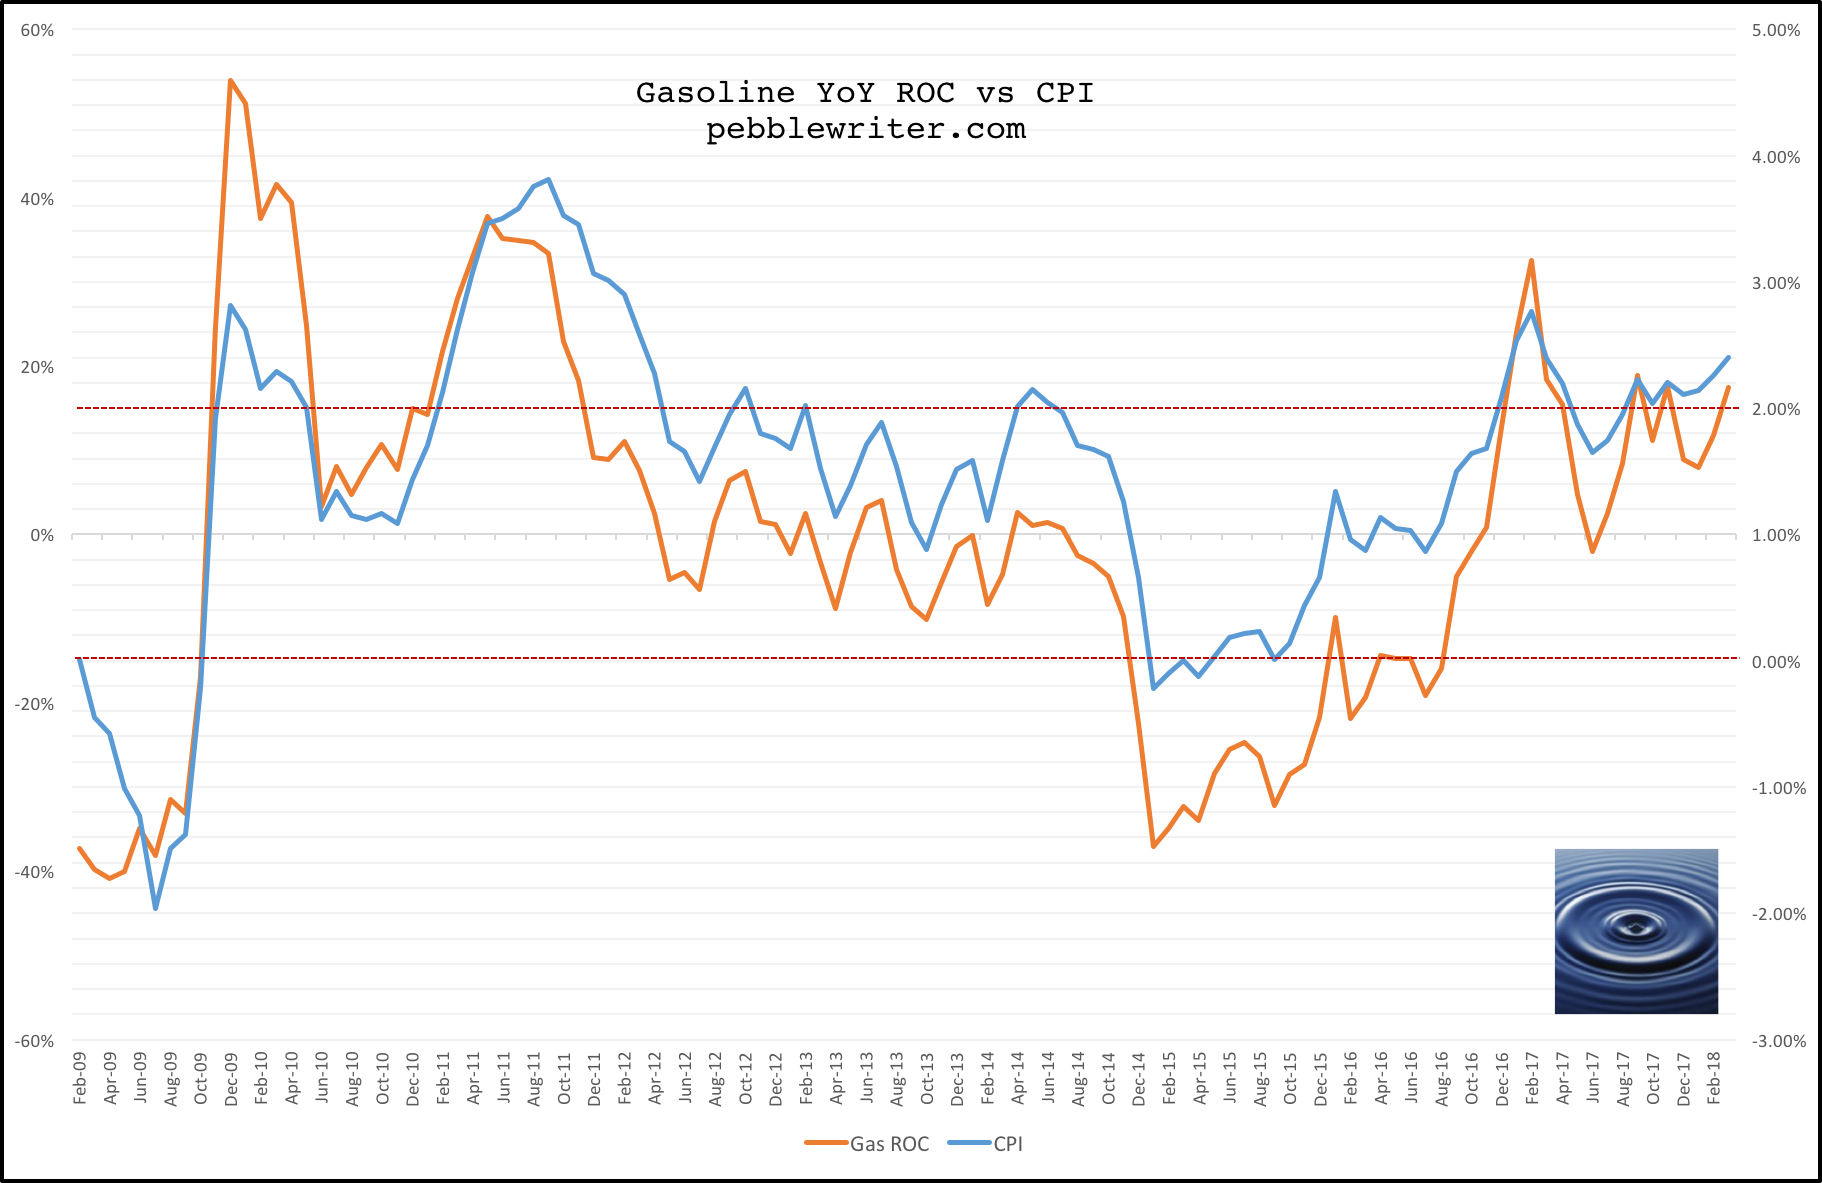 This jibes pretty well with recent experience. When CPI was between 1.8-2.0%, the YoY change on the chart above ranged from 5% to 20%, with a mean of 13.1 and a median of 12.5%. If we take 10.7% as the low and 13.1% as the high, then apply it to the June 2017 average price of 2.257, we get a June 2018 average price of 2.498-2.553. We’ll call it 2.52 on an average of 11.9% YoY change.
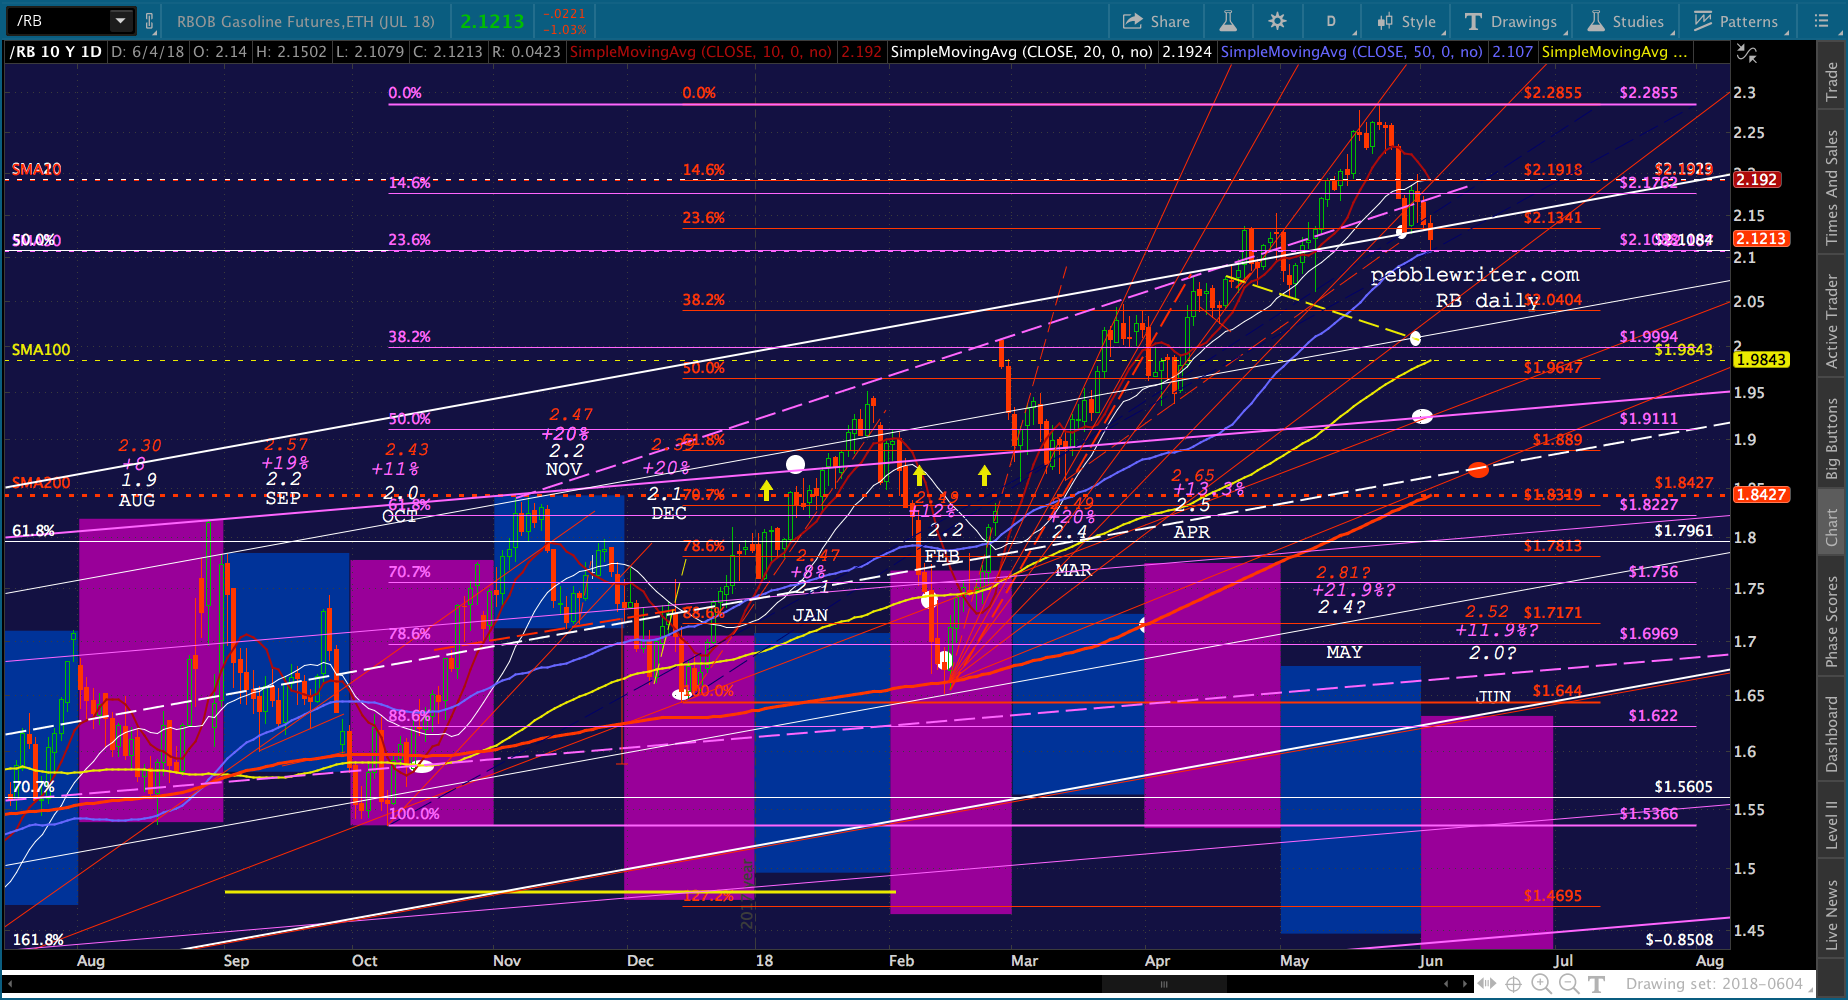
The current average price is 2.95, so we’re potentially looking at a 14% drop in gas prices. In RB terms, this would translate to about 1.85 (from 2.15.) Now, there’s obviously not a 1:1 correlationb between cash prices at the pump and RB futures. But, 1.85 is a very interesting number, as it is almost exactly where the SMA200 currently rests.
 For the record, I think this is probably overkill. For one, markets wouldn’t freak out if we didn’t return to 2% right away. The Fed, which is rumored to be seeking a higher high from which to begin the next round of easing, wouldn’t freak out either.
Also, July 2017 increased from June. So, by simply holding off a bit, CPI would moderate on a YoY basis. Last, note that 2.52 would represent a breakdown of the channel currently in place — the bottom of which looks more like 2.63ish.
The midline, currently at about 2.82, would be a 4.4% drop from 2.95 — equivalent to about 2.0-2.02 in RBOB.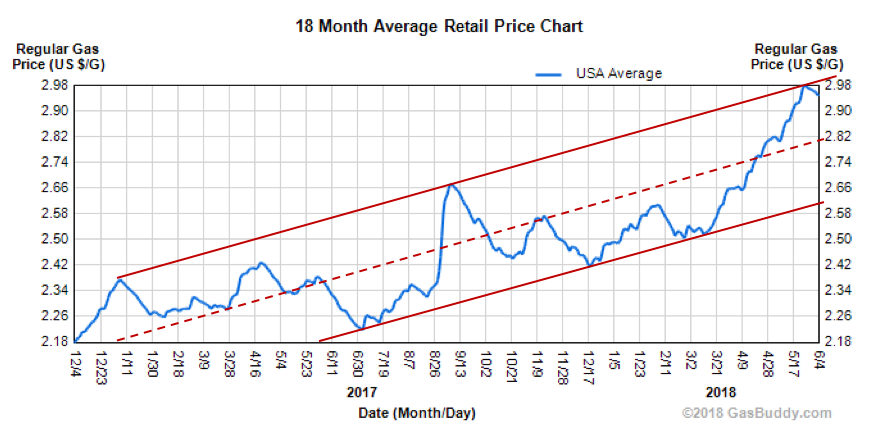 Looking at RB’s chart, it is currently backtesting the top of the the white channel from which it broke out around Apr 23. If that breaks down, which I think it will, then we’re looking at the SMA100 around 2.00 (also psychological and horizontal support.) This would equate to the gas price midline mentioned above.
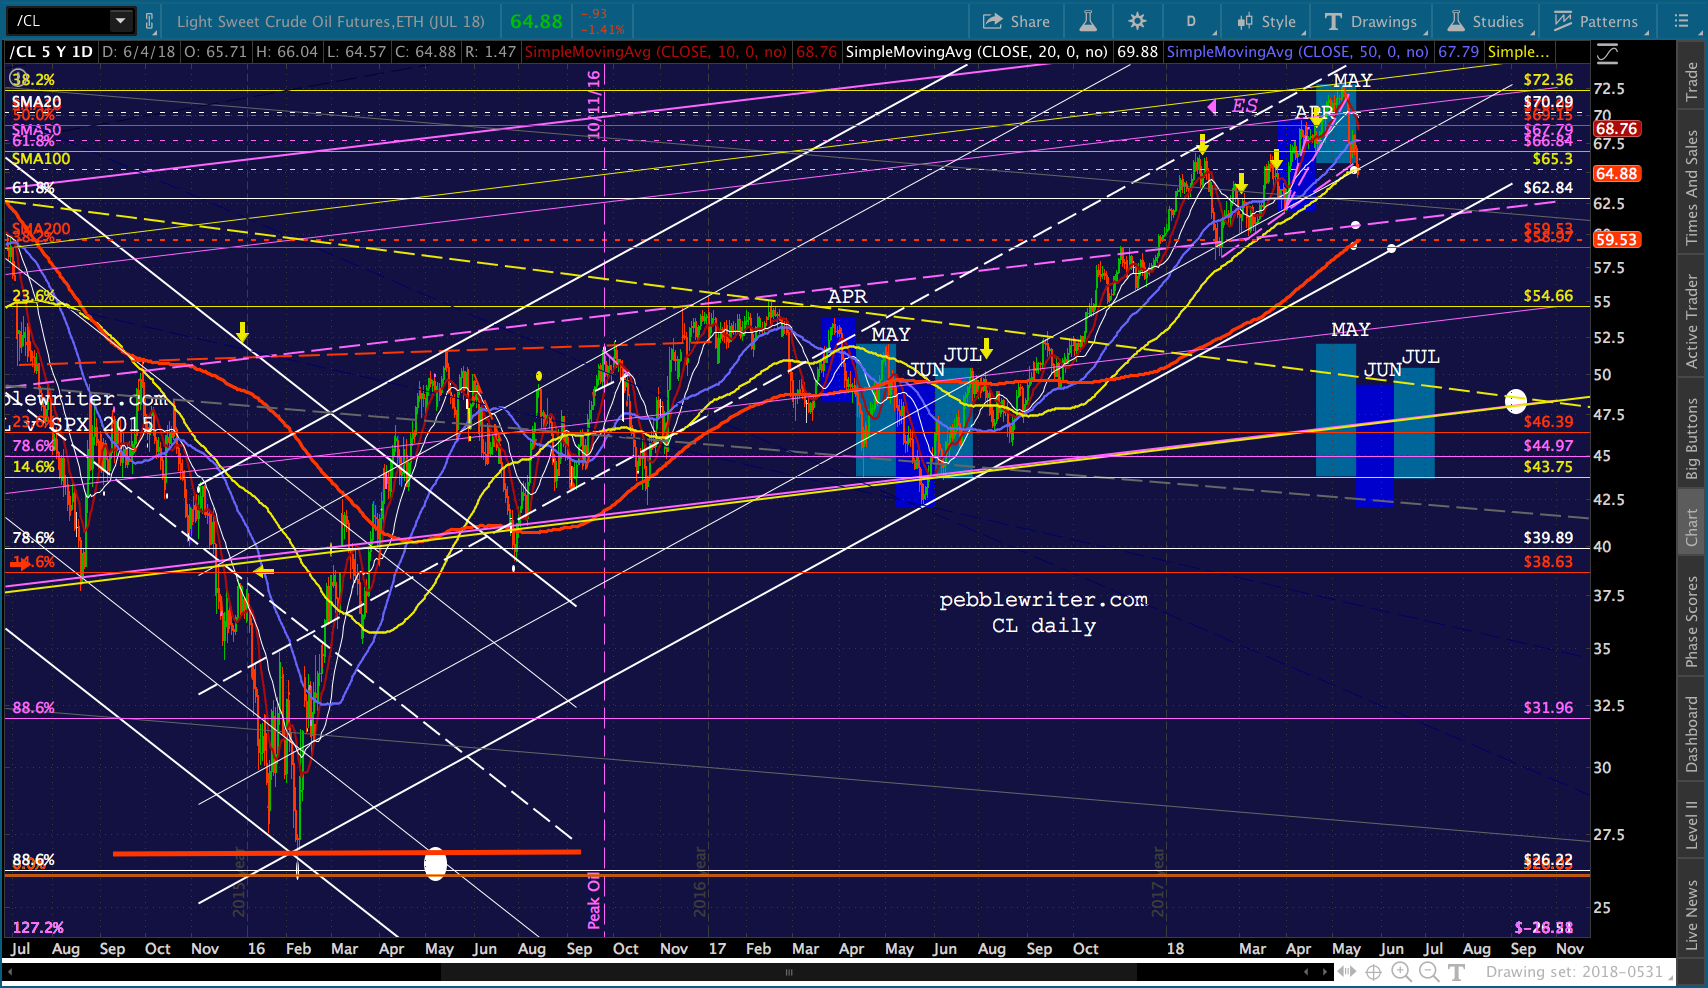
If that should break down, only then would we have a shot at backtesting the top of the purple channel broken out of (first attempt) on Jan 18, again on Feb 27, and then backtested between Mar 2-14. I’d call it 1.92. Just below it is the purple .500 at 1.911 and the red .618 at 1.889.
If all that should break down, then sure. We’d have a very good shot at the SMA200 currently at 1.8427 and rising about .0028/day. It should cross the white midline around June 14 (May CPI is reported Jun 12) and the red .618 towards the end of the month.
I’m going to stick with my price targets for CL: purple midline at 60.79ish, the SMA200 (currently at 59.53) and the white channel bottom where it intersects the red .382 at 58.97. These would represent a 16.6-19.1% drop from the 72.90 highs.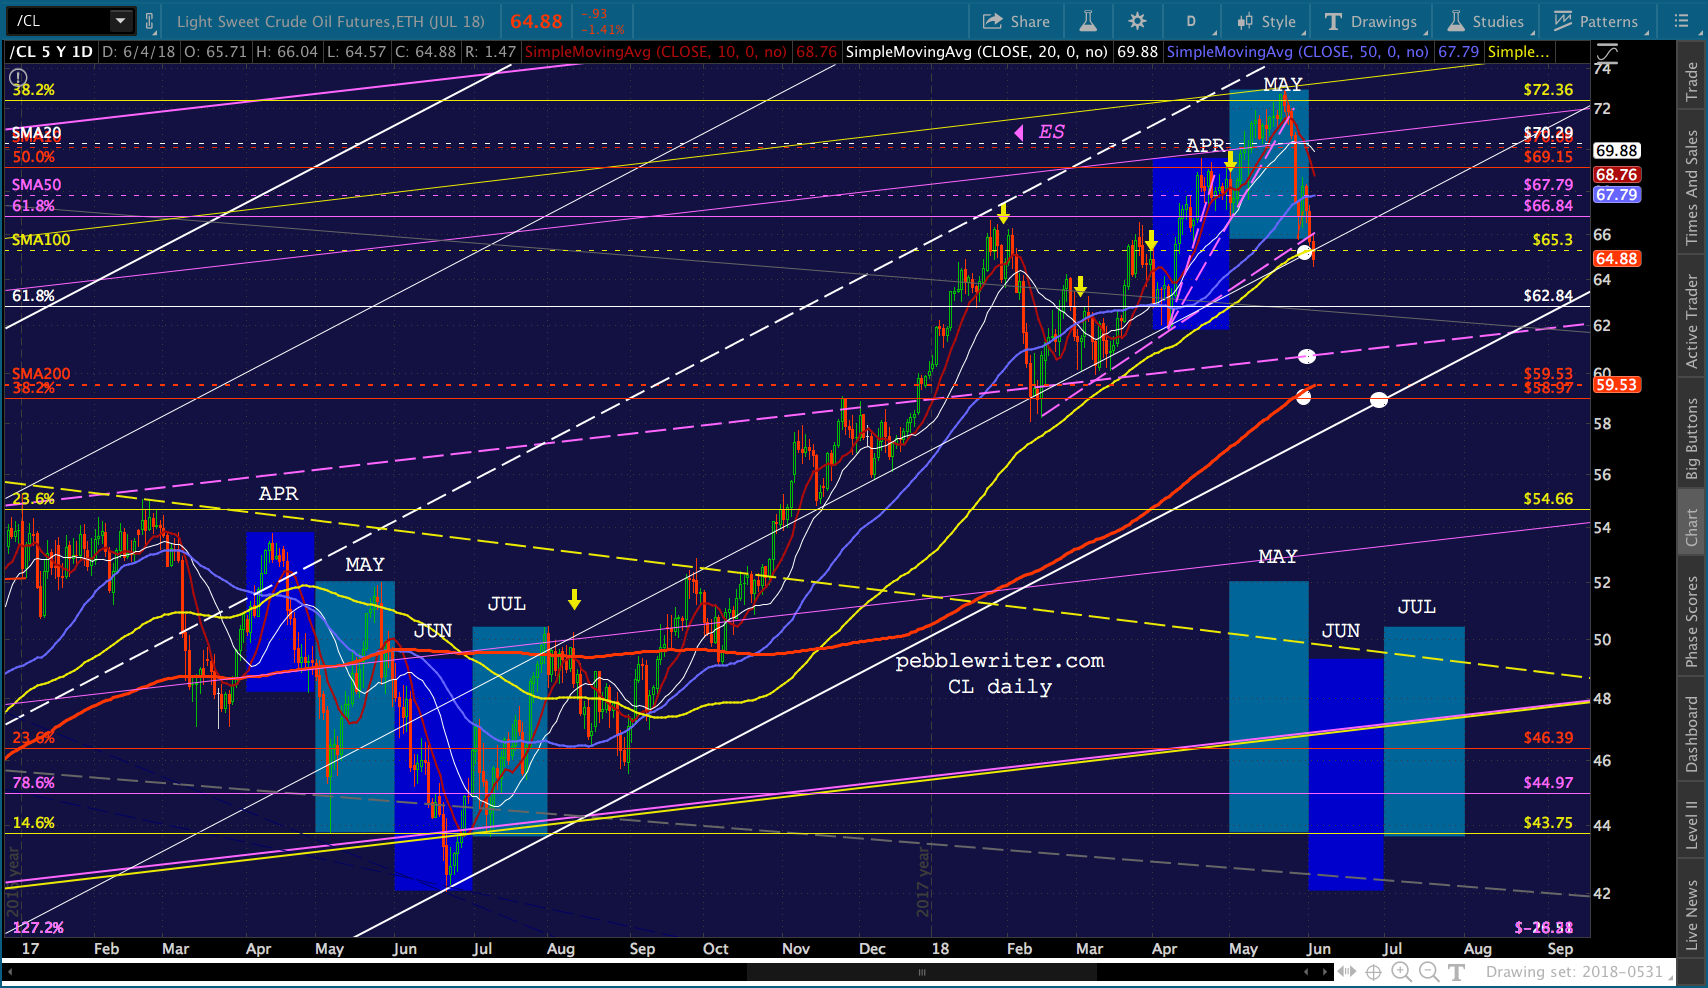 I like the lowest target best, as it affords a test of the white channel bottom. But, timing is obviously a big issue. And, if the drop has the effect on stocks that it did in 2017, then it makes that big a drop less desirable.
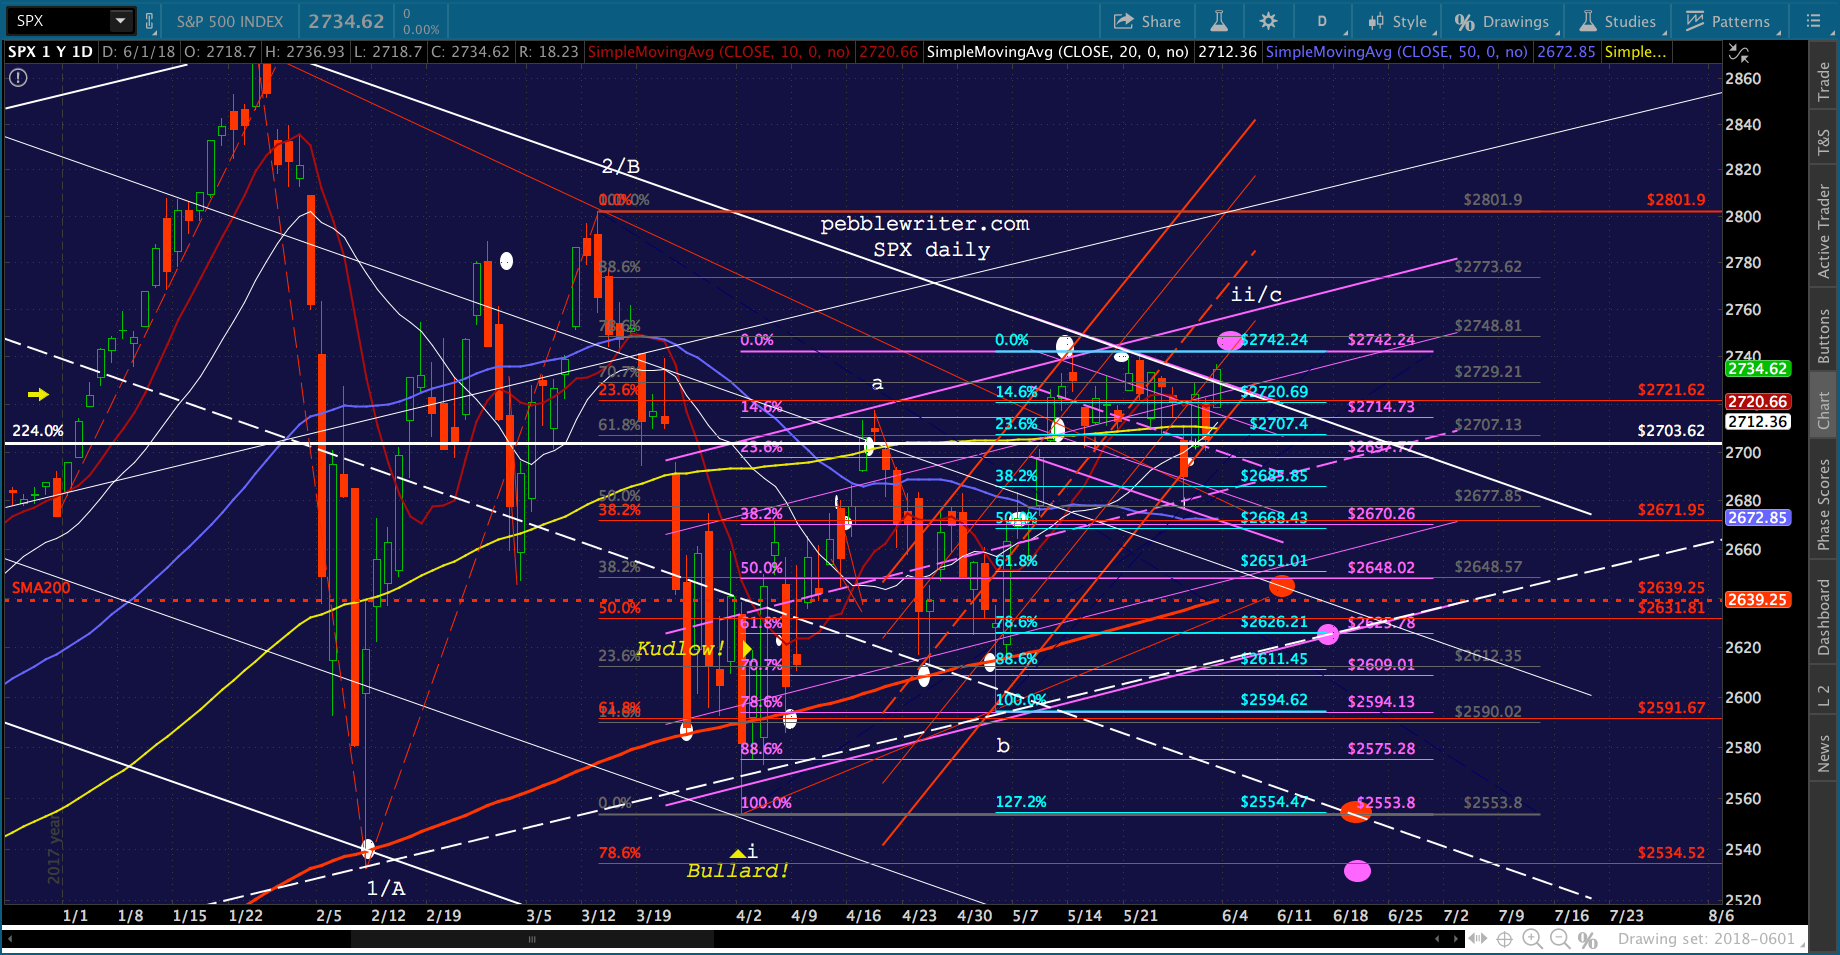
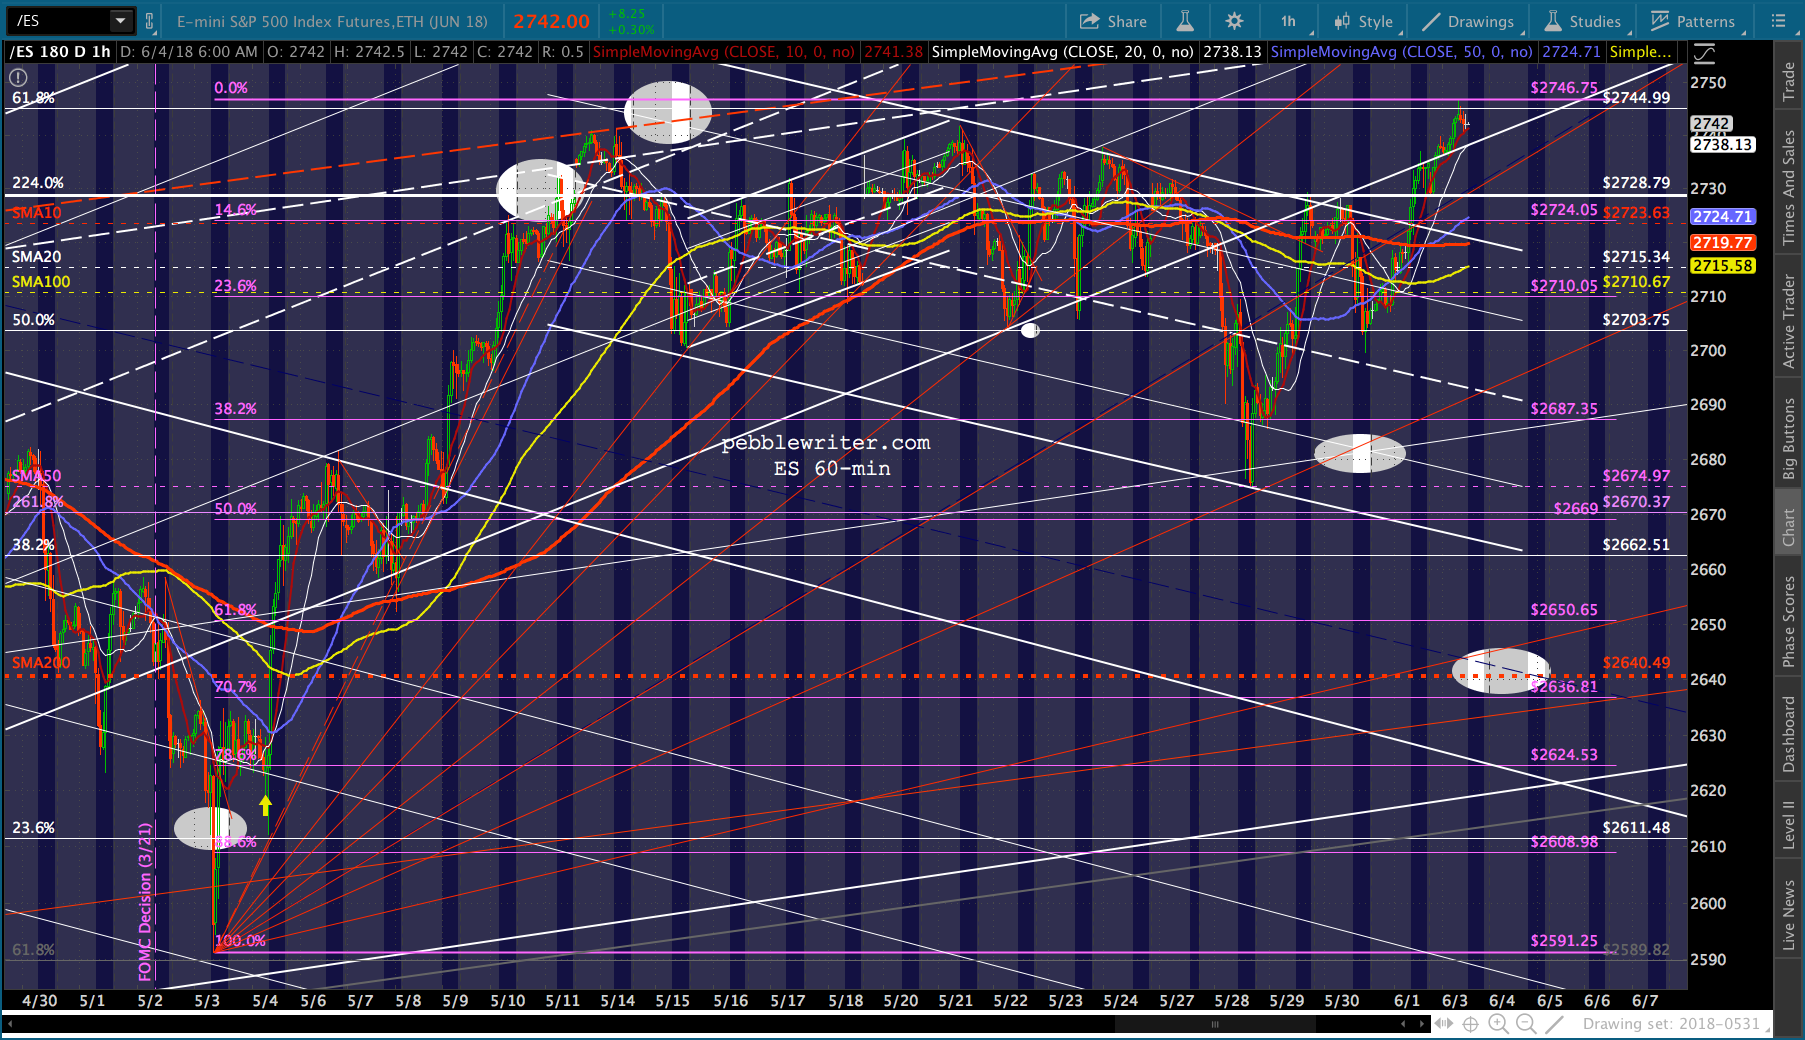
 Speaking of stocks…today, SPX reached the .786 retrace of the most recent pop higher. This potentially eaves us in excellent shape for a drop to at least the SMA200.
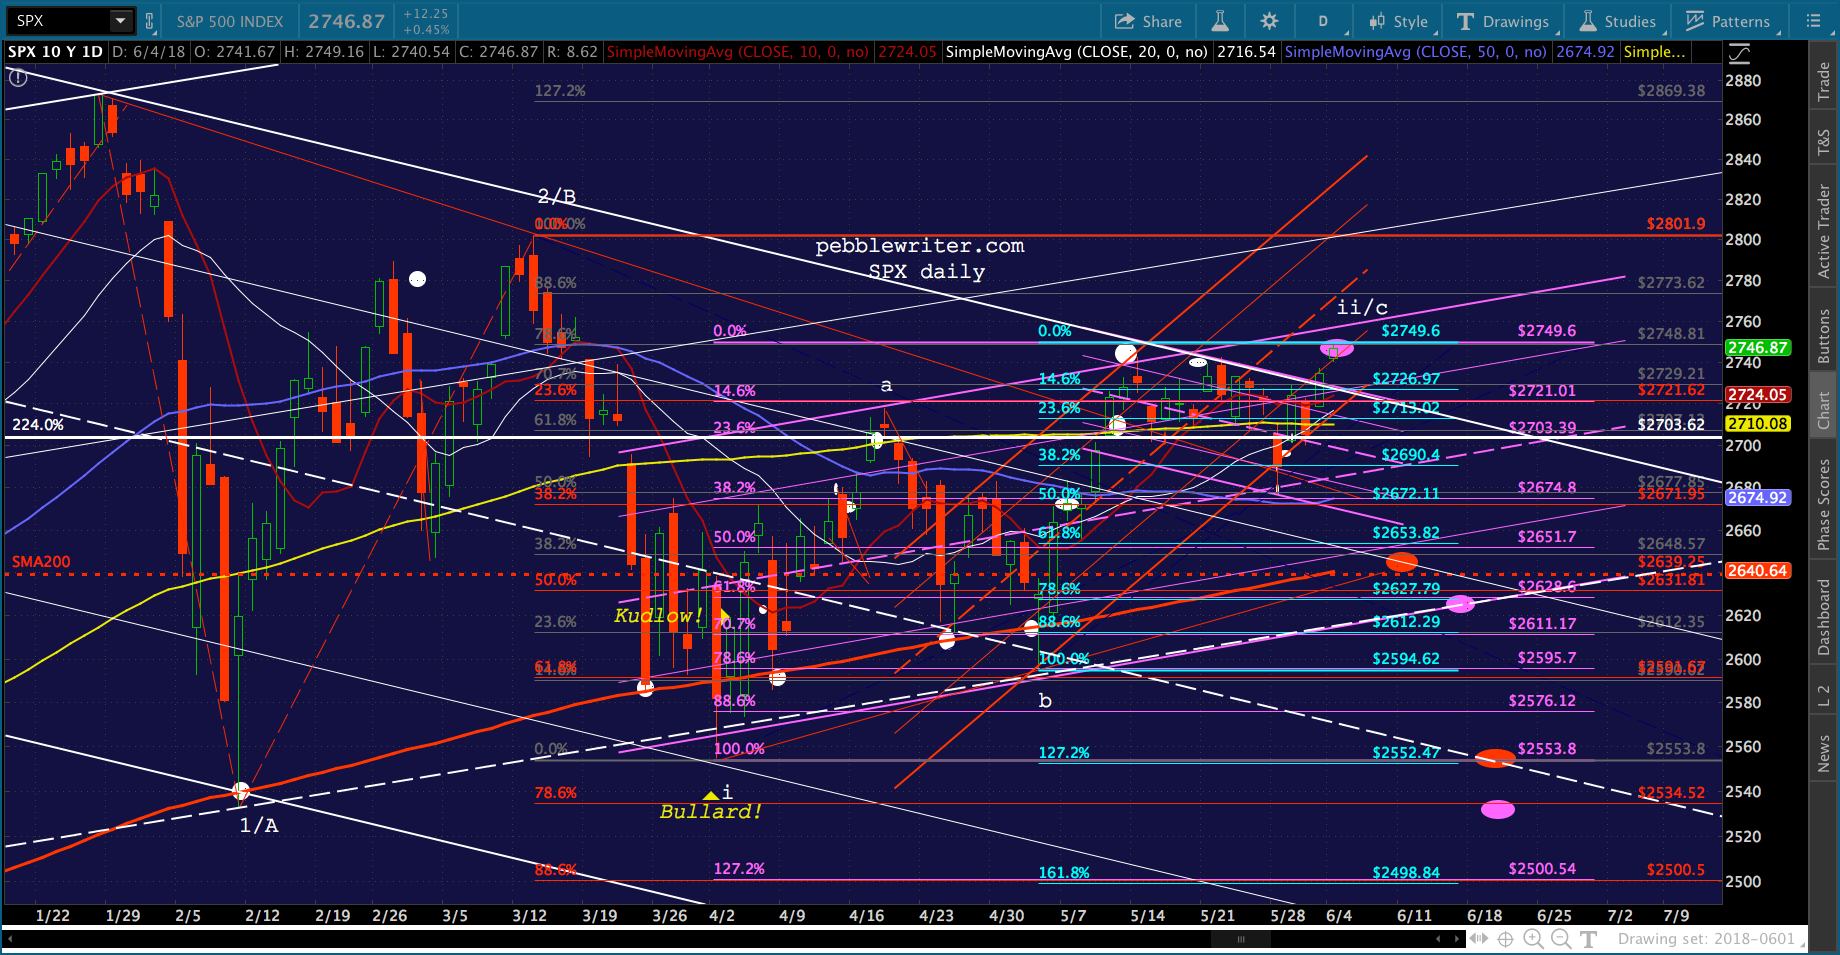 VIX — off almost 6% today and 32% since last week’s highs — threatens to drop a little more. I suspect we’re close to a reversal, especially now that SPX has a higher high on the corrective wave forming since Apr 2.
If we drop below the channel bottom at 11.90ish, then everything changes. The goal is to hold SPX 2703.62 and RB and CL will get yet another bounce before coming undone. 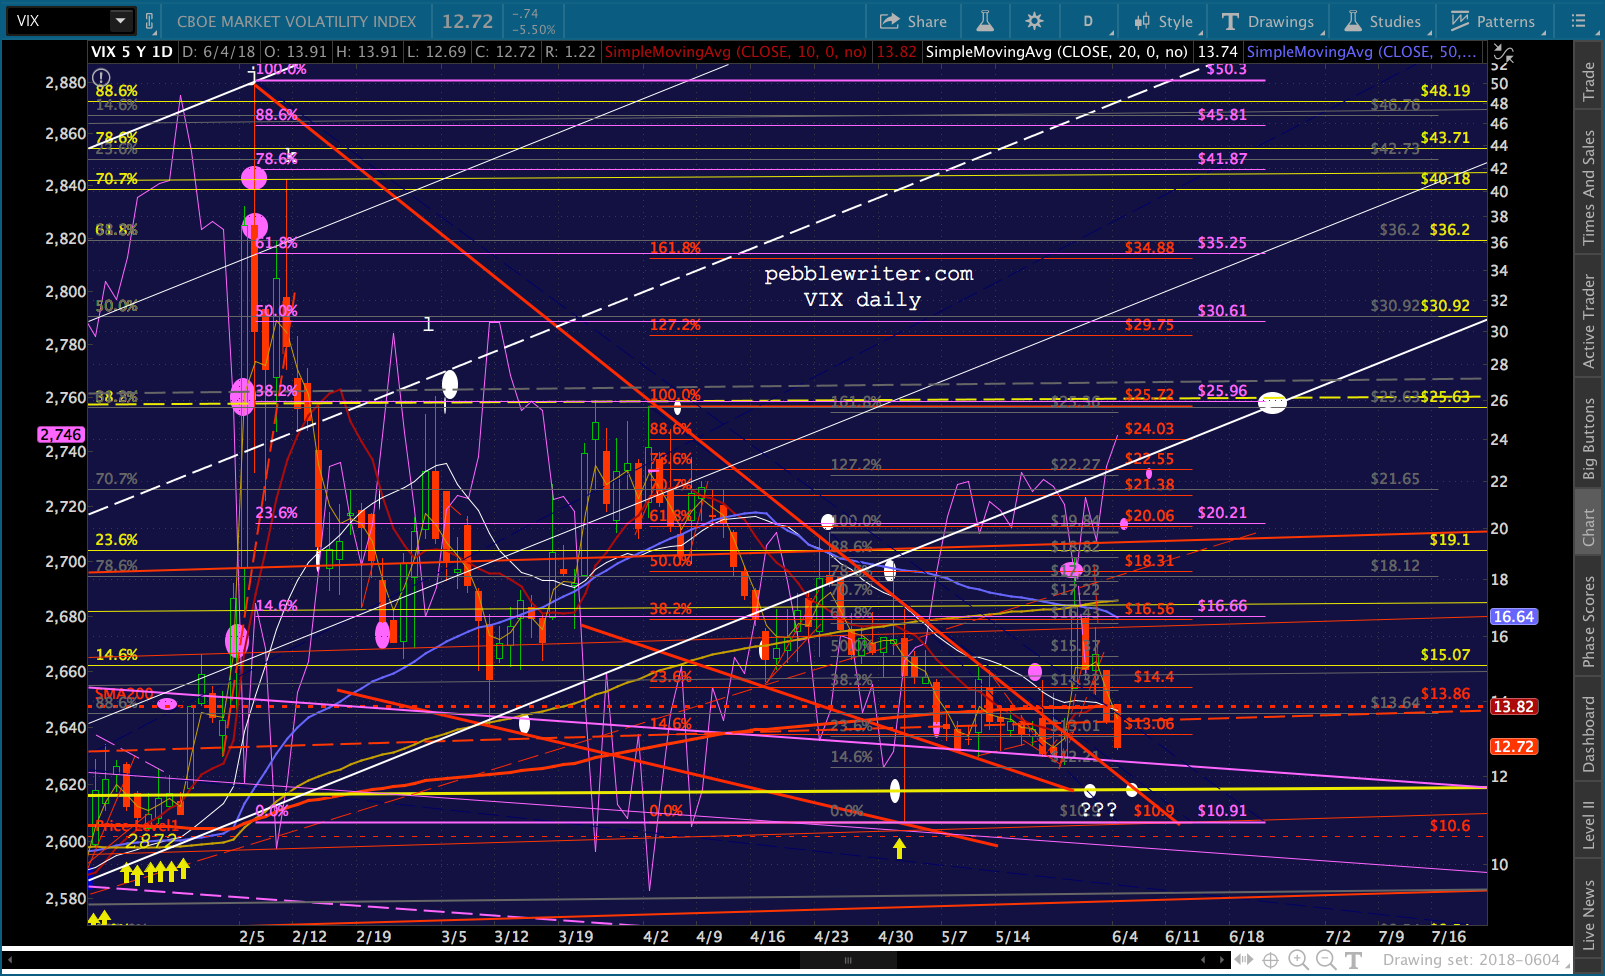 Note that DJI remains “contained”…for now.
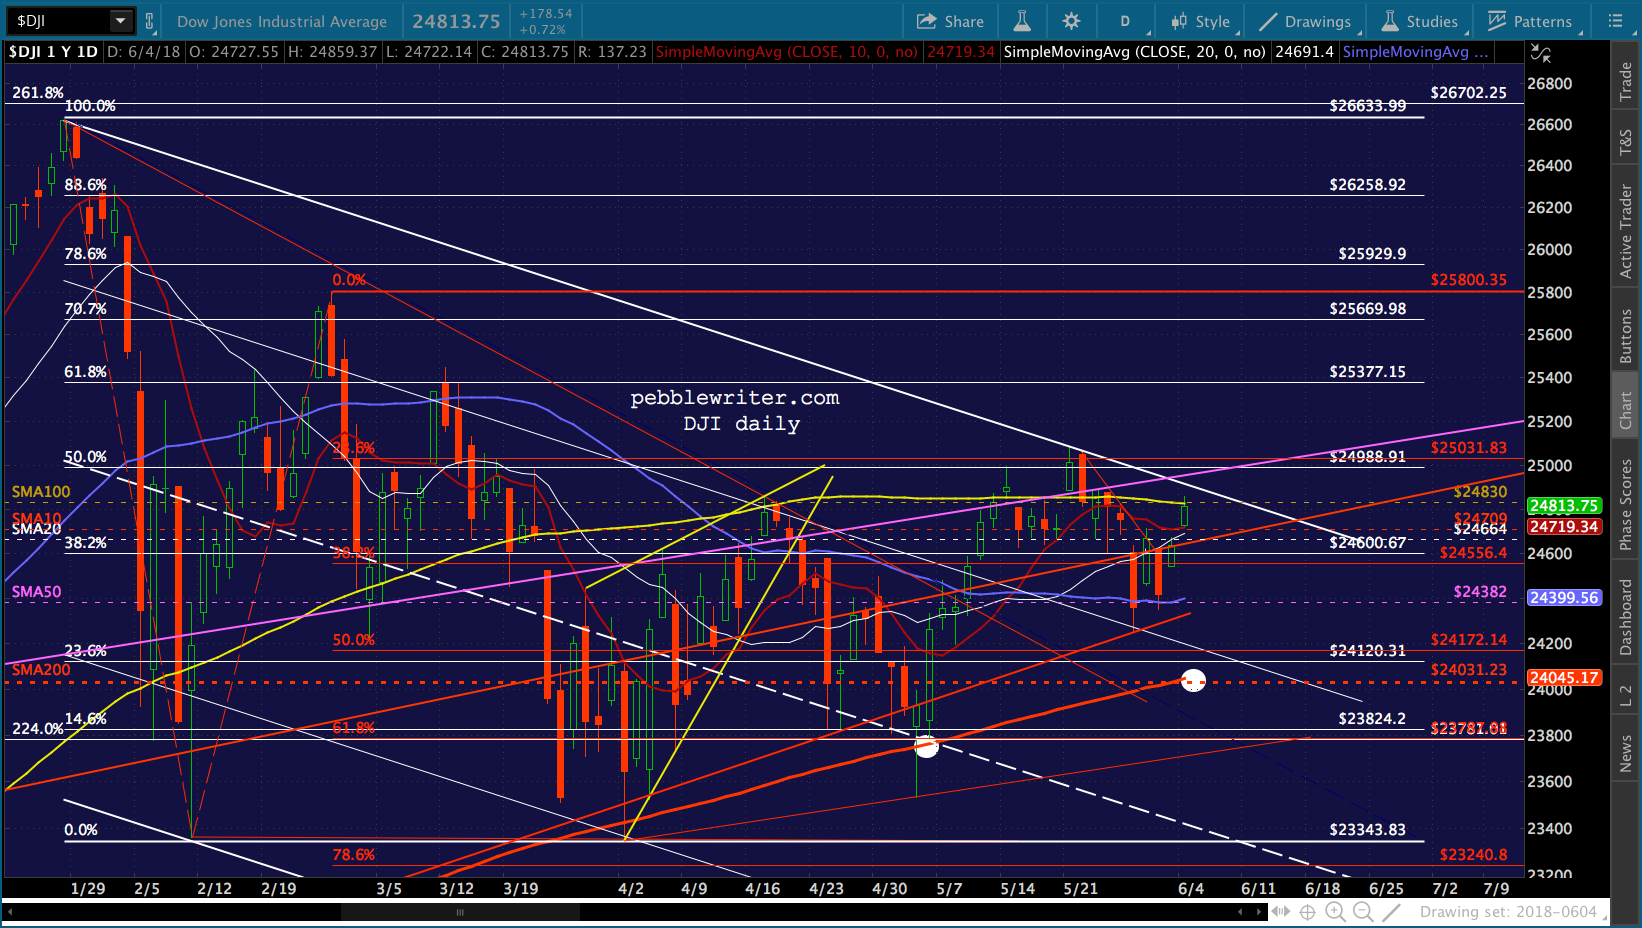 GLTA.
GLTA.