

It’s only been three weeks since our last update on Gold, but I’m getting so many questions about it that it seemed like a good time to opine.
In our last update [see: Aug 8 Update on Gold] I noted that it had reached our 1484.60 target and wouldn’t face overhead resistance until 1560 — which it tagged on Monday, right on schedule.
This is also the top of the rising white channel as it is currently drawn. Does it still have legs? continued for members…
The rising white channel as drawn a few weeks ago was somewhat arbitrary, with the February rally not quite reaching the midline. It fit with a few other dips and pops, though, and made for a nice intersection with the .618 Fib when I expected it to rally based on what I thought would happen with the DXY. The only thing is…GC and DXY have been rallying in unison.
  So, the latest thrust was motivated by something else: market fear as evidenced by the sharp drop in TNX.
 ZN has also reached overhead resistance, but TNX faces no immediate support — being somewhat in freefall lately. ZN’s resistance could put the brakes on, meaning rates would rise and GC would theoretically fall. But, as the chart below shows, I expect ZN’s pullback to be modest — possibly only 3-4%.
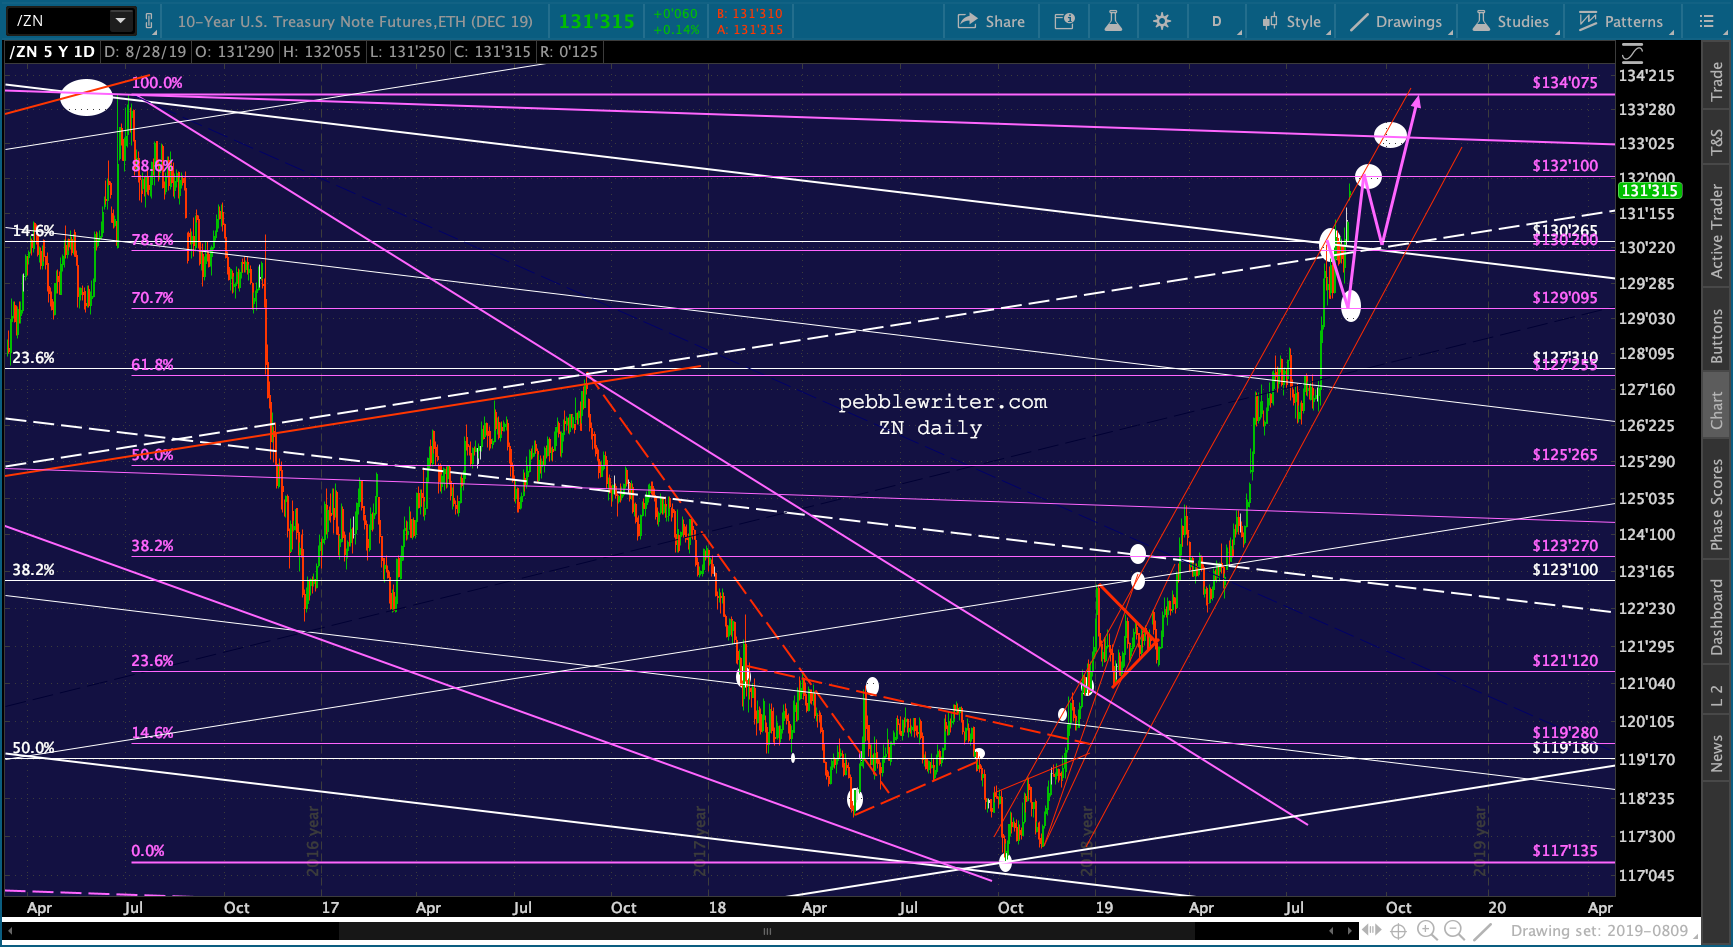 This would make any pullback GC exhibits short-lived, and leave the door open for the IH&S target at 1710 and .786 at 1735. As before, I see nothing wrong with riding along with tight stops.
An important side note…previous peaks and reversals in GC have marked important bottoms in DXY. If we do get a significant pullback in gold, it would indicate a potential pop in DXY and, therefore, stocks. Since our analog is currently calling for a top in the next day or two, I suspect it would be short-lived. Technically, as long as GC remains above the neckline at 1369, 1710 and 1735 remain in play.

GLTA.
Comments
2 responses to “Update on Gold: Aug 28, 2019”
Hi Michael,
Just a question, by saying “a potential pop in DXY and, therefore, stocks” you mean an upward acceleration, just to be sure that I get the message correctly.
The DXY chart looks indeed bullish and could test 99.50.
Kind regards,
Cédric
Yes, that’s what I meant. Major pullbacks in gold often mark important bottoms for DXY which is often net positive for stocks. I don’t necessarily see this as a major pullback just yet, but we’ve obviously had a nice pop in stocks since it reached that channel top. With stocks about to take a tumble, it implies that gold and DXY aren’t quite done. The obvious difference between now and Jun 2015 is interest rates. Given the important upcoming Fed meeting, I’m leery of offering long-term forecasts for gold and DXY — hence the recommendation to use tight trailing stops for those playing the breakout.