

In our last update [see: June 28 Update on Currencies] we noted that EURUSD had broken out and was headed for a backtest of the neckline of a Head & Shoulders Pattern. The breakout seemed significant, as the pair had not only popped out of a channel dating back to Jan 2018 but had spiked above its 200-DMA too — the first time since May 1, 2018.
I anticipate DXY finding support at 95.469, EURUSD finding resistance at 1.1447, and USDJPY testing 105.48.
EURUSD never quite made it to 1.1447; the breakout was a headfake. The pair reversed at 1.1413 and dropped 4% to tag our 1.0988 target earlier today.
 For its part, USDJPY easily dropped to 105.48 and reached the next downside target at 104.74 on Monday, a drop of 3.7% from its Jun 28 highs.
 And, DXY bounced at 95.843 and has since rallied 3.7% as of today.
 These are all fairly sizeable moves for currencies in two months’ time. Needless to say, the political turn of events in the UK has played an important role in the acceleration of EURUSD’s drop. But, it’s safe to say that interest rates and equity volatility have also contributed.
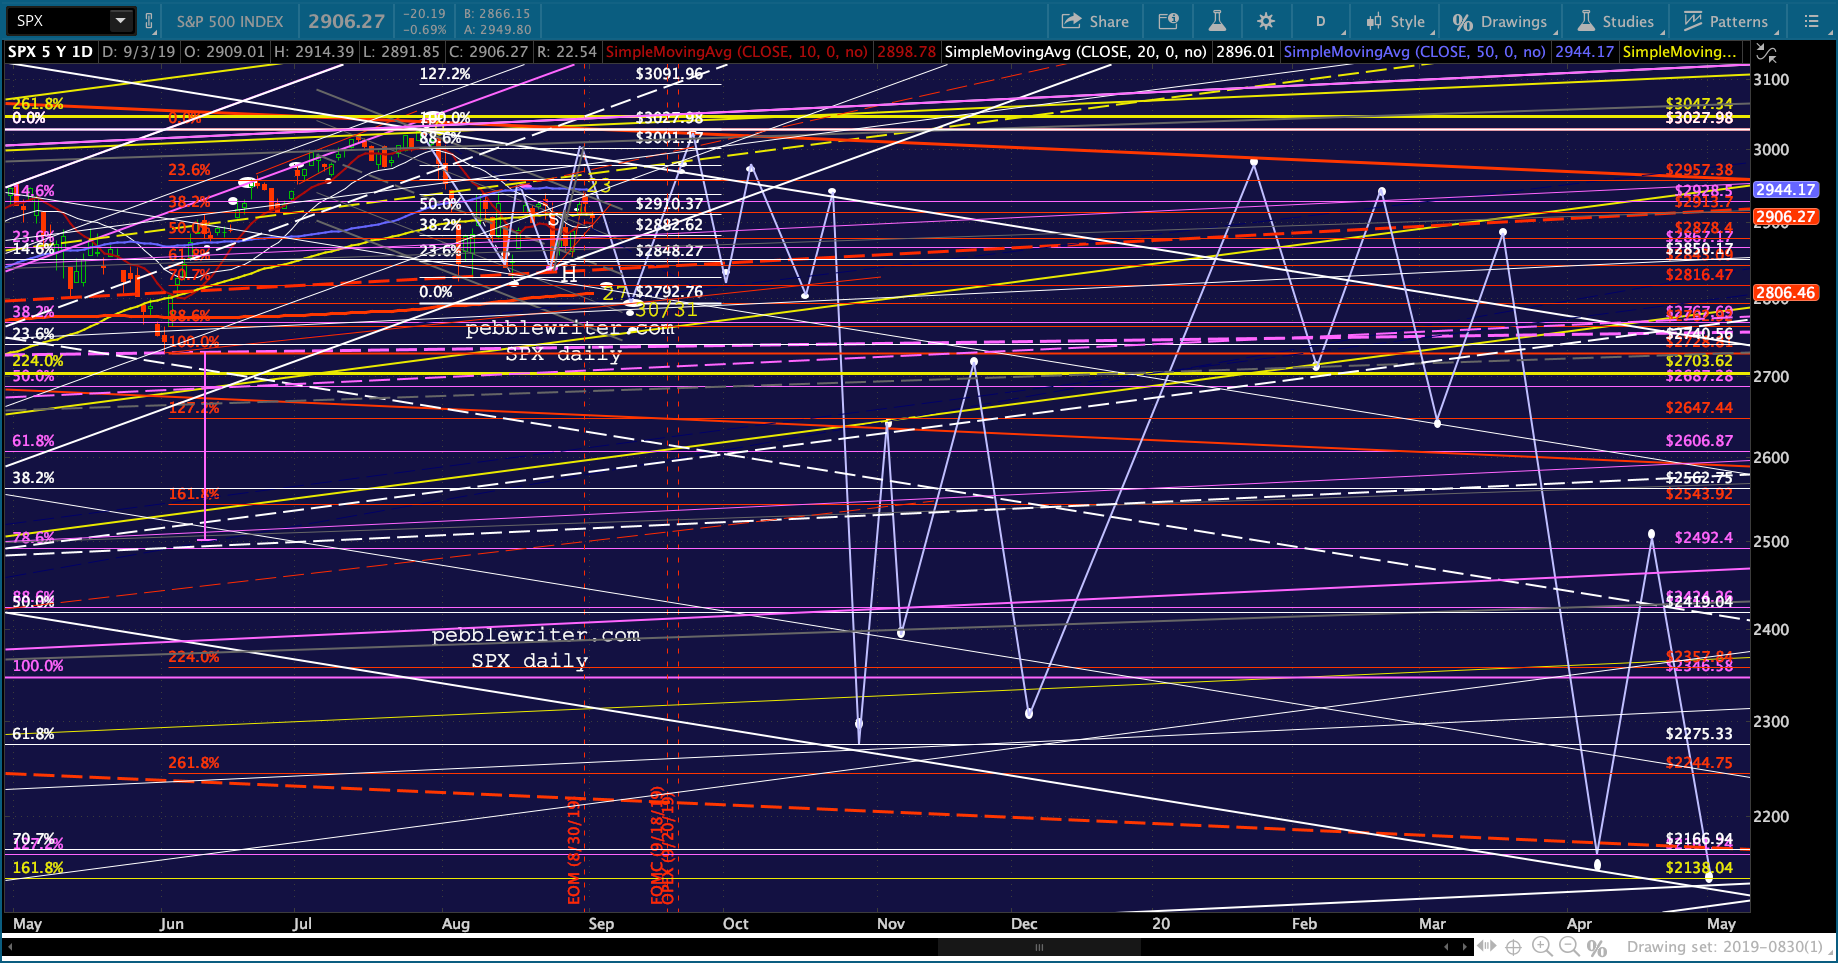
As our analog unfolds, we should see more volatility — an expensive pain in the neck for hedgers but an excellent environment for traders.
continued for members...
Looking back, it seems apparent that EURUSD’s breakout from the falling white channel in July 2017 was to give it a higher perch from which to fall. There was little economic rationale for it — though it fit nicely with the red channel established in the previous years.
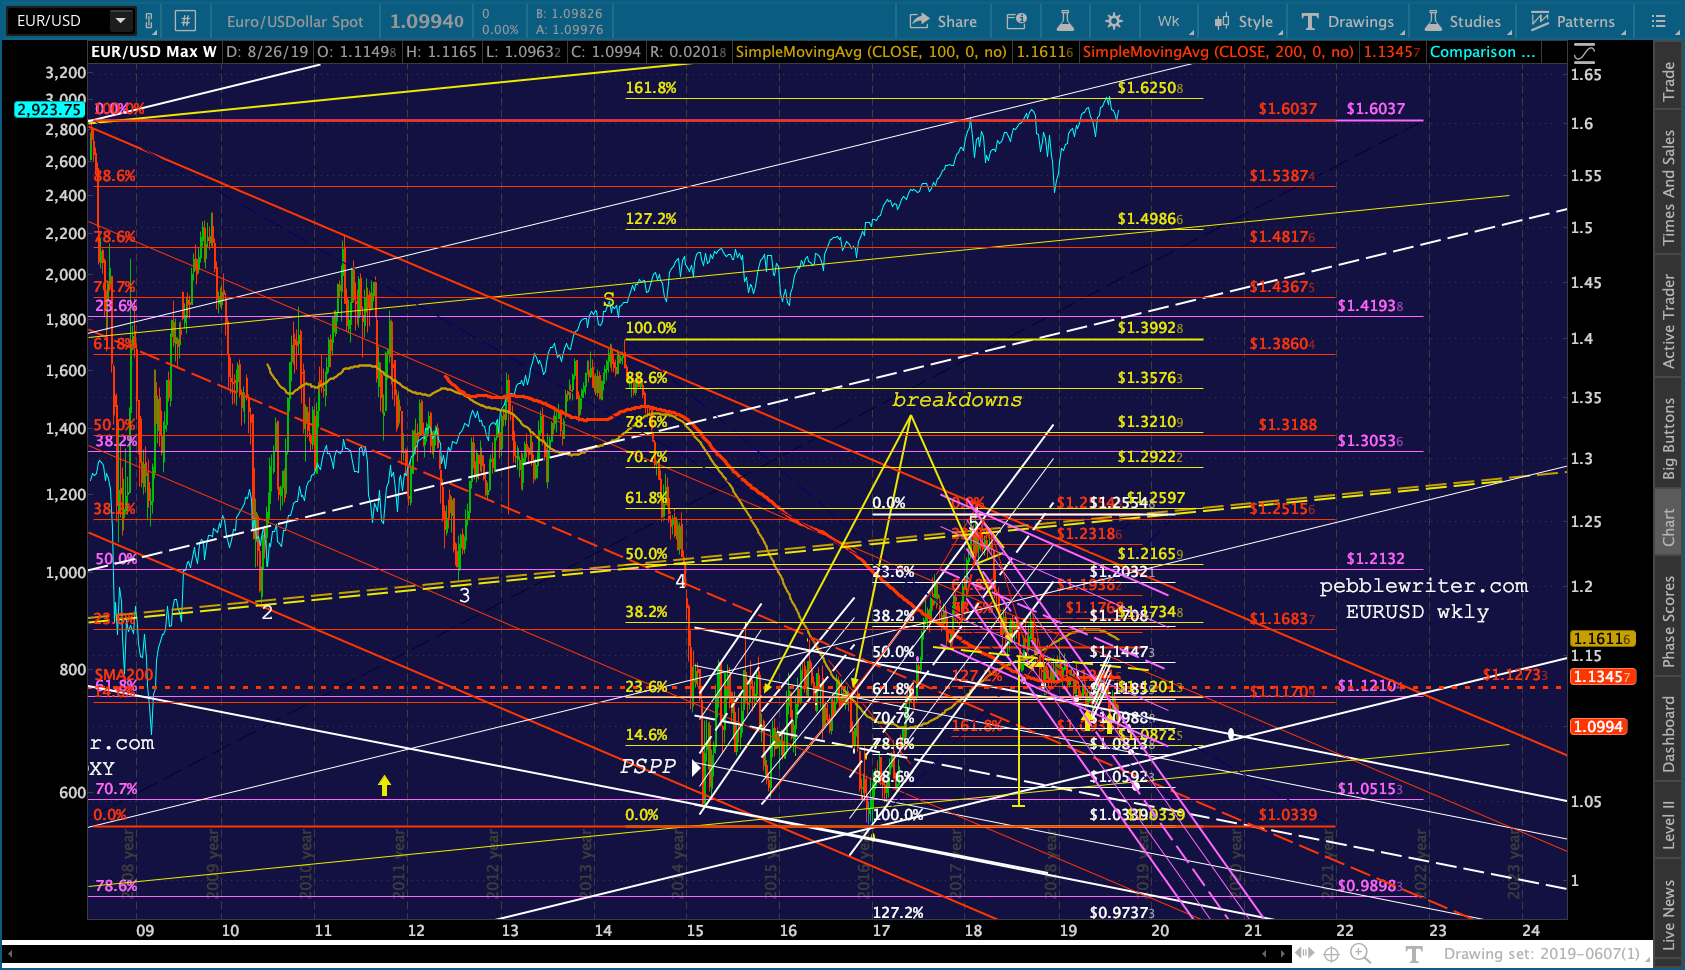 Unlike the two previous breakdowns (the yellow arrows) this latest one has taken a great deal of time to play out. But, with a hard Brexit fast approaching, it’s picking up steam.
Meanwhile, DXY is threatening to break out.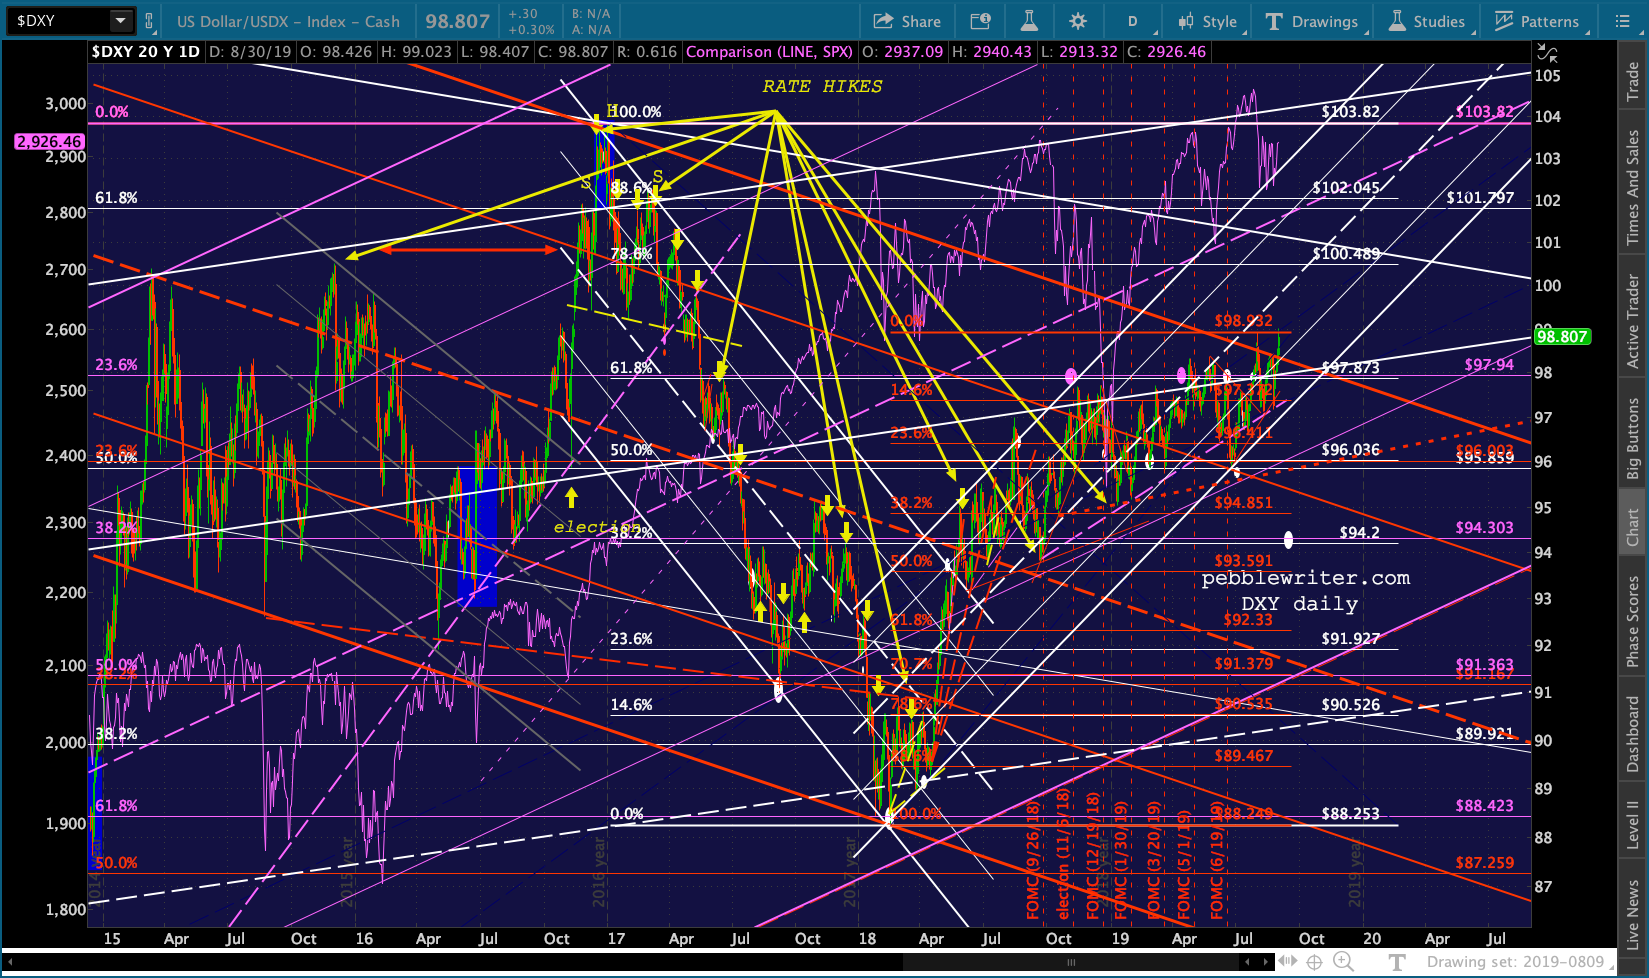 And, USDJPY continues to hang by a thread.
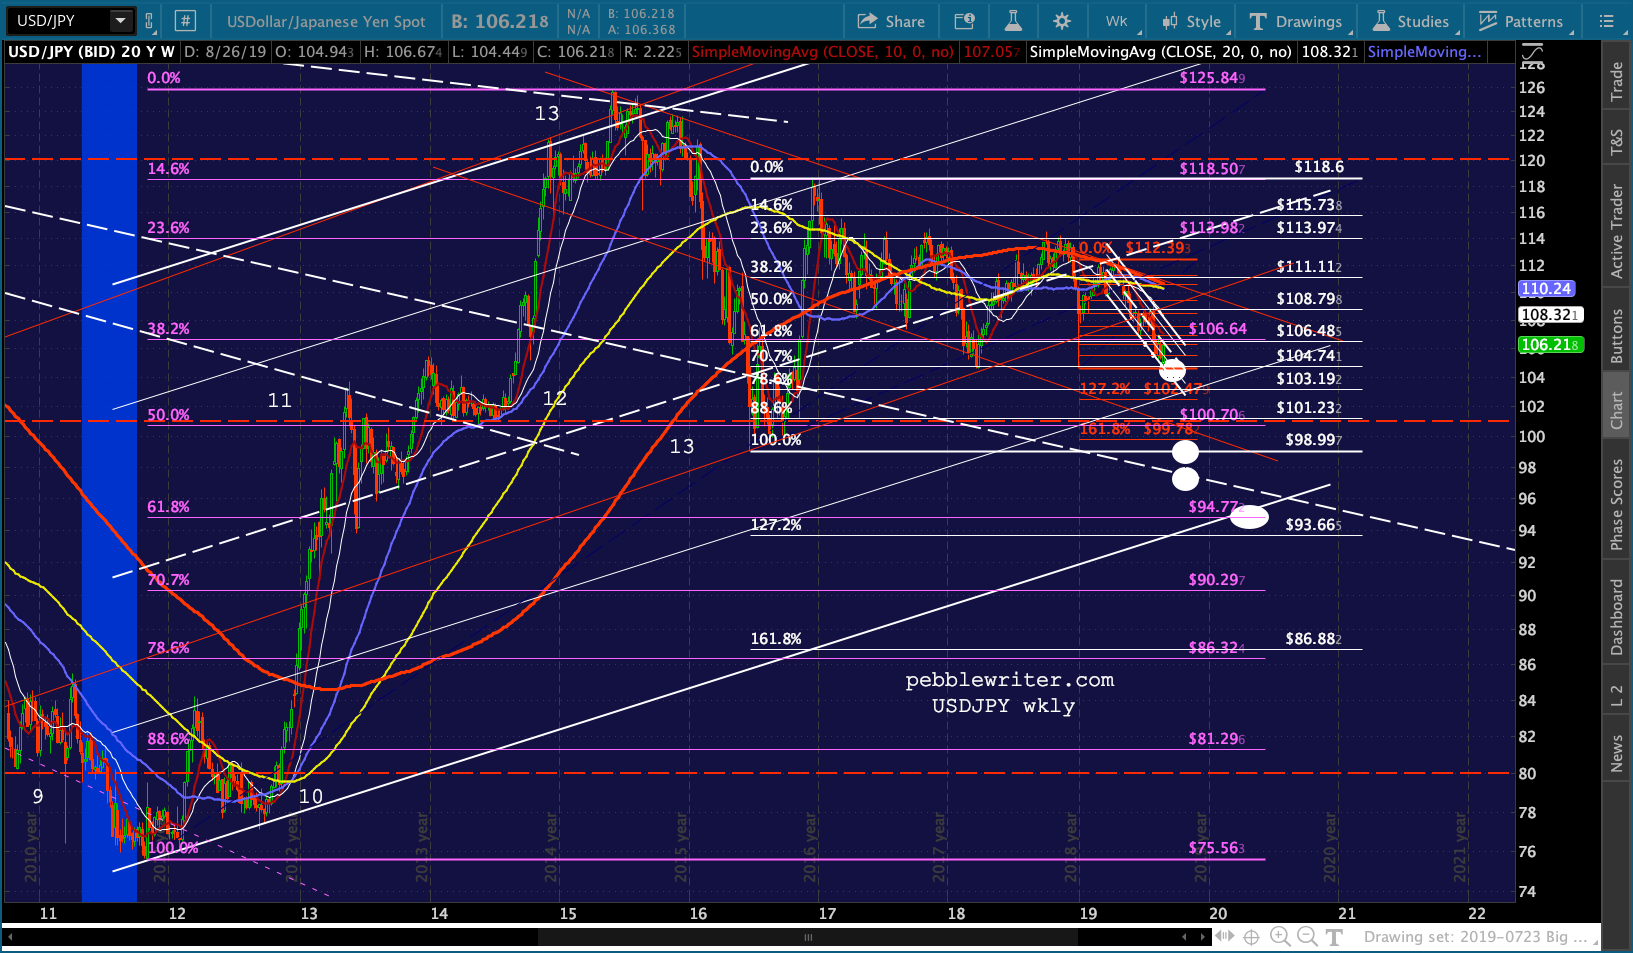 Continued on Sep 3:
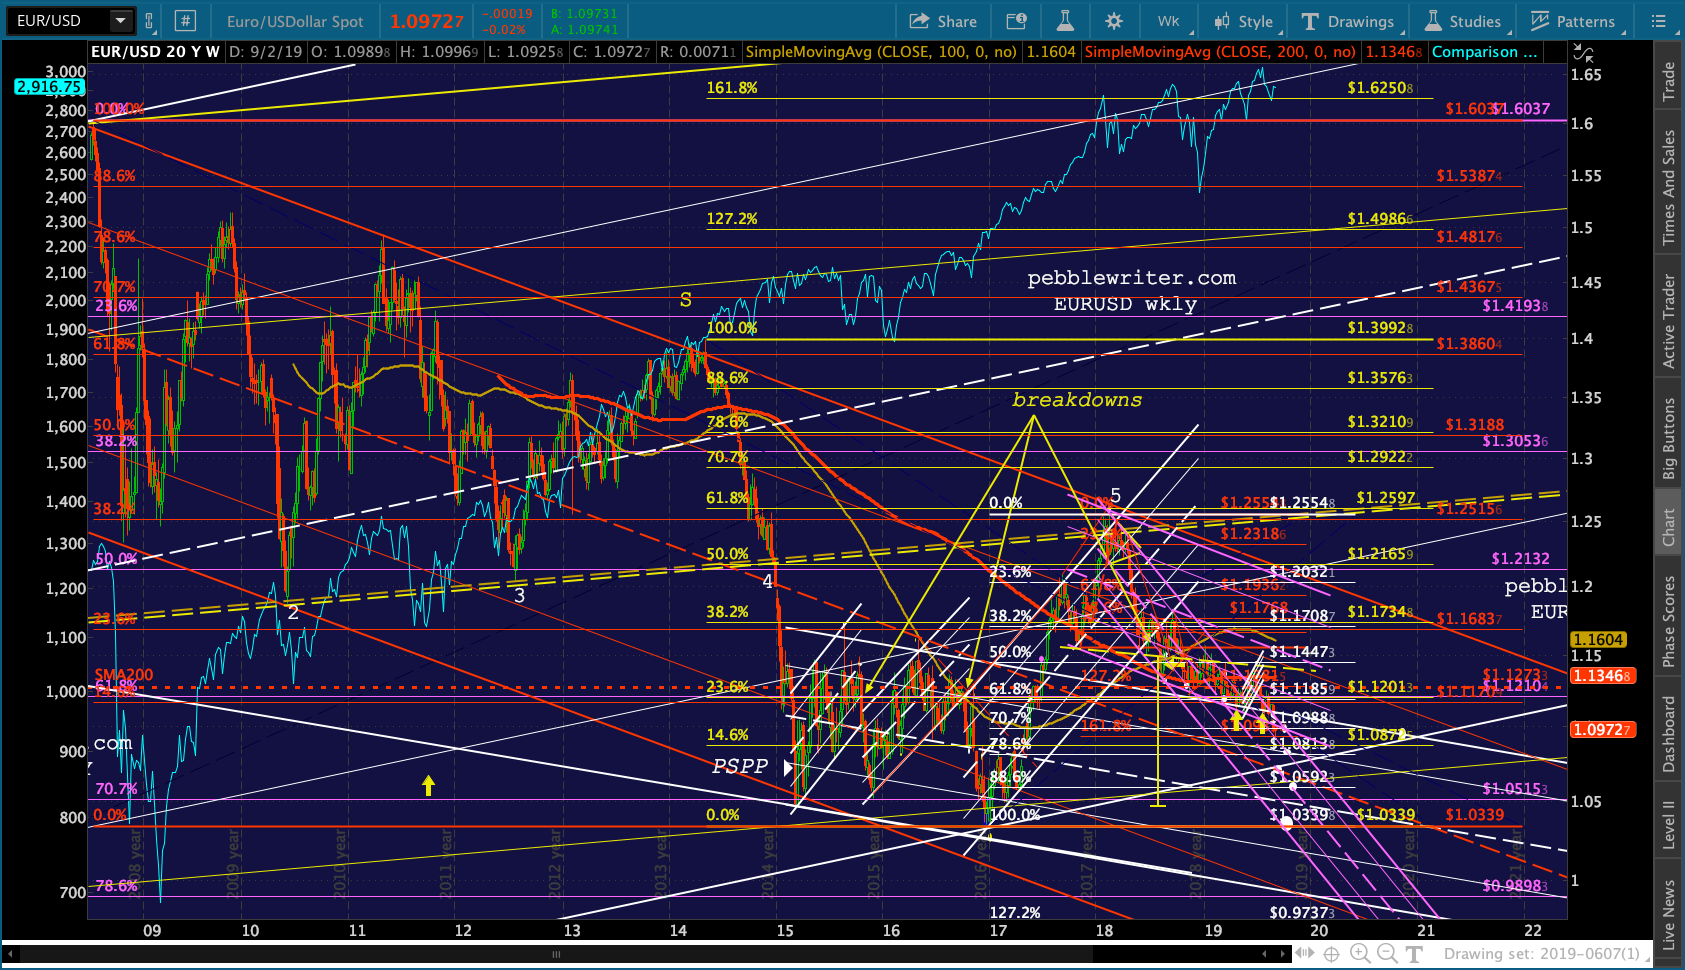
DXY not only threatened to break out…it did break out. Let’s review the major channels in play:
The large falling white channel from 2001 halted DXY’s rise in Jan 2017…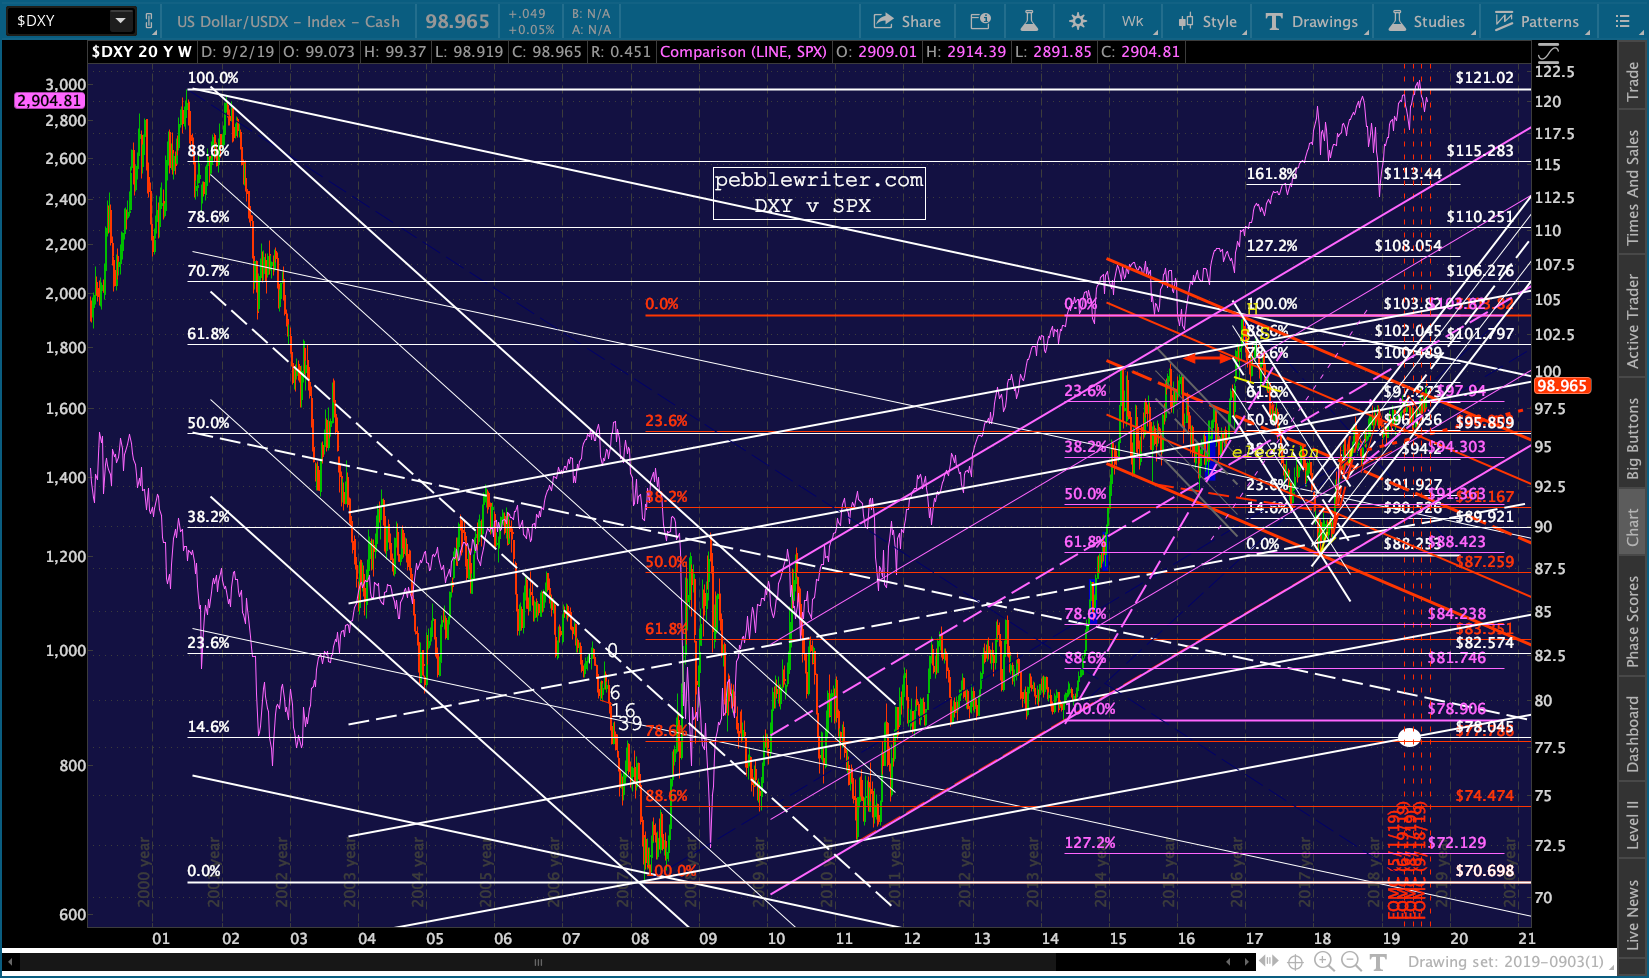 …but only after it broke out (the highlighted rectangle below) of the rising white channel…
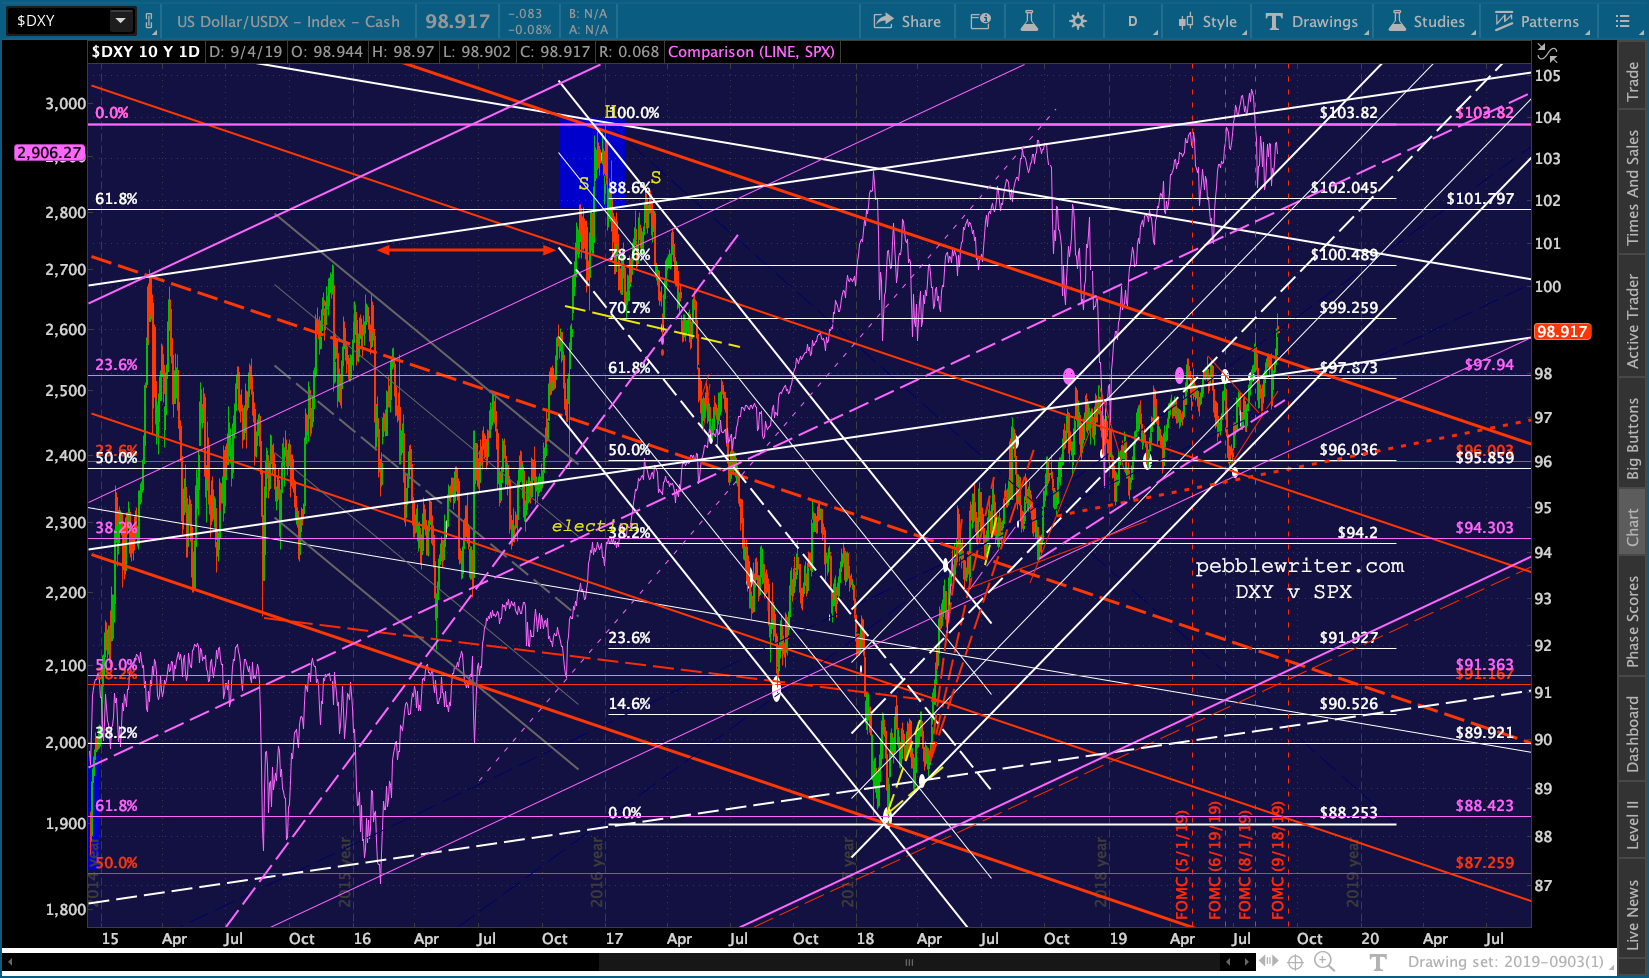 …in order to help SPX recover from its post-election, USDJPY impacted plunge. As the chart below shows, USDJPY had broken down below (a) a TL from its 1998 highs, (b) the midline of its rising white channel from 2011, and (c) the horizontal support connecting the lows at Points 1, 3, 5, etc.
 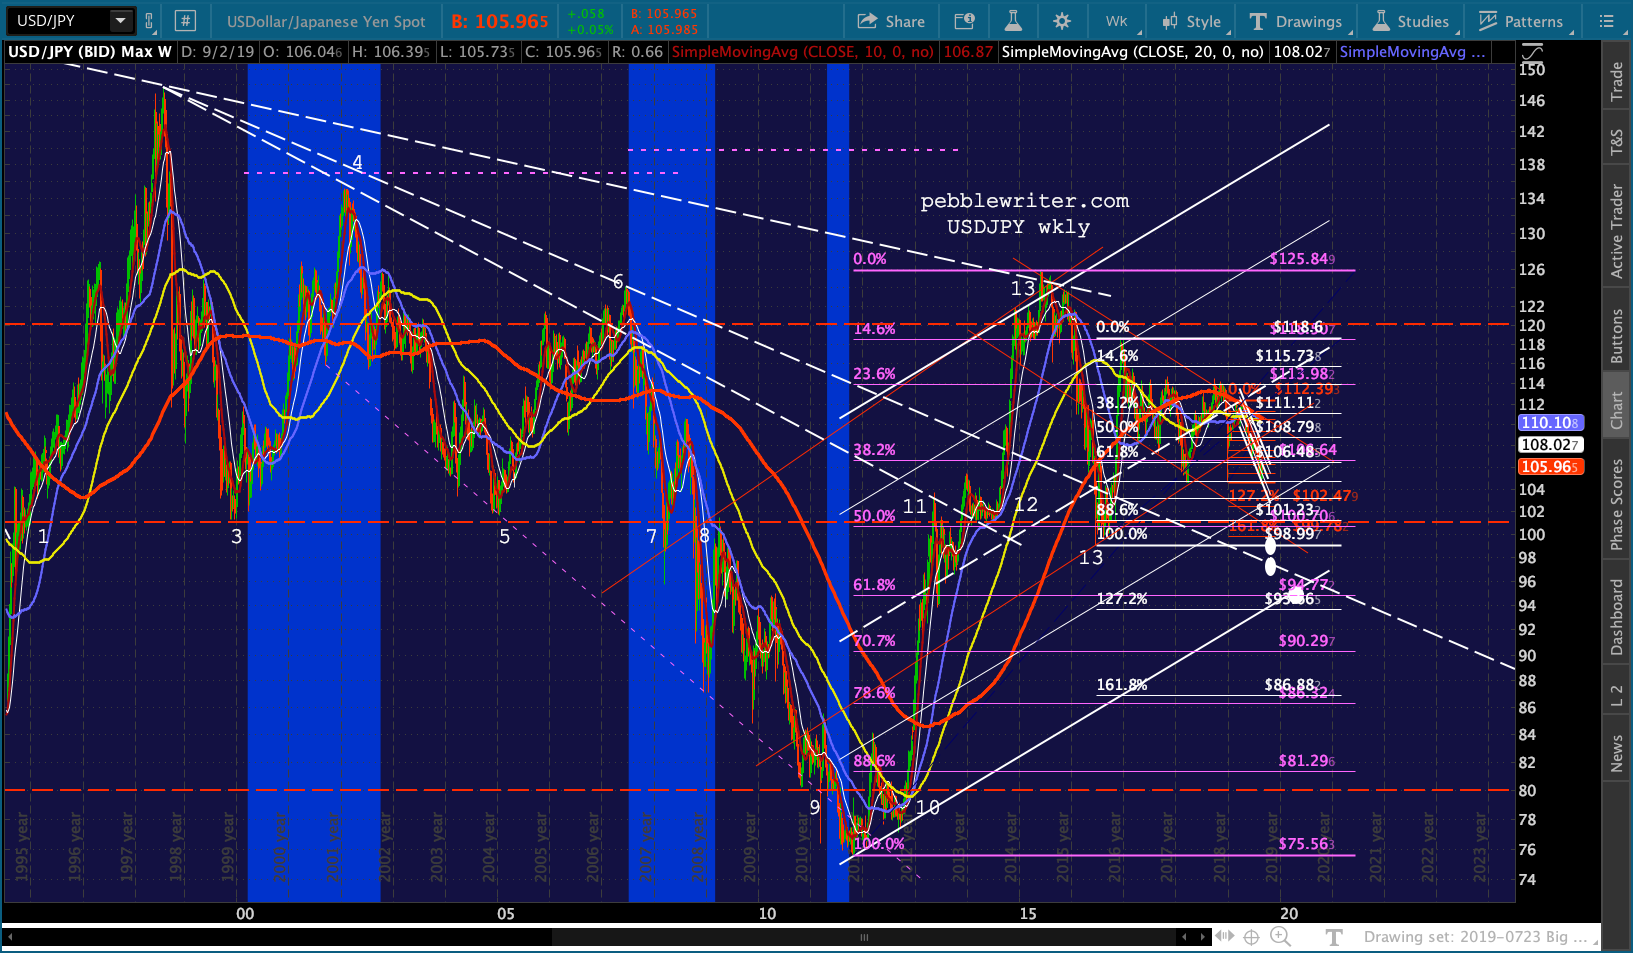 A close-up shows that Point 13 was an important backtest that temporarily broke down between June and November 2016, culminating in the Nov spike in order to save stocks from the election eve plunge.
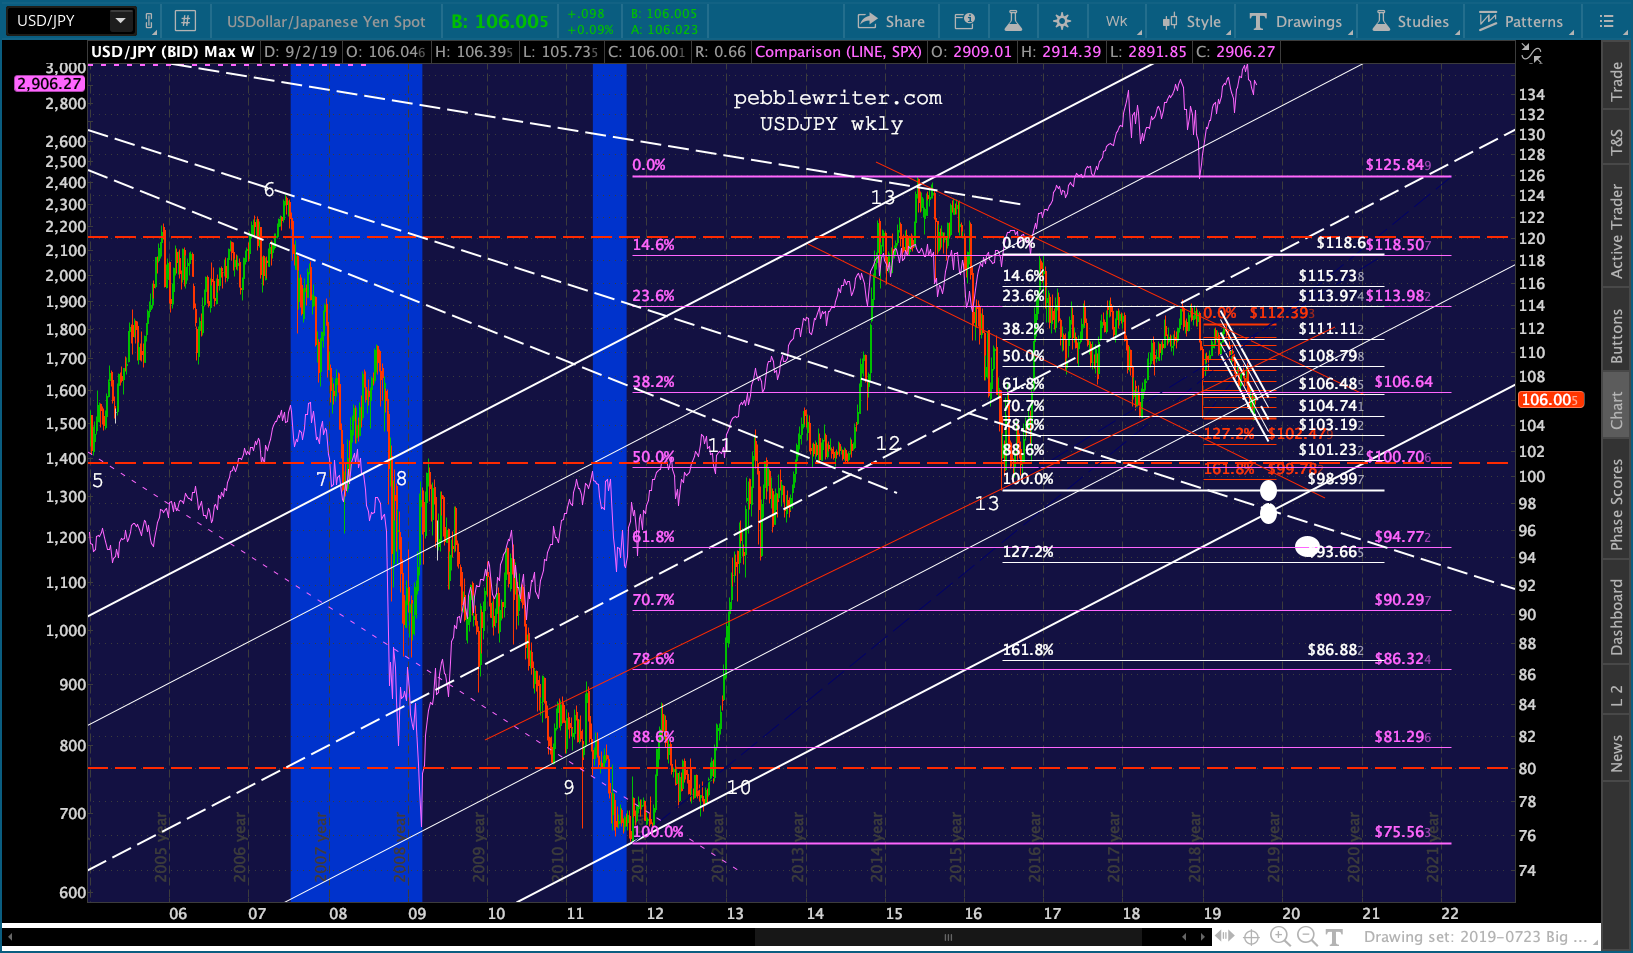 USDJPY’s test of the 101ish support was followed by three additional tests of a higher line of support at 104.74ish — with Points 14 and 15 corresponding to major dips (340 and 454 points) in SPX.
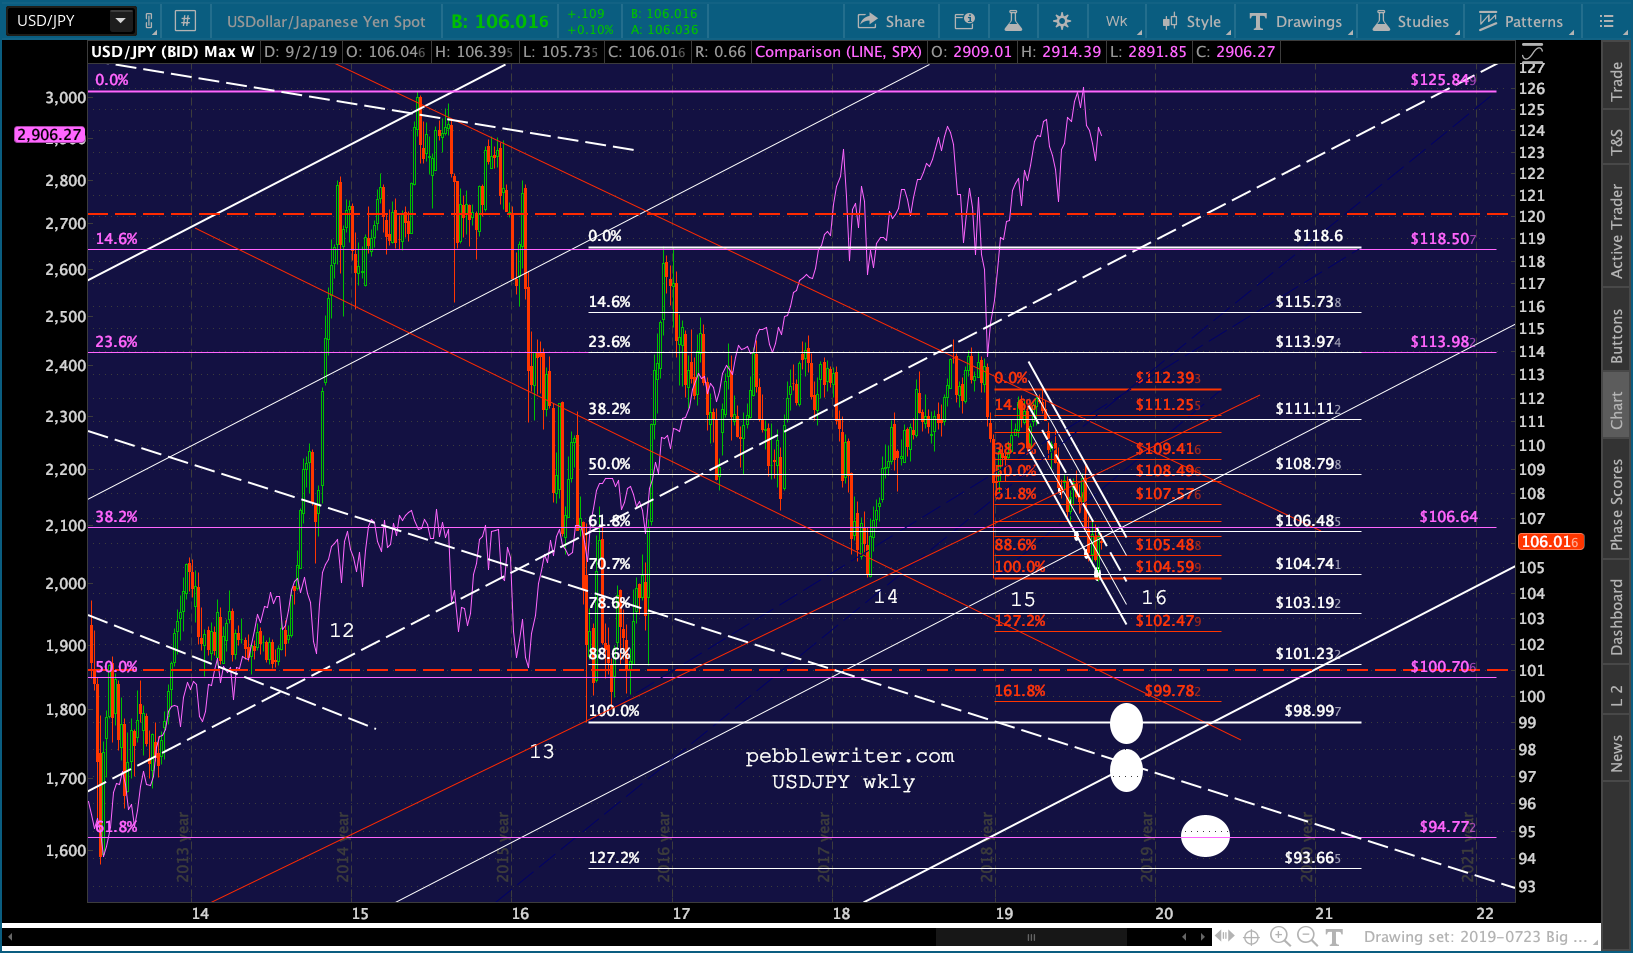 Point 16 has produced only a 200-pt drop so far. But, if our analog continues to play out, there’s a very good chance that the 101 support will be tested and, potentially, break down — yielding a test of the white channel bottom, the white, dashed TL, or the .618 Fib at 94.77. All three are legit targets in their own right and would match up nicely with 600-700 point drops in October 2019 and/or April 2020.
 One big difference between those past plunges and the current one, of course, is the extent of EURUSD’s latest breakdown. It started from a much higher point and is just now gathering steam as the next Brexit deadline approaches.
We have no shortage of downside targets including my favorite short-term target: the rising white channel bottom where it intersects with the falling red channel midline around 1.0724ish. If that should fail, we have the white .886 at 1.0592 and the previous low at 1.0339.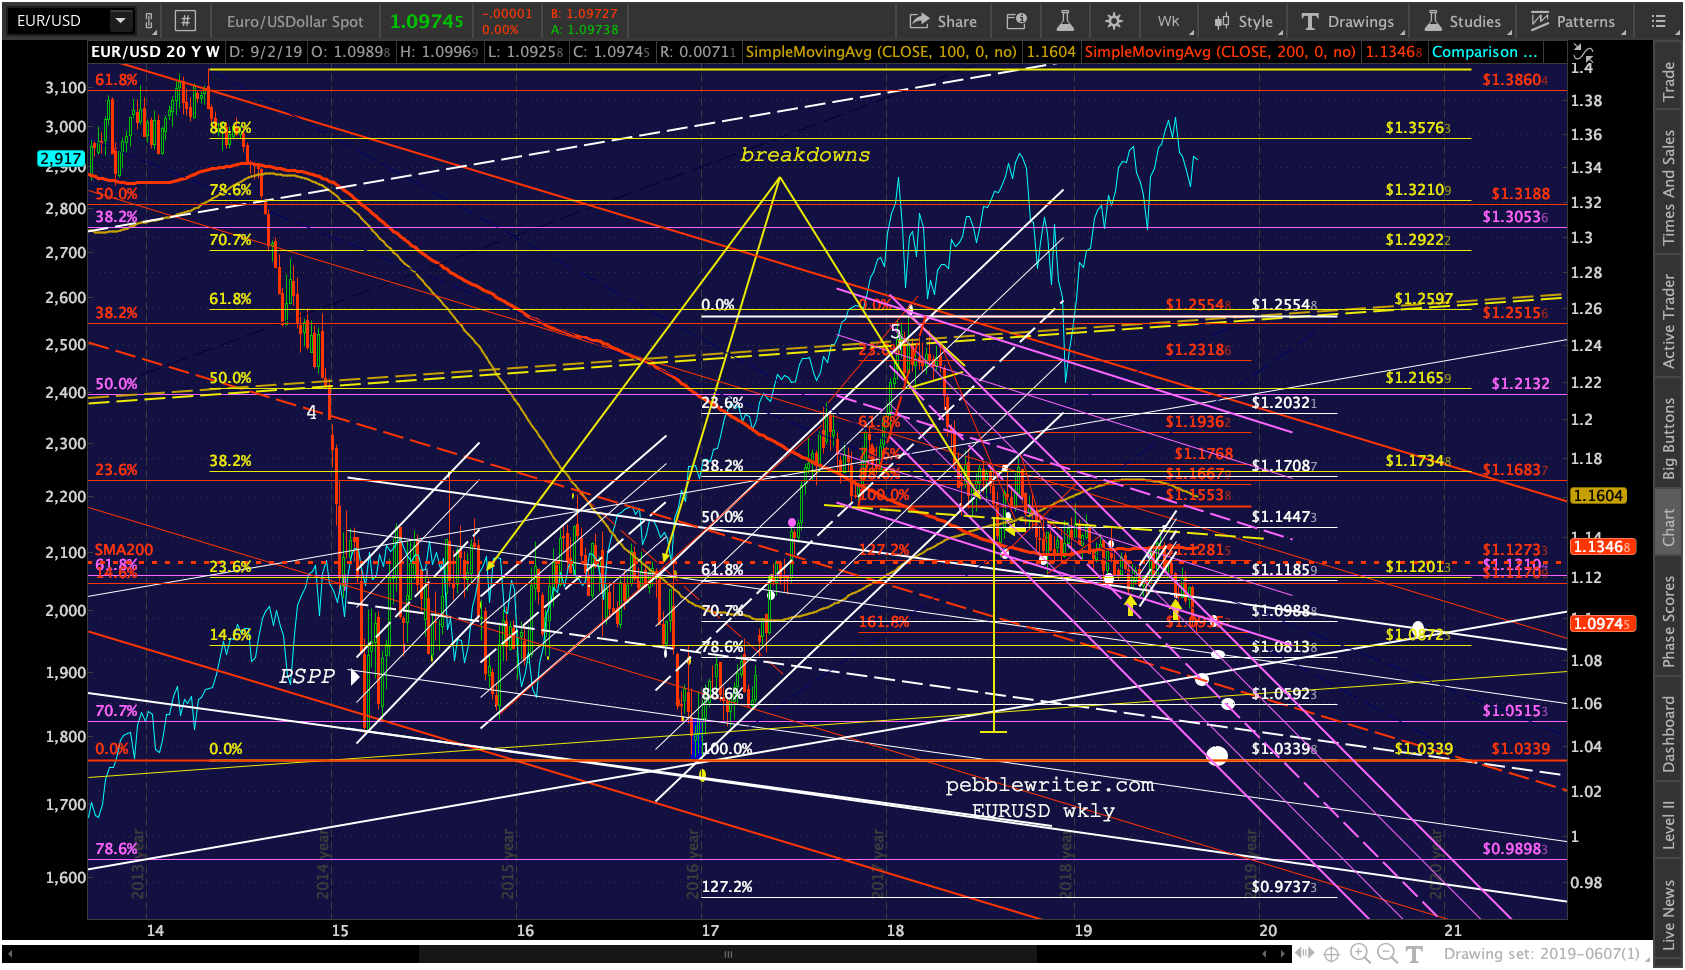
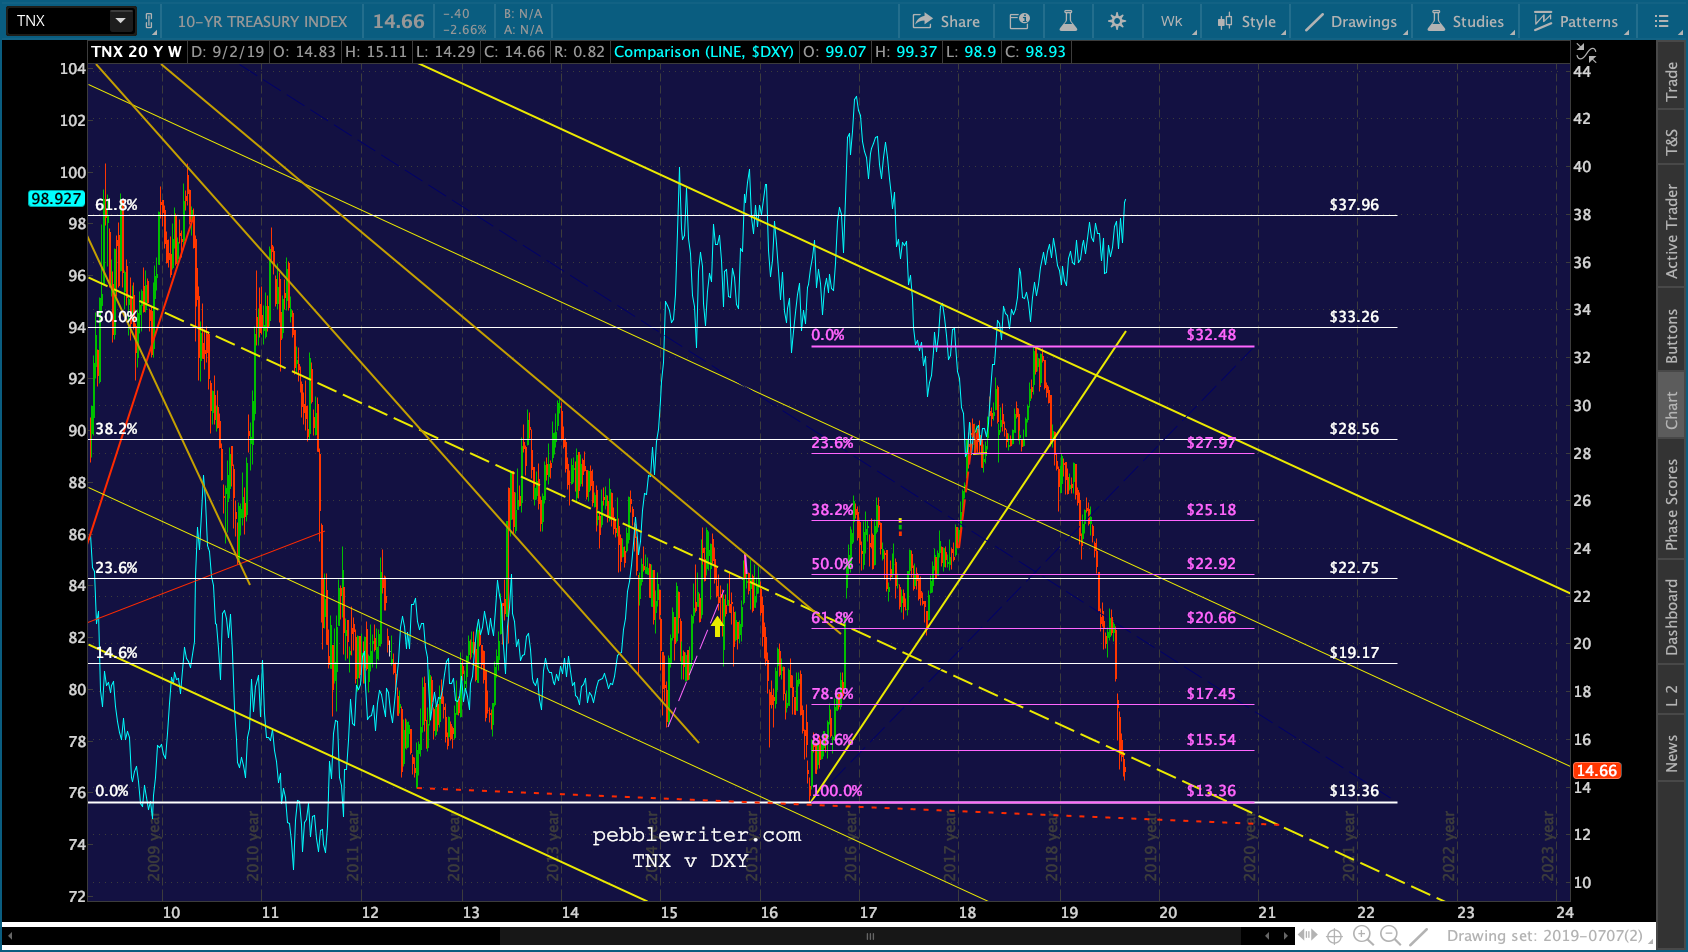
The other big difference is in the interest rate environment. With 17 trillion in negative interest rate bonds out there, US bonds are suddenly very appealing. 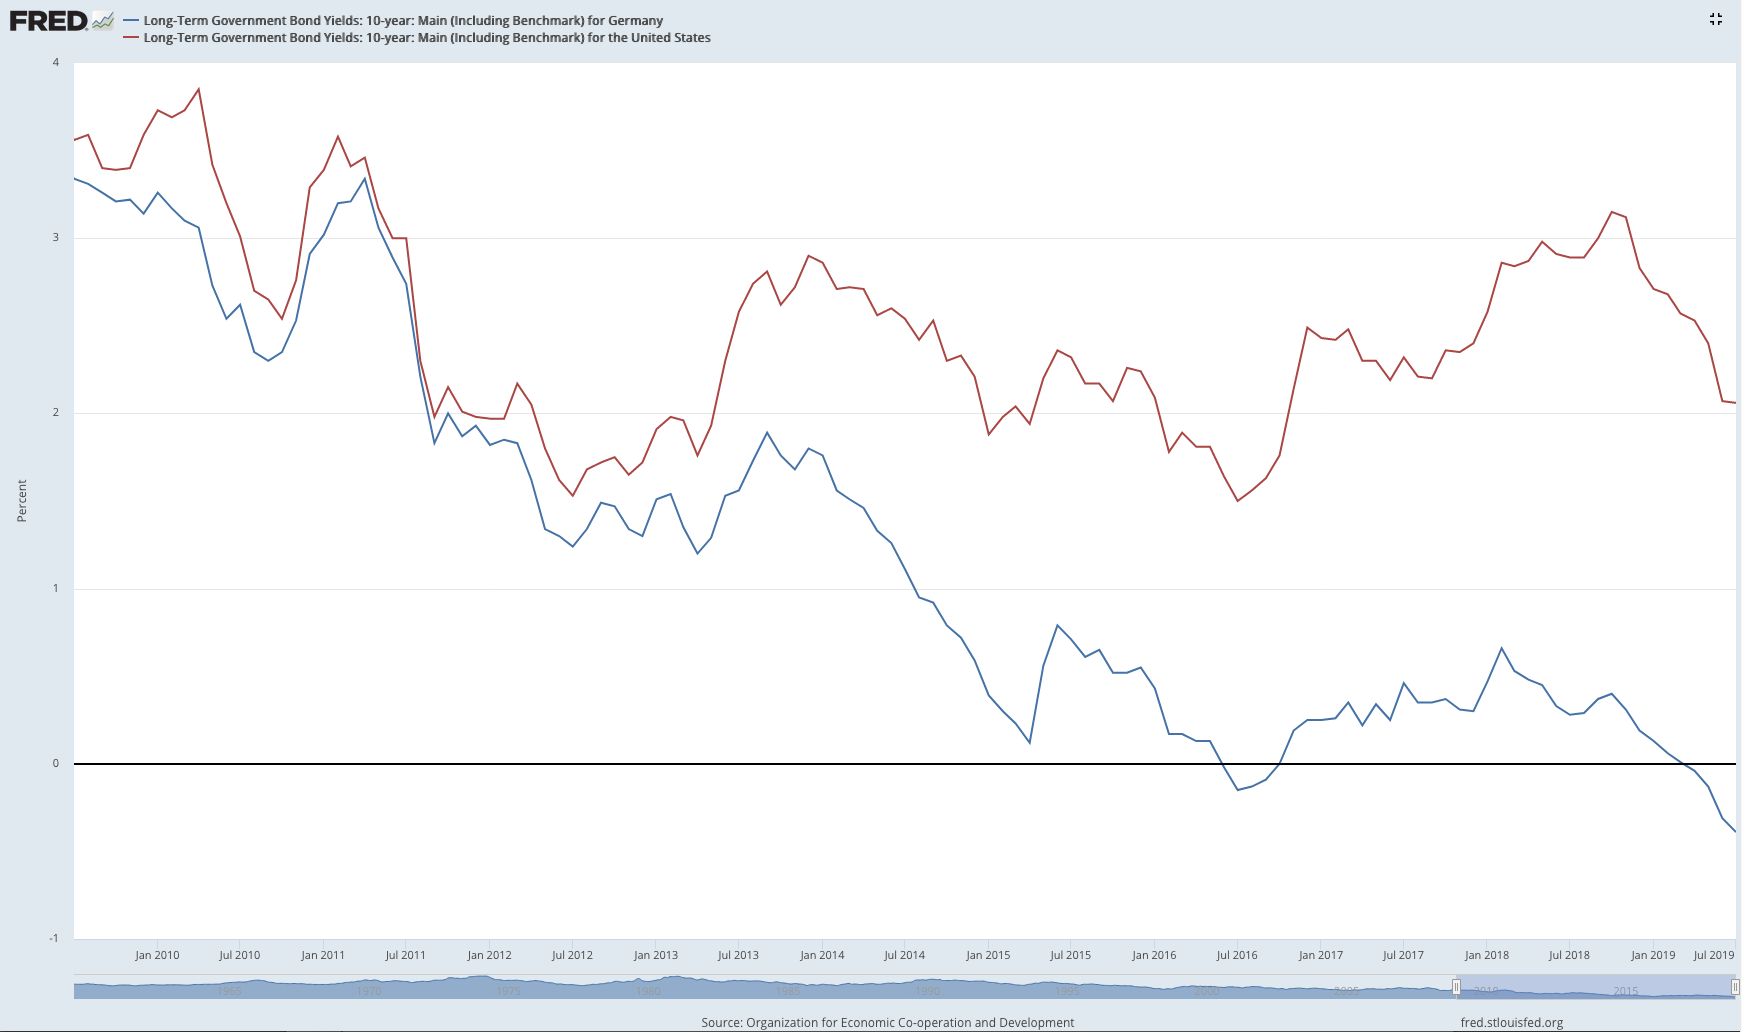 The flow alone has been quite supportive of the USD and seems unlikely to reverse any time soon with TNX due to make new lows and ZN new highs.
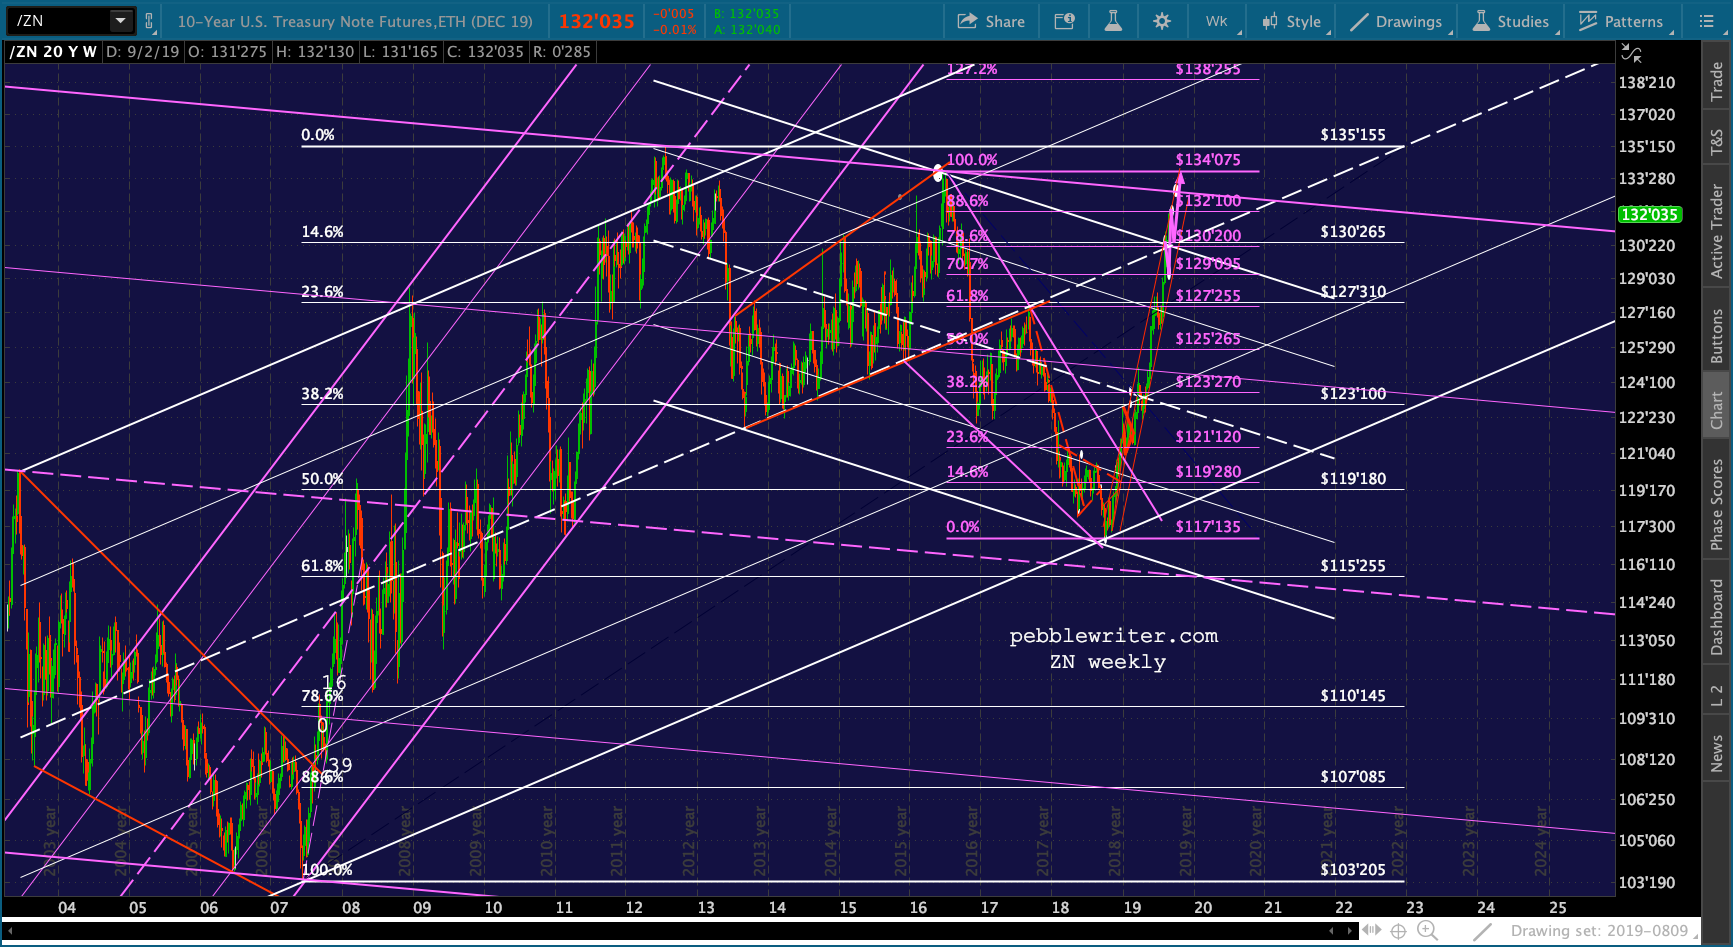
 I’ll revisit this post often in the coming days. If DXY breaks out of its falling white channel or to new highs, we could see inflation plunge to levels which practically guarantee ZIRP or negative rates in the US.