

All in all, it’s been a pretty good first month for our analog. Rallies have generally fallen short of projections, but declines have more than compensated.
The initial drop was faster and farther than expected, which was somewhat unnerving and threatened to wreak havoc with the timeline. But, we’re back on track thanks to last Friday’s stunning (just-in-time) 87-pt plunge.  Overnight gaps have been quite common, making the analog that much more beneficial. Being able to anticipate turning points in advance presents excellent trading opportunities — as evidenced by this morning’s nice gap lower after Friday’s feeble attempt at higher highs.
It’s worth reiterating that we’re very early in what should be a 9-month process. If it’s anything like the 2011 analog, the correlation will strengthen over time.
 We’ve had one 7% move and five 4% moves in the first month. Though it has seemed volatile enough, volatility will continue to increase. Over the next month, we should see three swings of over 7% and one of about 23% (in addition to the garden variety 5% swings.)
Buckle up!
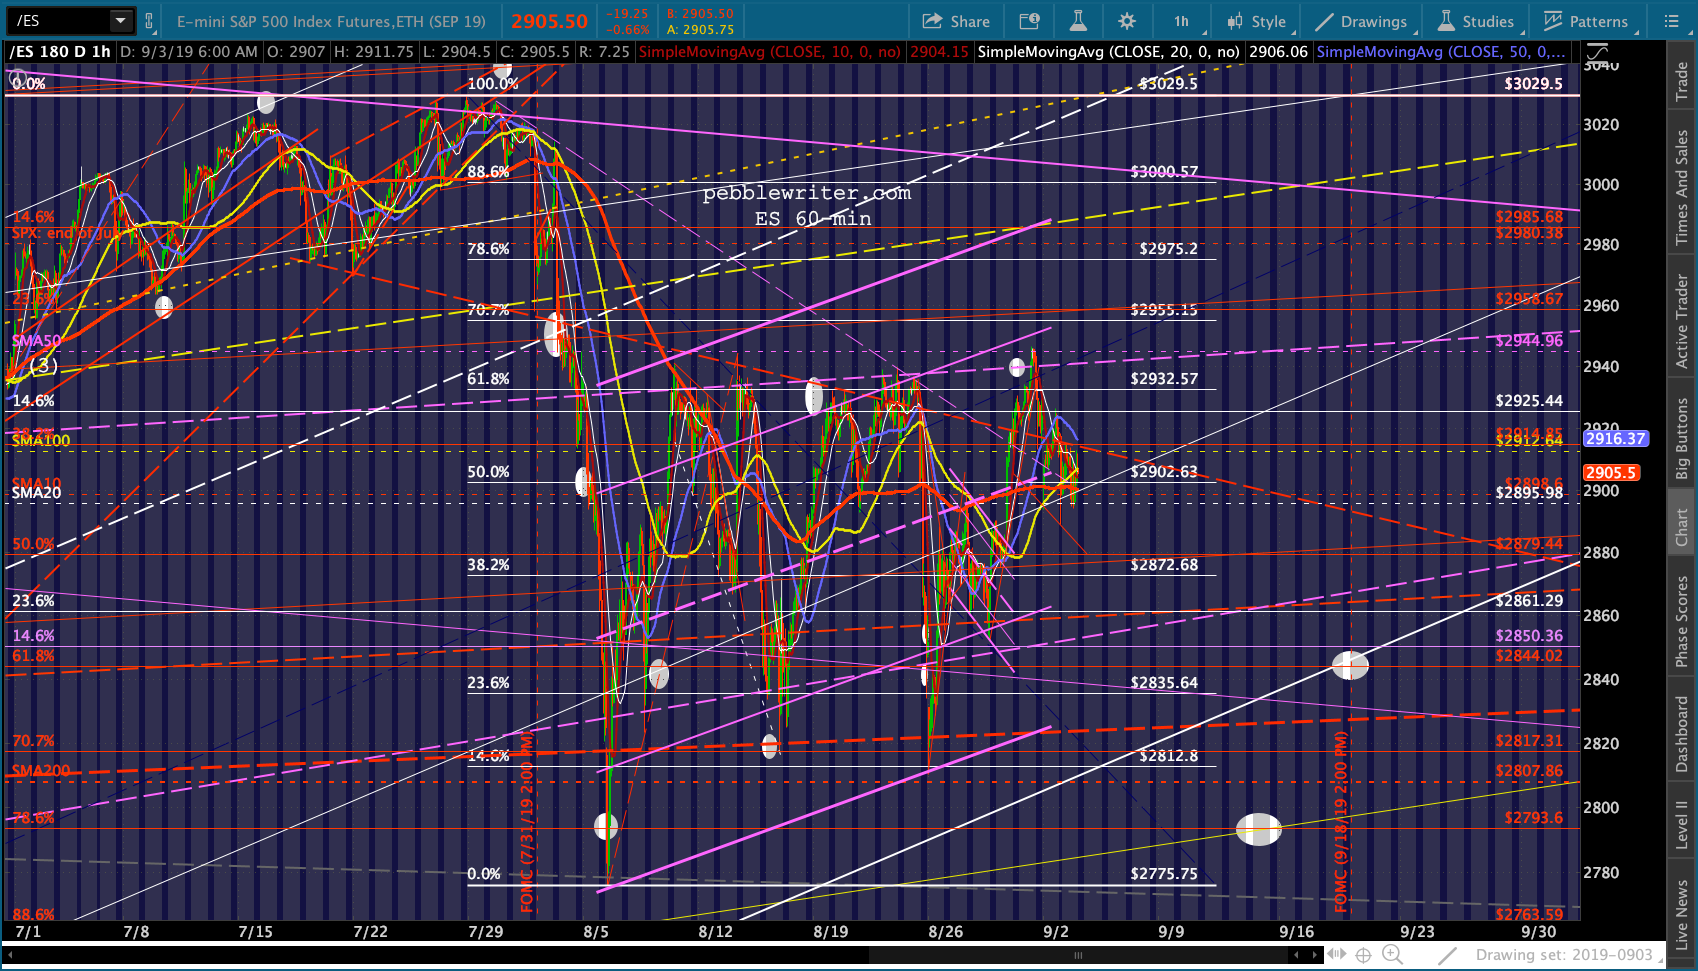
continued for members…ES internal red trend line continues to play an important role, with this morning’s bounce off the SMA10/20 failing there.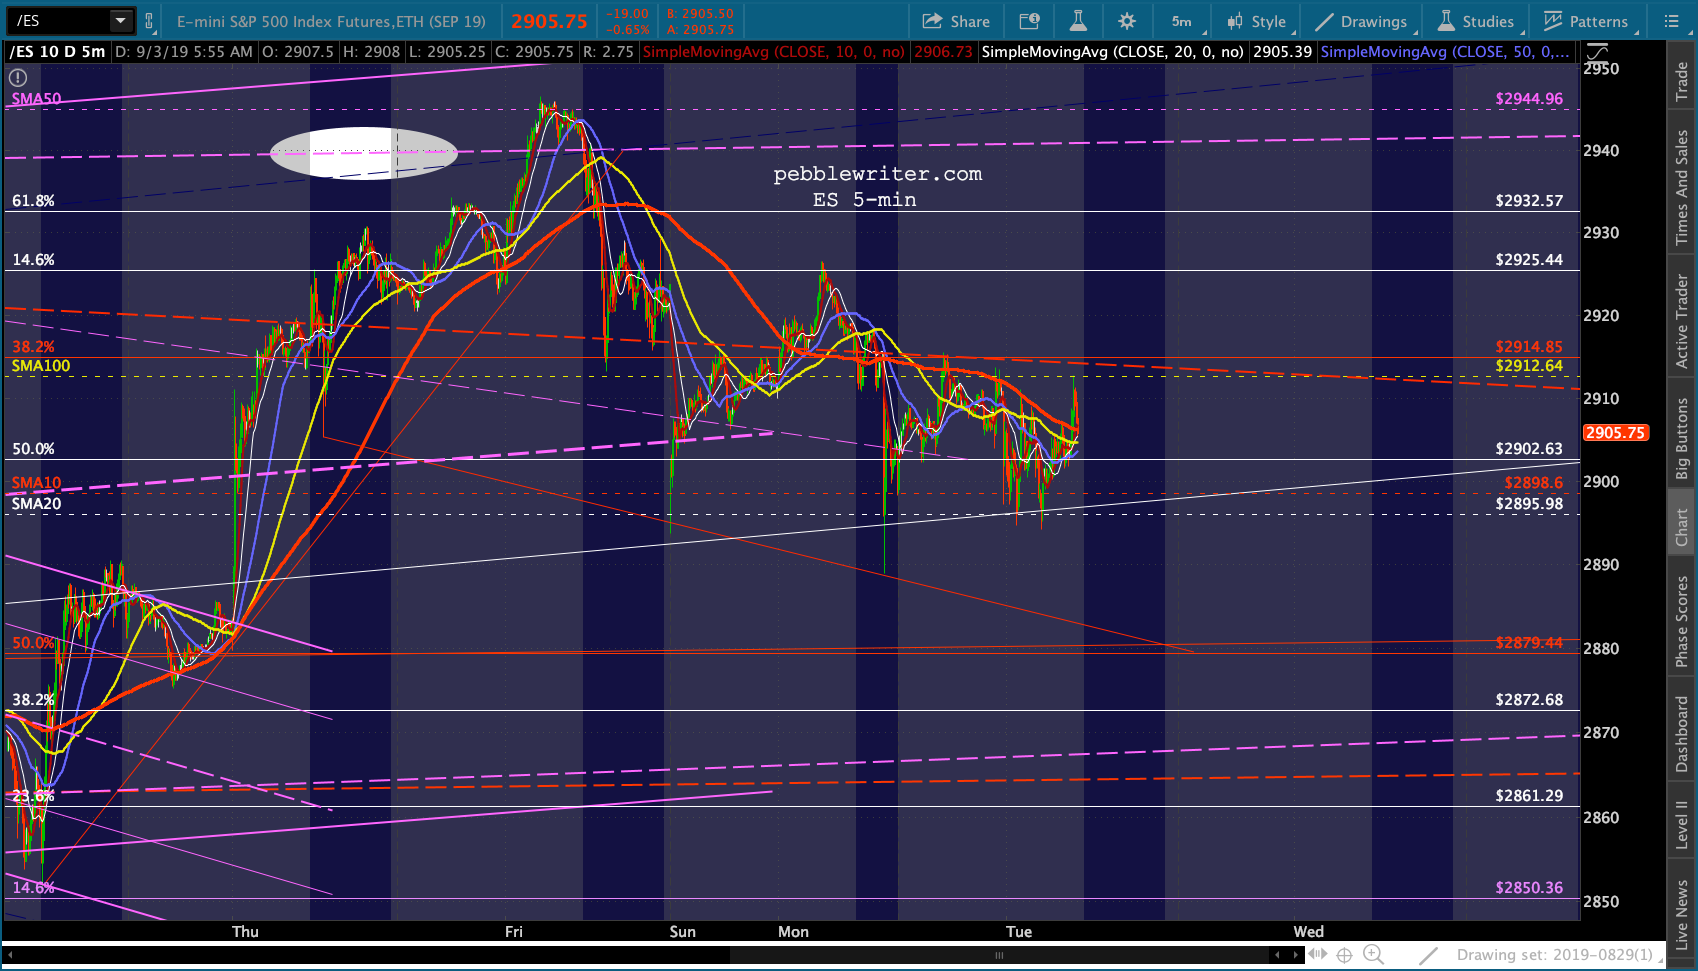 It’s easier to see on the 60-min chart.
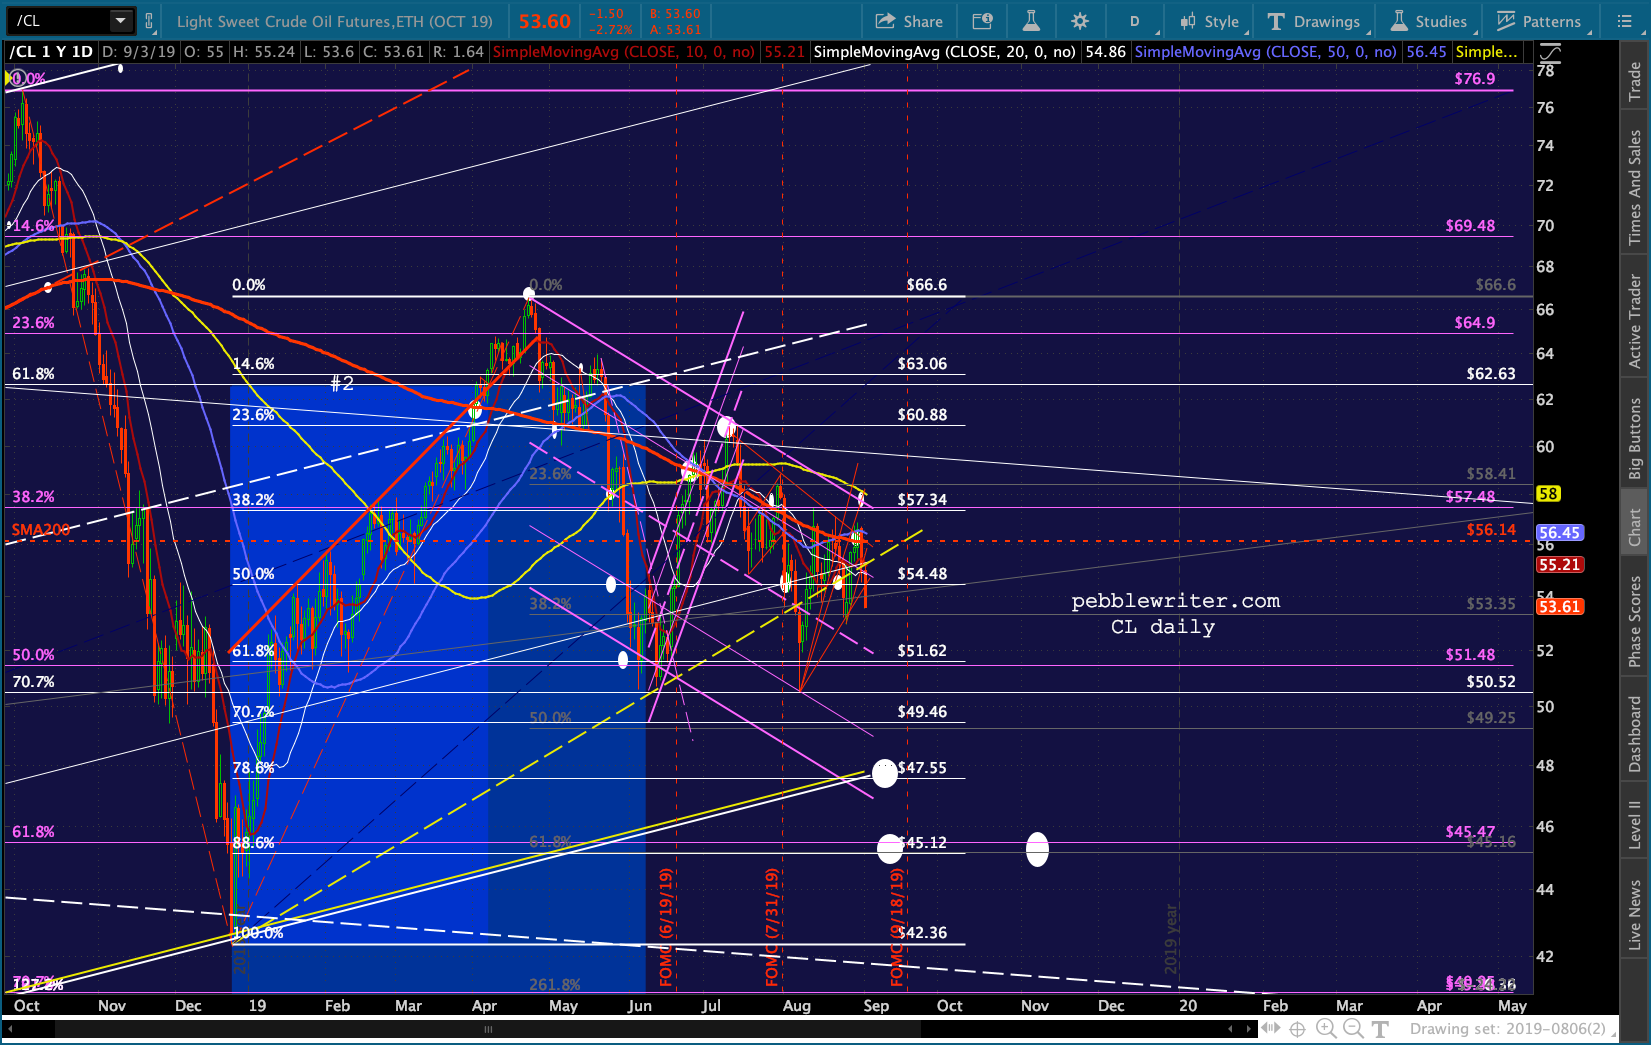
 Stocks are under pressure from sharply falling oil and gas prices which will, of course, be blamed on Dorian turning northward and the prospect of a deal which will see Iran’s production return to the global markets.
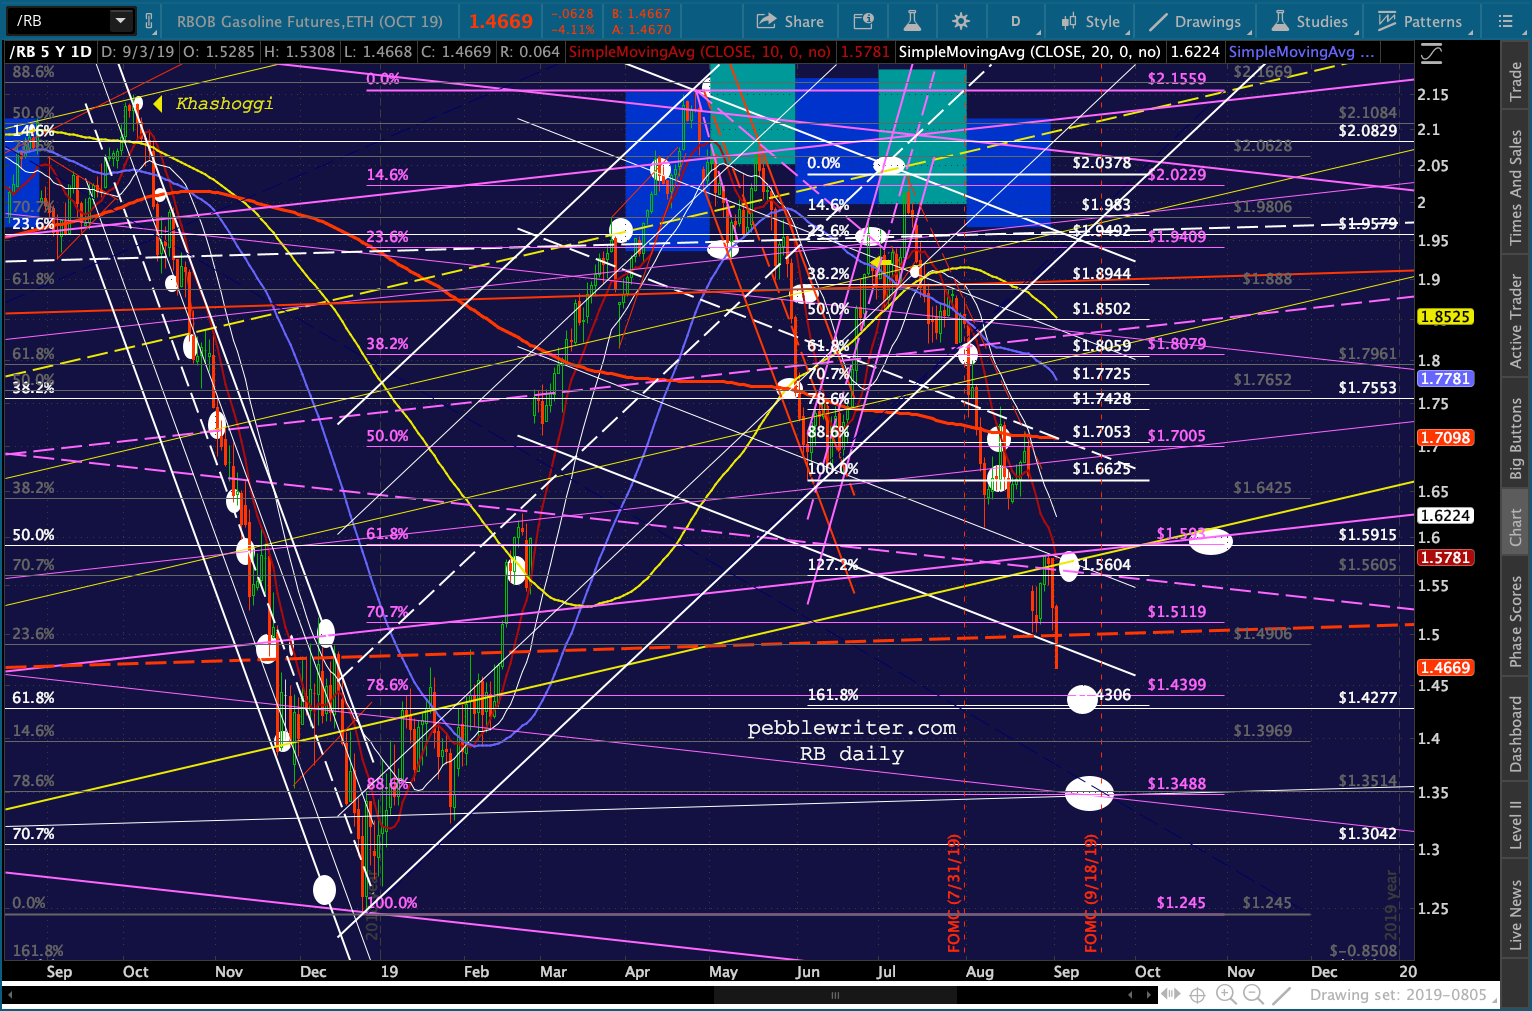
 And, USDJPY is doing nothing to support stocks…
 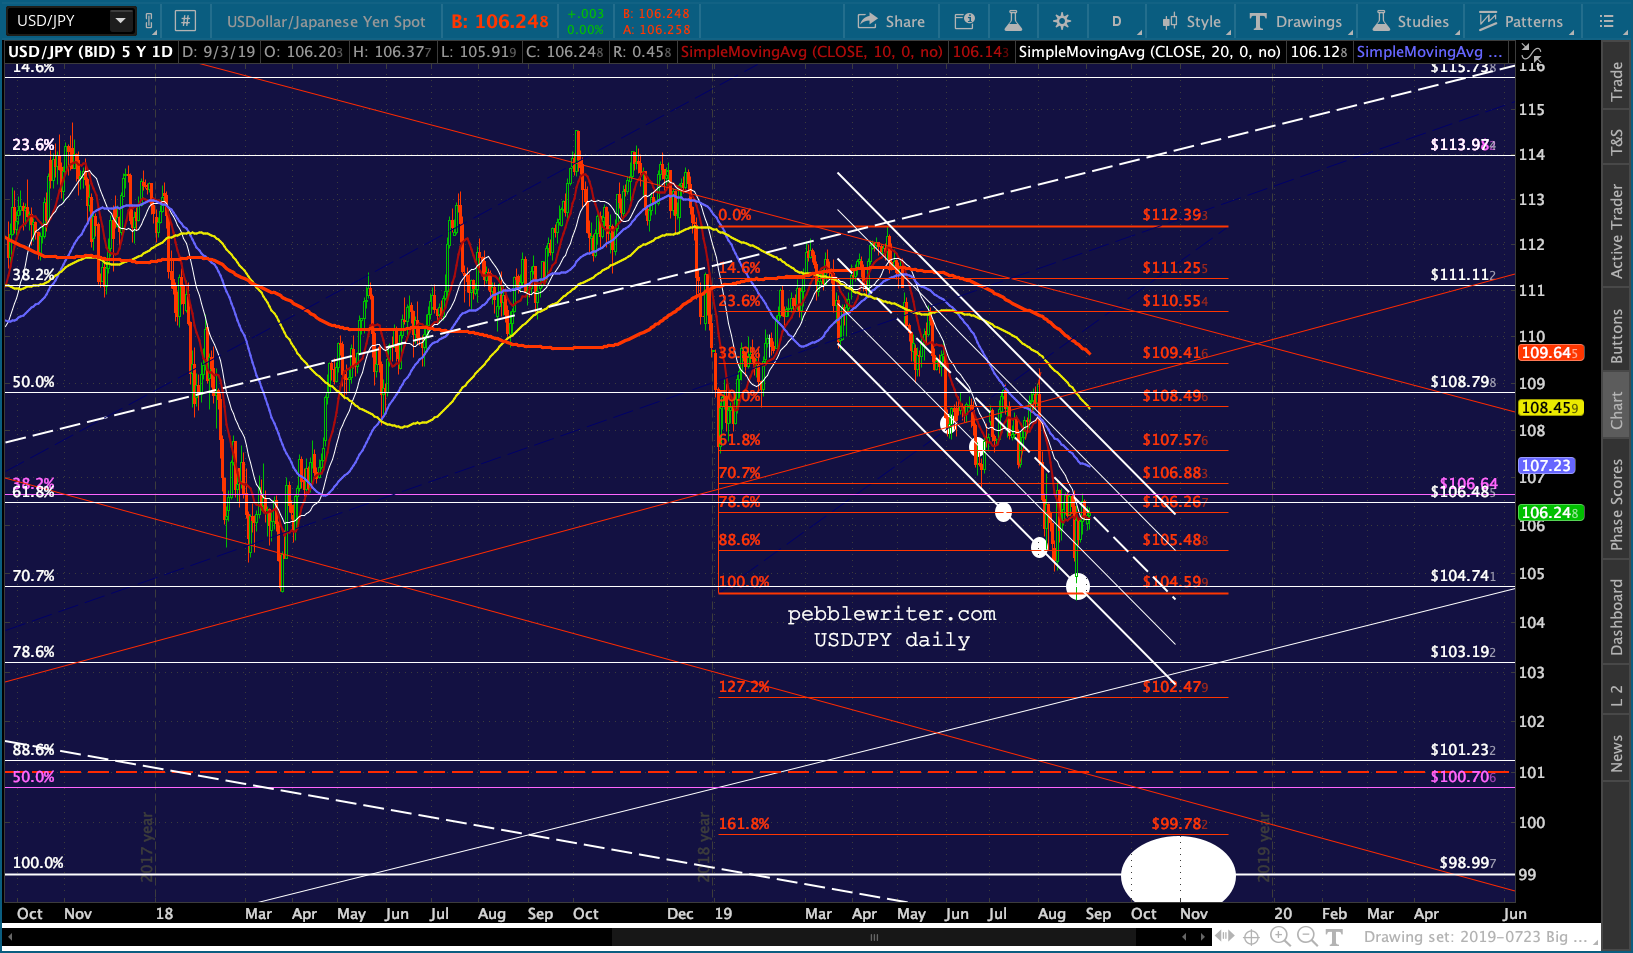 …as DXY has officially broken out…
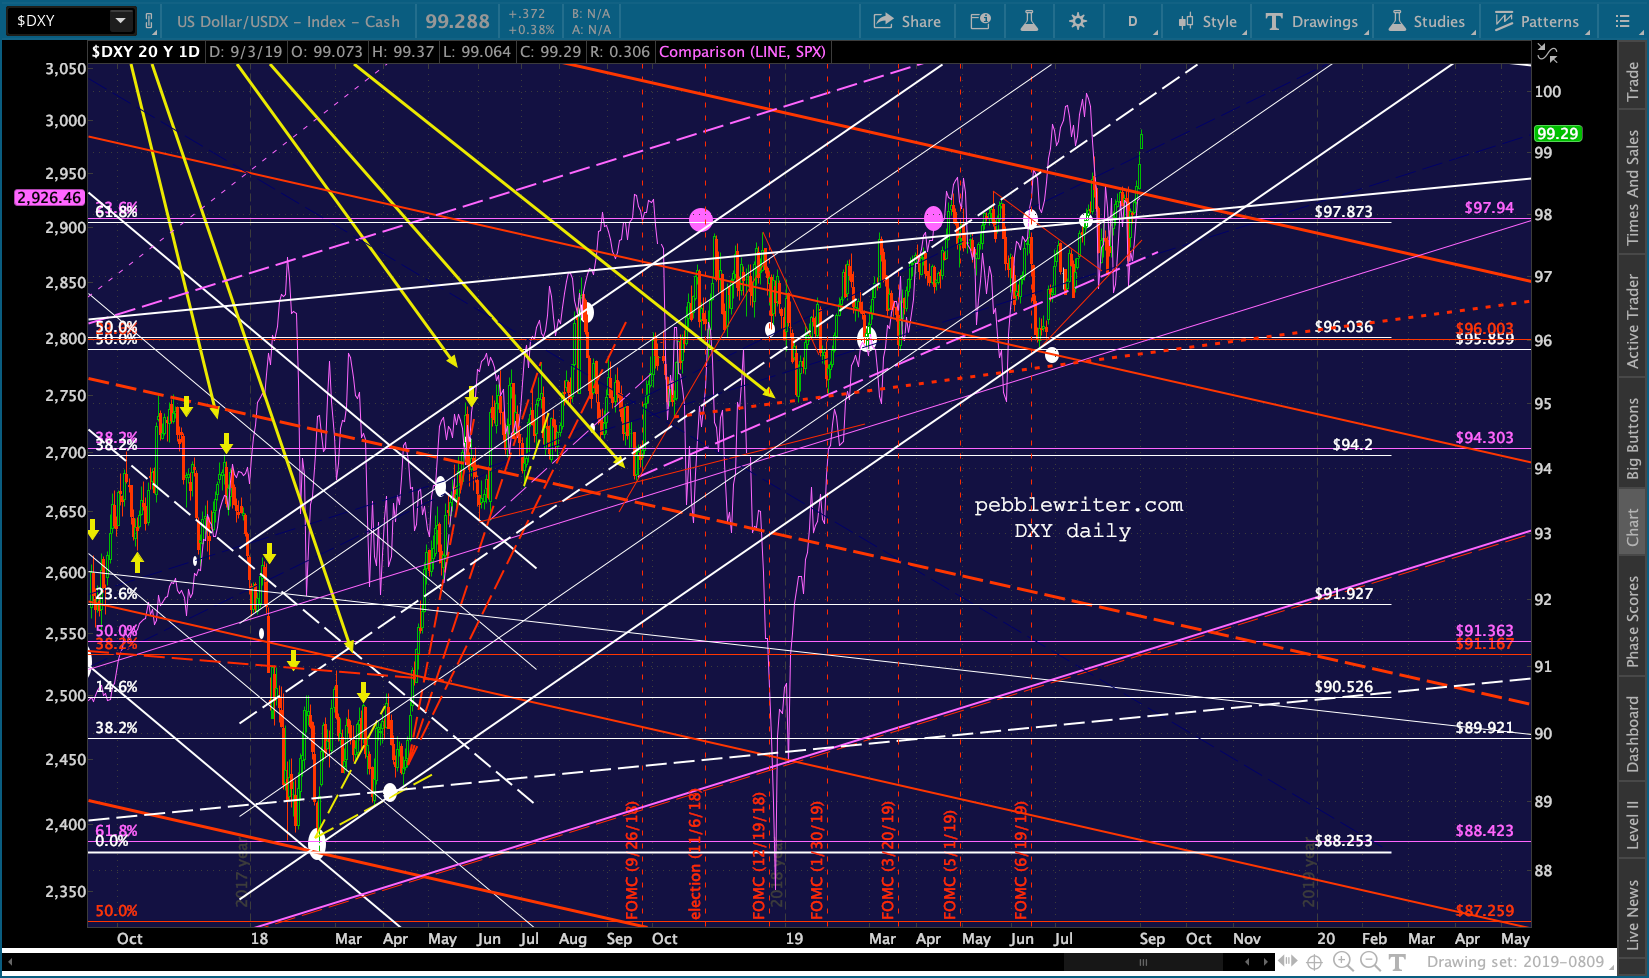 …and EURUSD continues to slump.
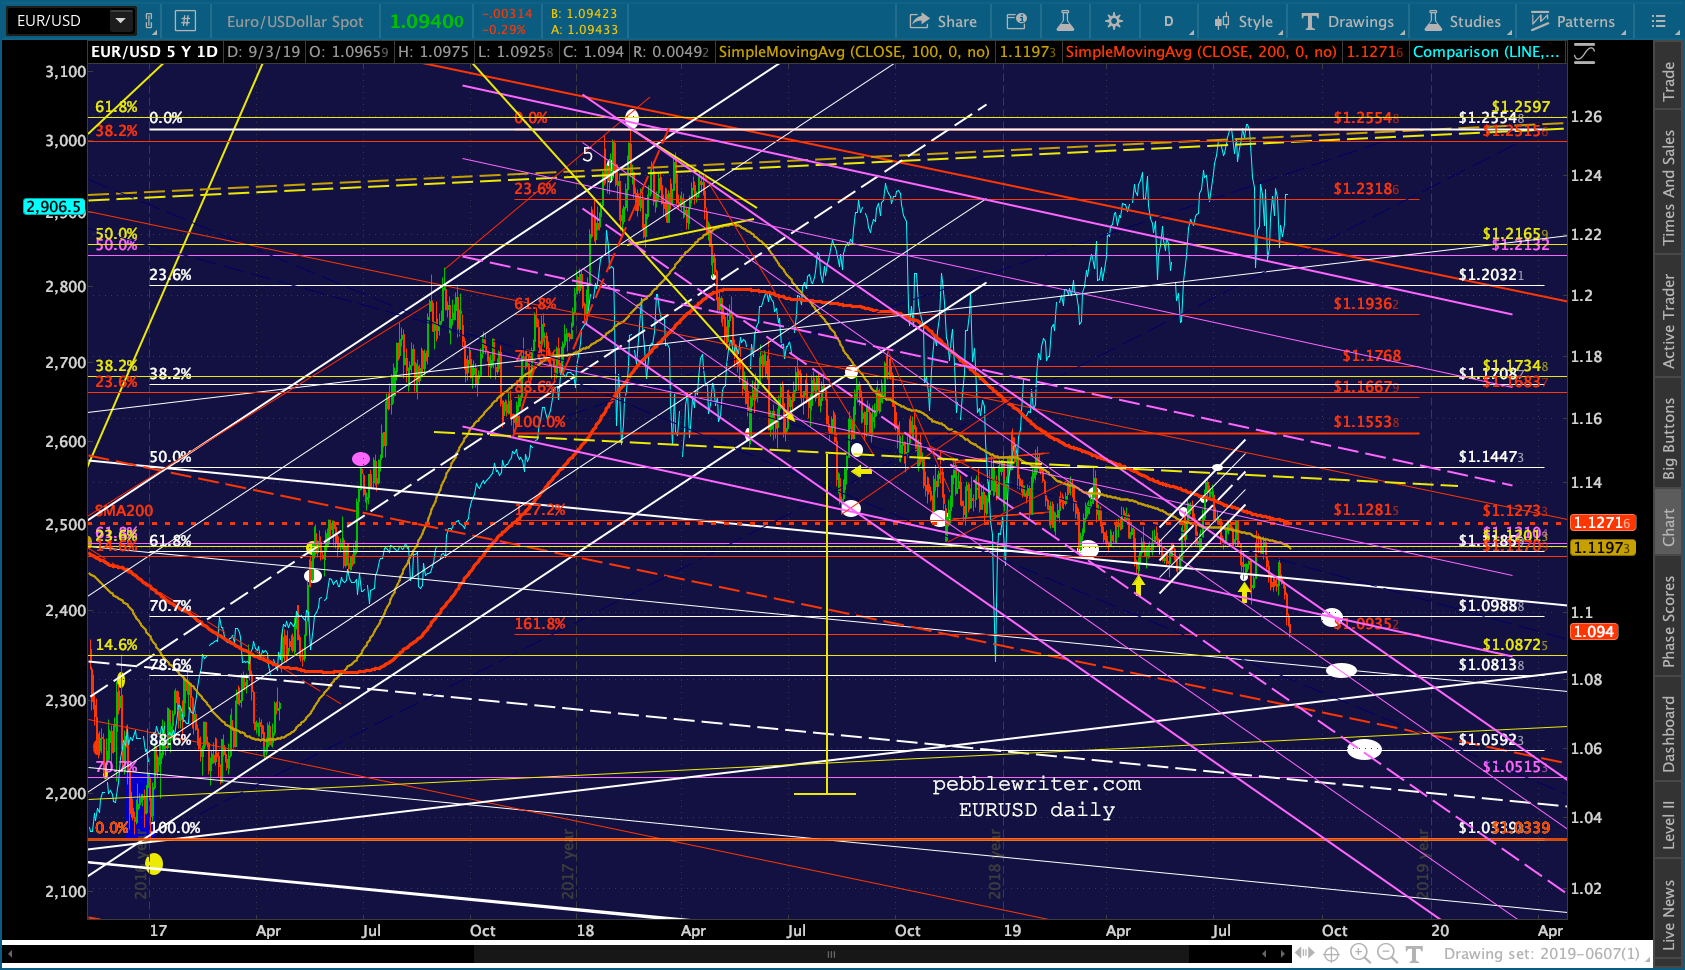 Note: I will continue the currency update in the next hour or so.
VIX’s red TL held and we’re likely to see the purple TL tagged very soon, with an assortment of Fibs and the white channel top coming into play in the course of this downturn.
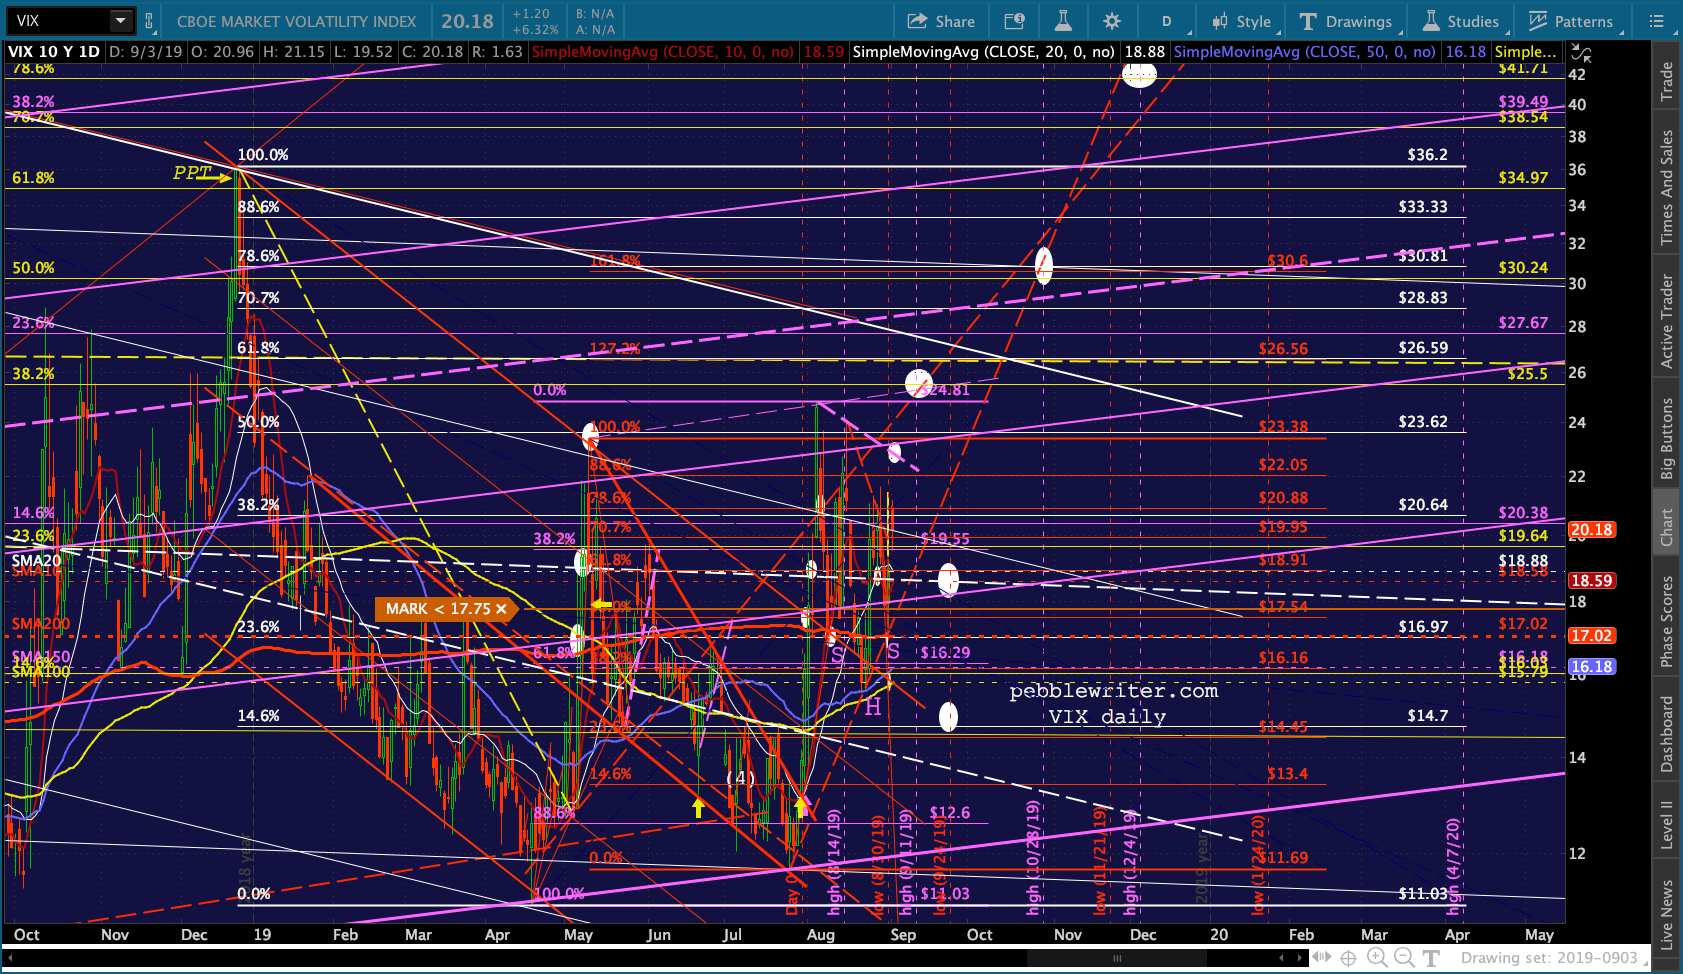 I will be working on fine-tuning the downside target and subsequent rebound this morning, but for now, it looks like this.
 The yield curve continues to be inverted, contributing to investors’ general apprehension.
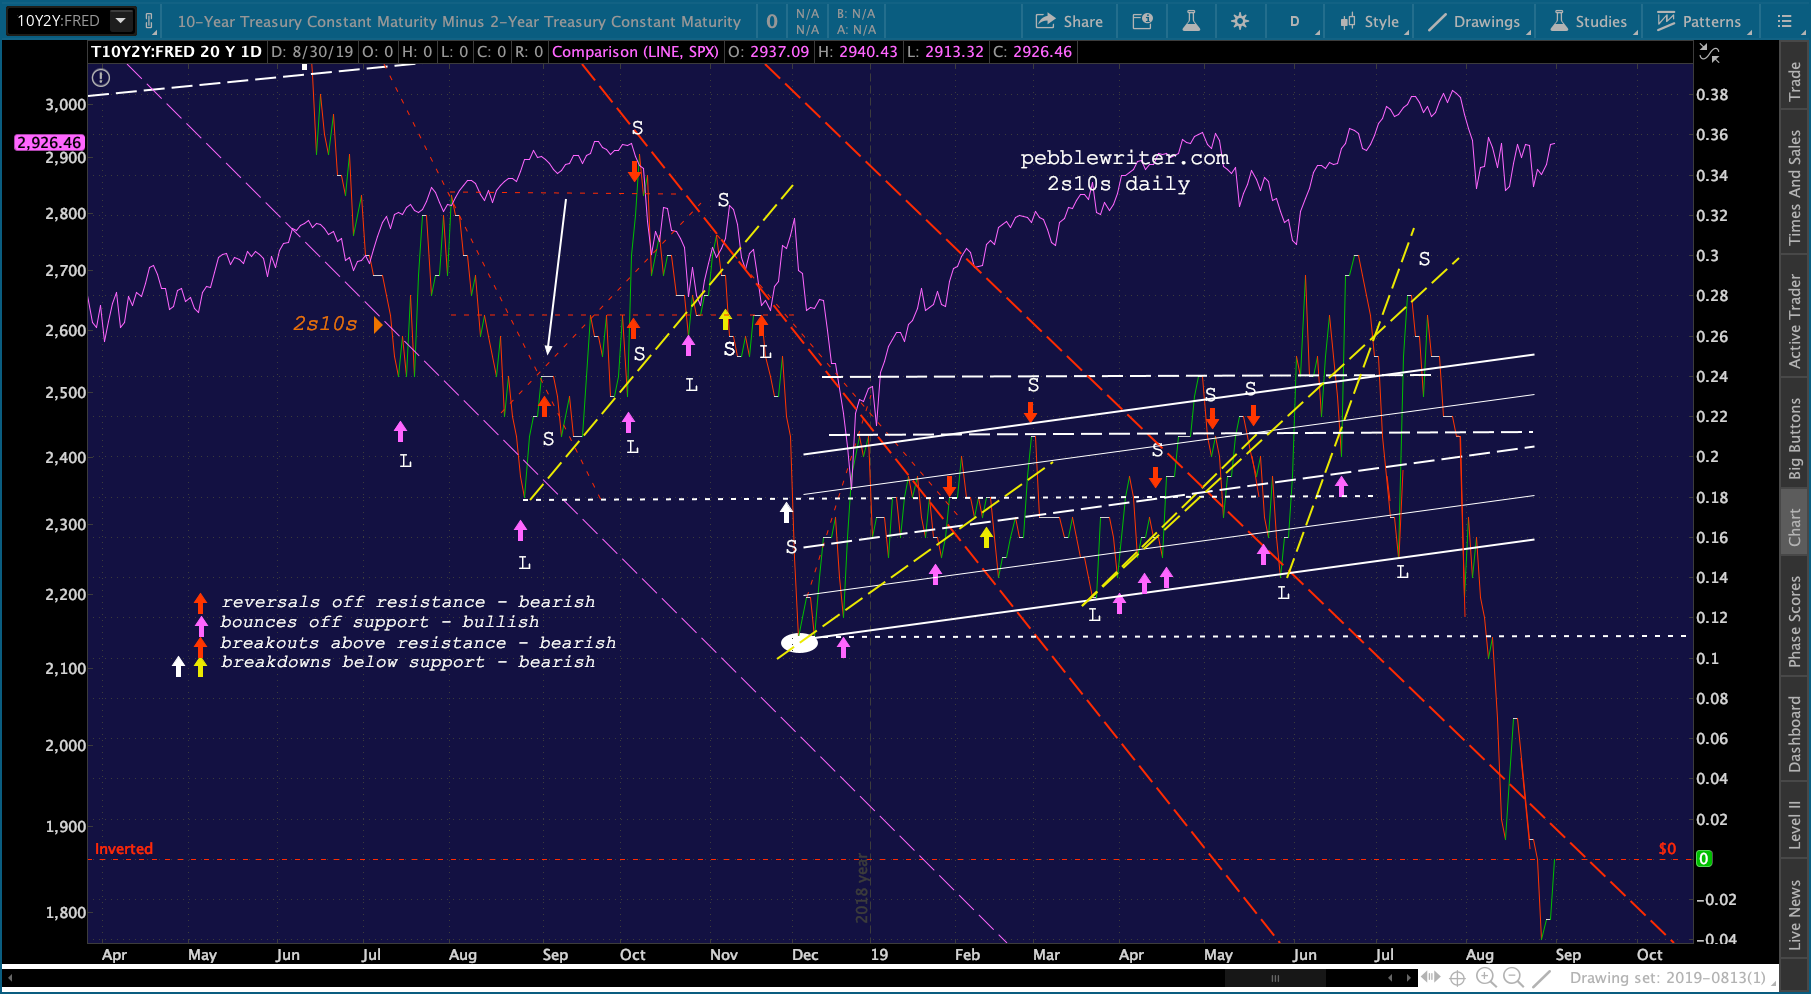 Remember, the move to worry about in the yield curve is a sharp spike higher.
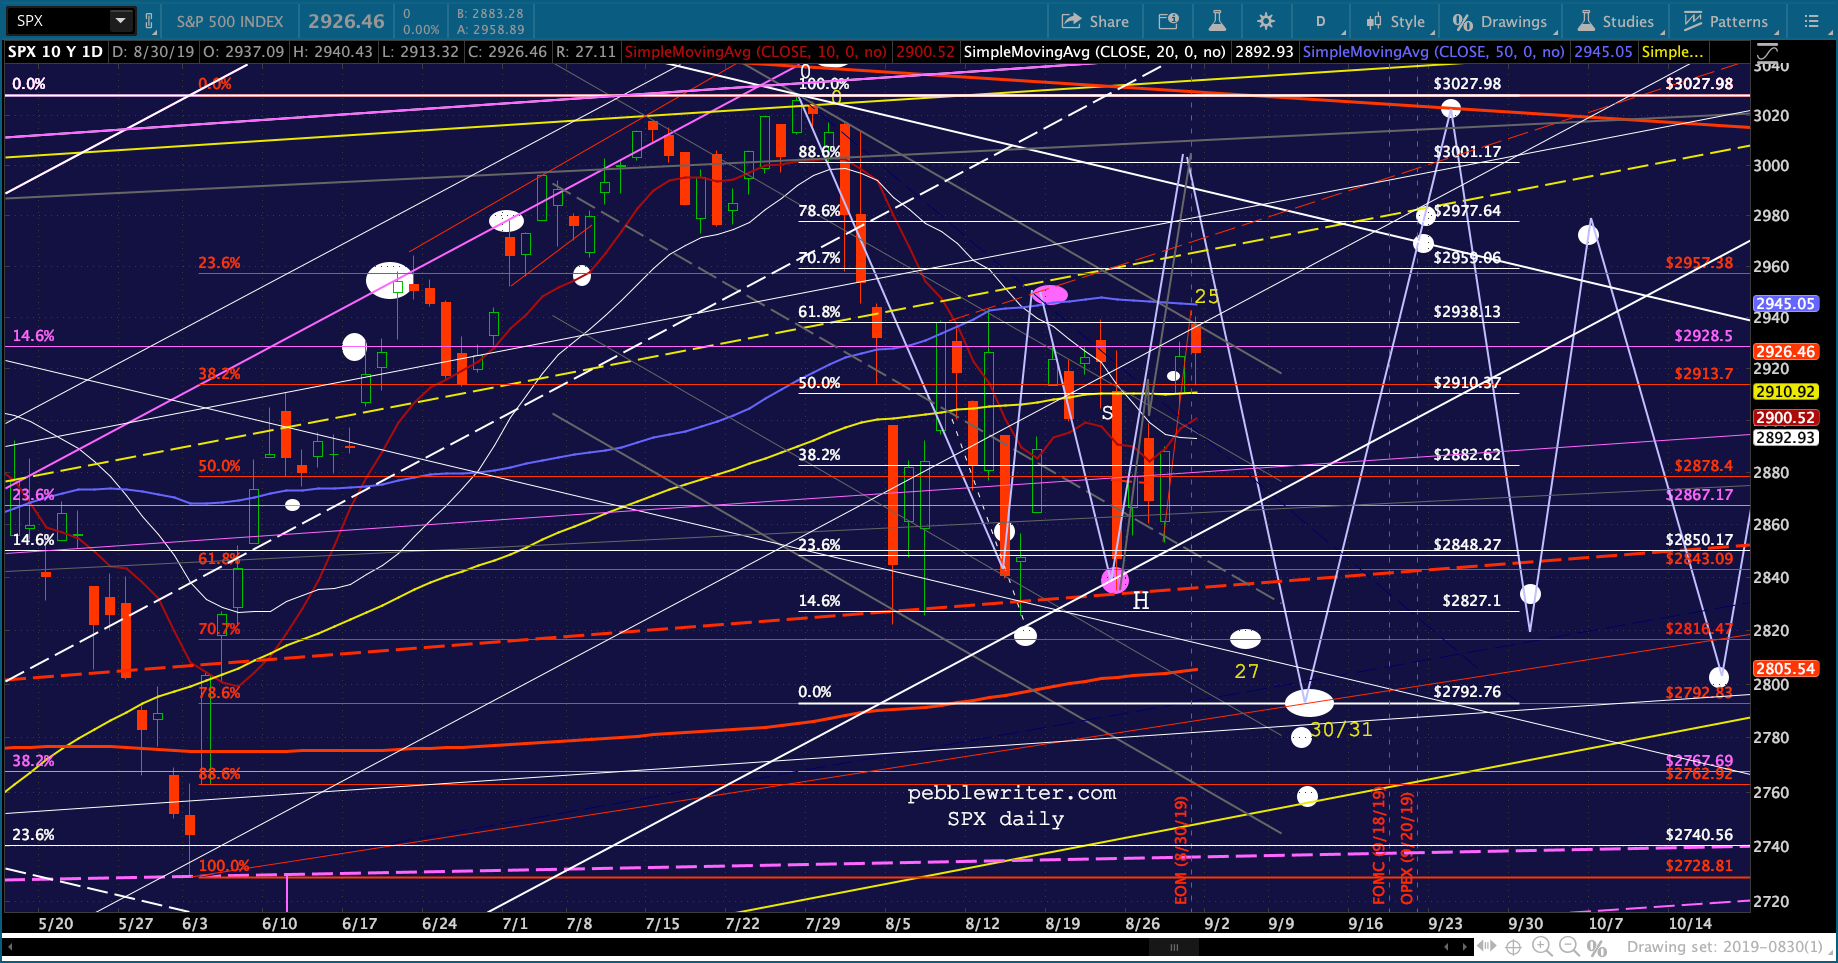
A reminder of the path we’re following… The Day 27 plunge reversed 3 points shy of the SMA200 target and bounced almost 30 points into Day 30 before completing the leg down on Day 32. On that day, it overshot the SMA200 by 11 points to 2044.02 before bouncing back to an 11-point gain on the day.
The following day it gapped lower on the open and plunged to 2044.66 — slightly higher and therefore setting up the rebound that came within 2 points of the all-time 2134 highs on Day O. Bottom line, it was a crazy difficult market to trade with multiple head fakes. There’s no reason to expect things to be any more clear this time.
 I suspect that once the SMA10/20 break down, we’ll see a similar pattern. As SPX approaches the SMA200, currently at 2806.44, I’d watch carefully for any signs of a bounce which is then reversed the following day — giving specialists and insiders the chance to adjust their positions.
If we adjust Day 0 to Jul 30, the it should have occurred, Friday was Day 23, only one day off from the 2015 pattern. The drop to the Day 27 lows took 5 sessions, which would be this Friday and coincidentally, the day that Powell is expected to give a speech. 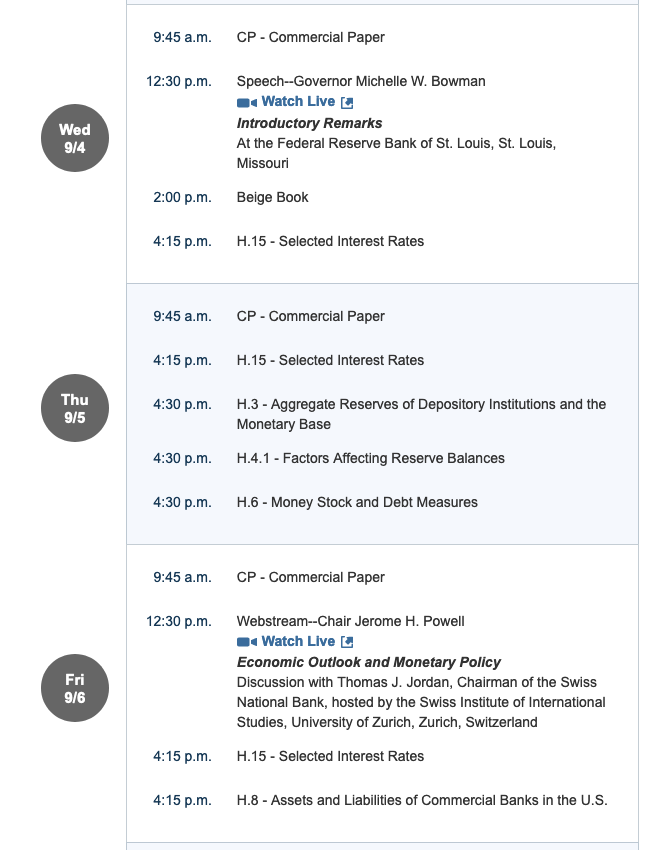 But, Day 27 would be Thursday — a day on which we get Factory Orders, ISM, etc.
 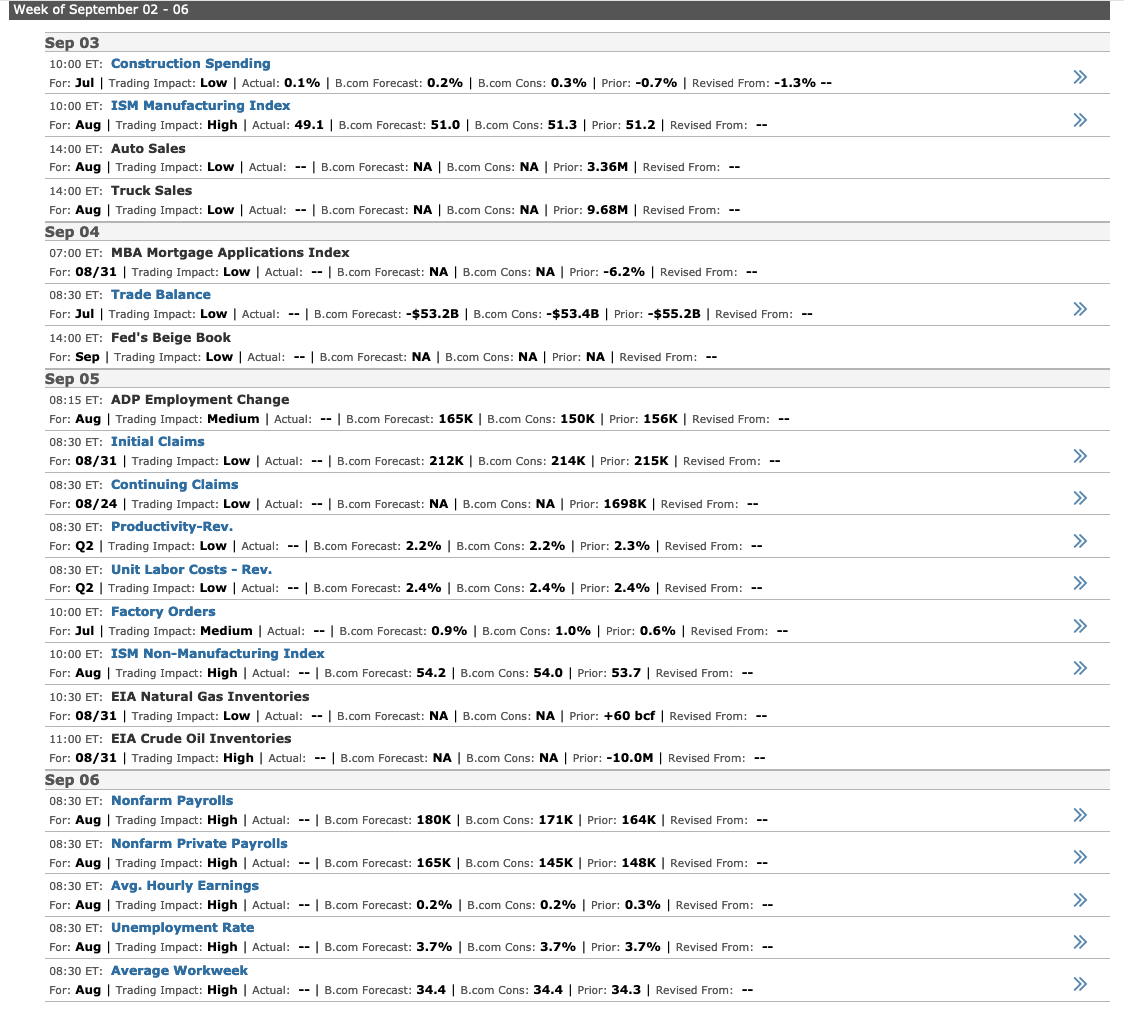 Given the way the declines happened several weeks ago, we can assume the drops will be sharp and scary.
I need to run out for an appointment. I’ll be back to update the currency post around 2pm.