

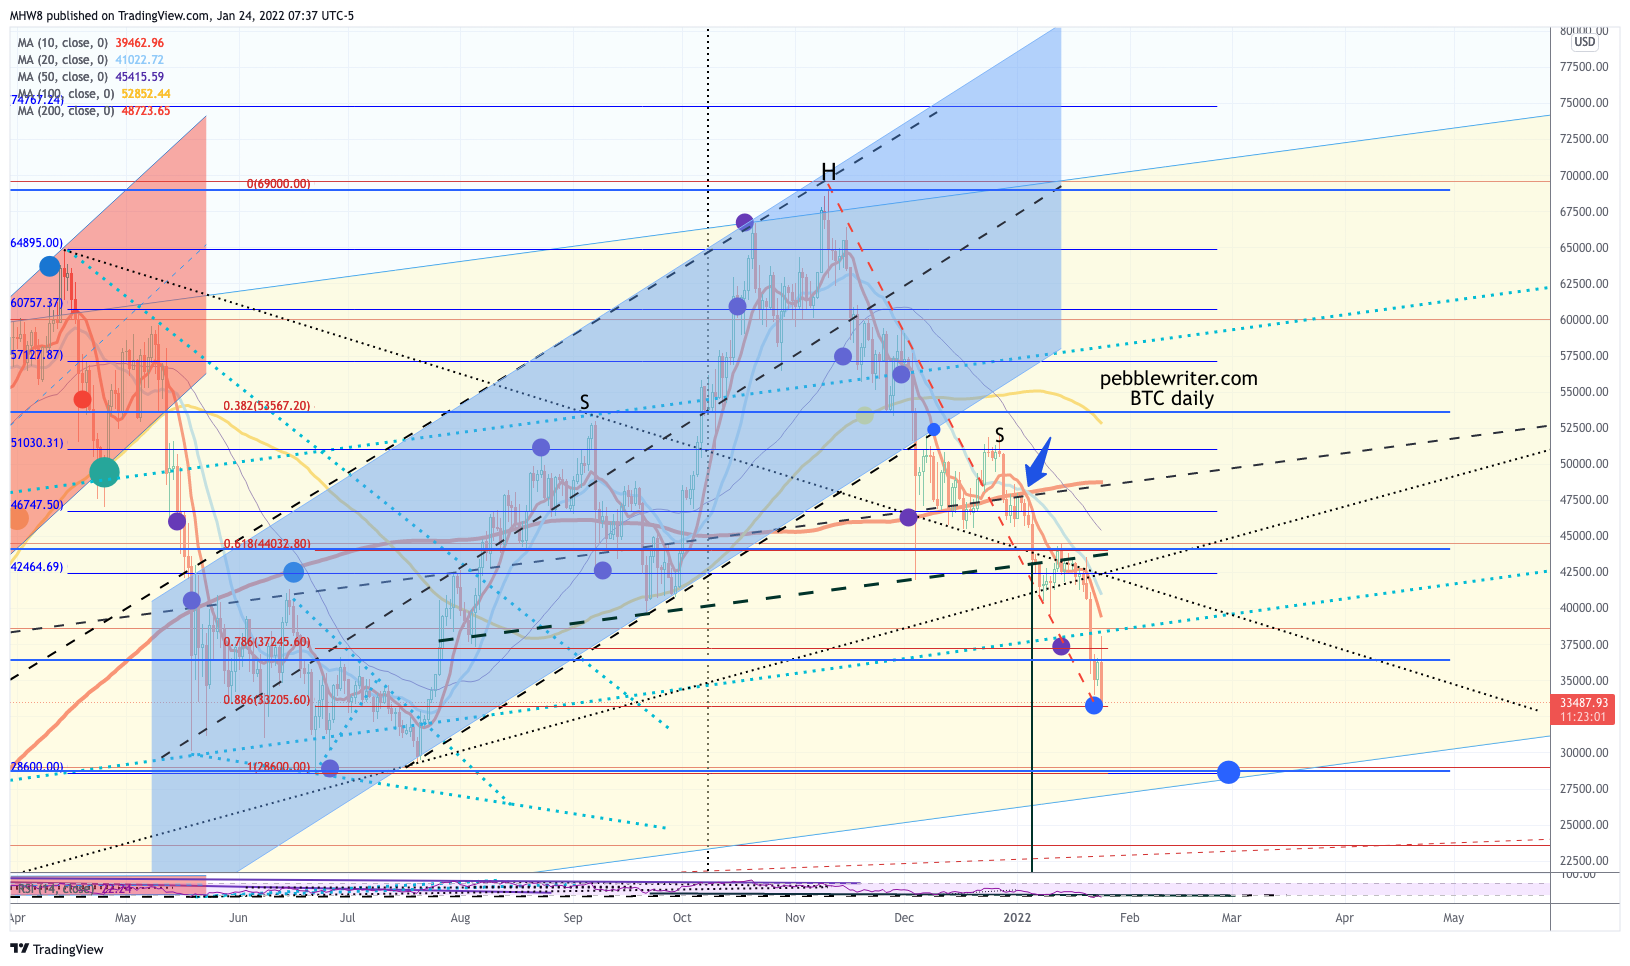
Quick note: BTC has reached our next downside target, the red .886 Fib at 33,205. As we detailed in our last update [see: Jan 18 Update]:
BTC will have two opportunities to rebound at the red .786 Fib (37,245) and the .886 (33,205.) Should these fail, then only one last level of support remains in the way of a complete breakdown.

continued for members…As we discussed last week, a large, completed H&S Pattern targets 15,277. Only the .886 Fib and the channel bottom stand in the way.
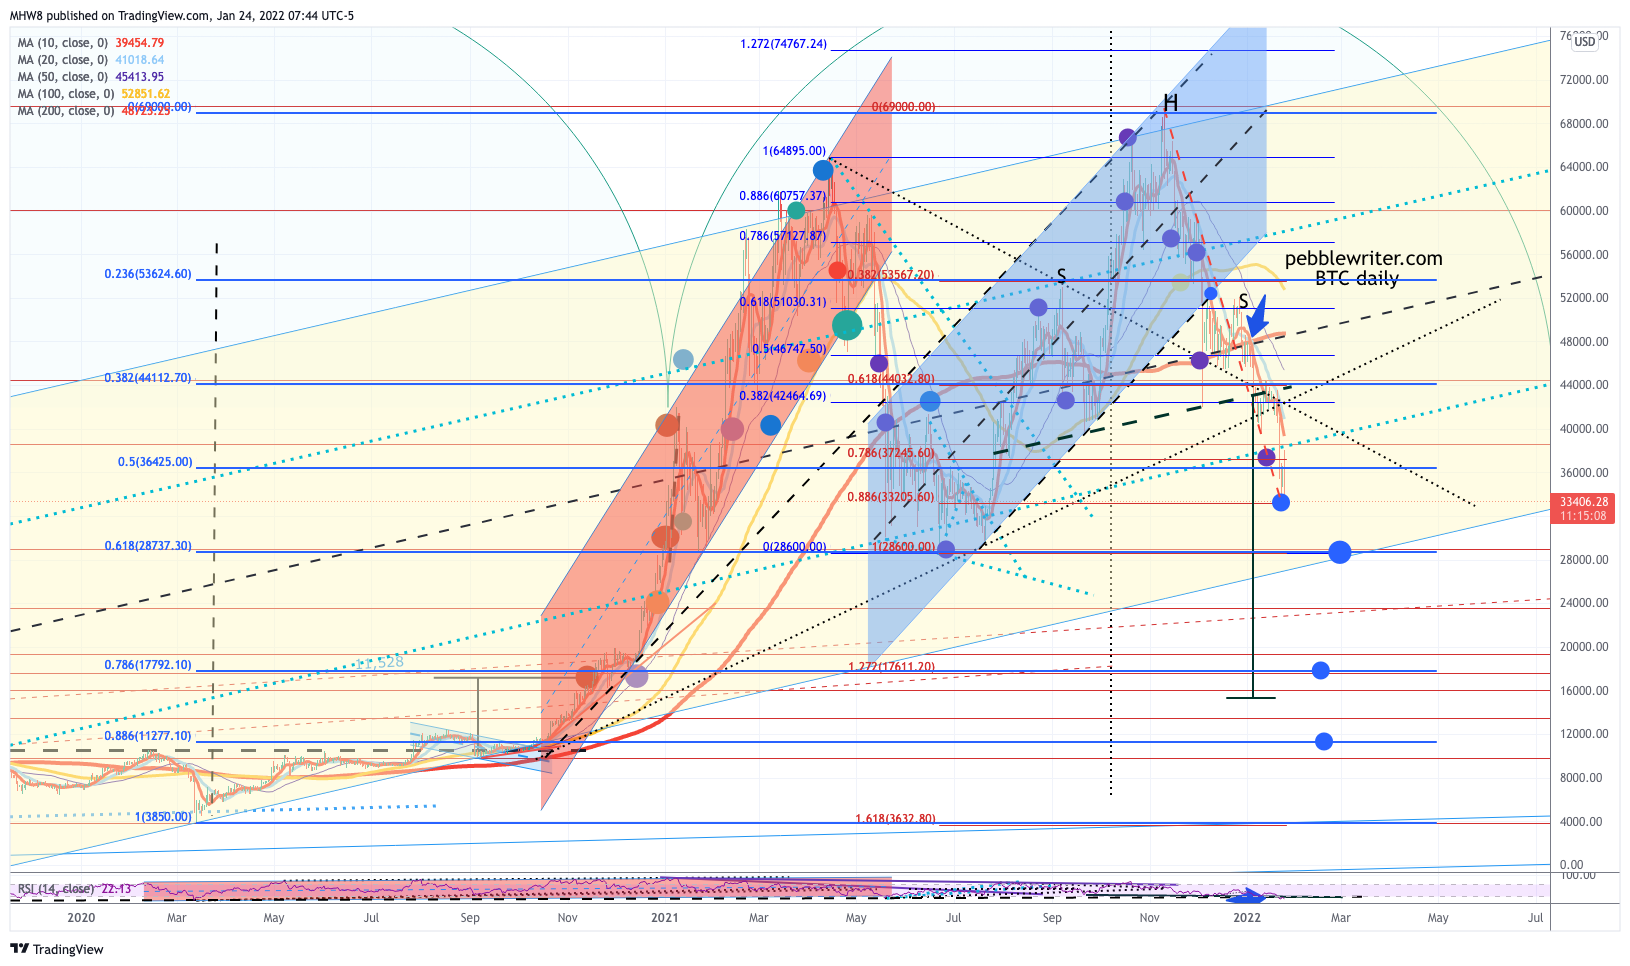
 If/when the channel breaks down, the blue Fib grid is in charge. Having bounced at the blue .618 last June, the implication is that the blue .786 (Gartley Pattern) or the .886 (Bat Pattern) will play out. Note that the H&S target is fairly close to the .786.
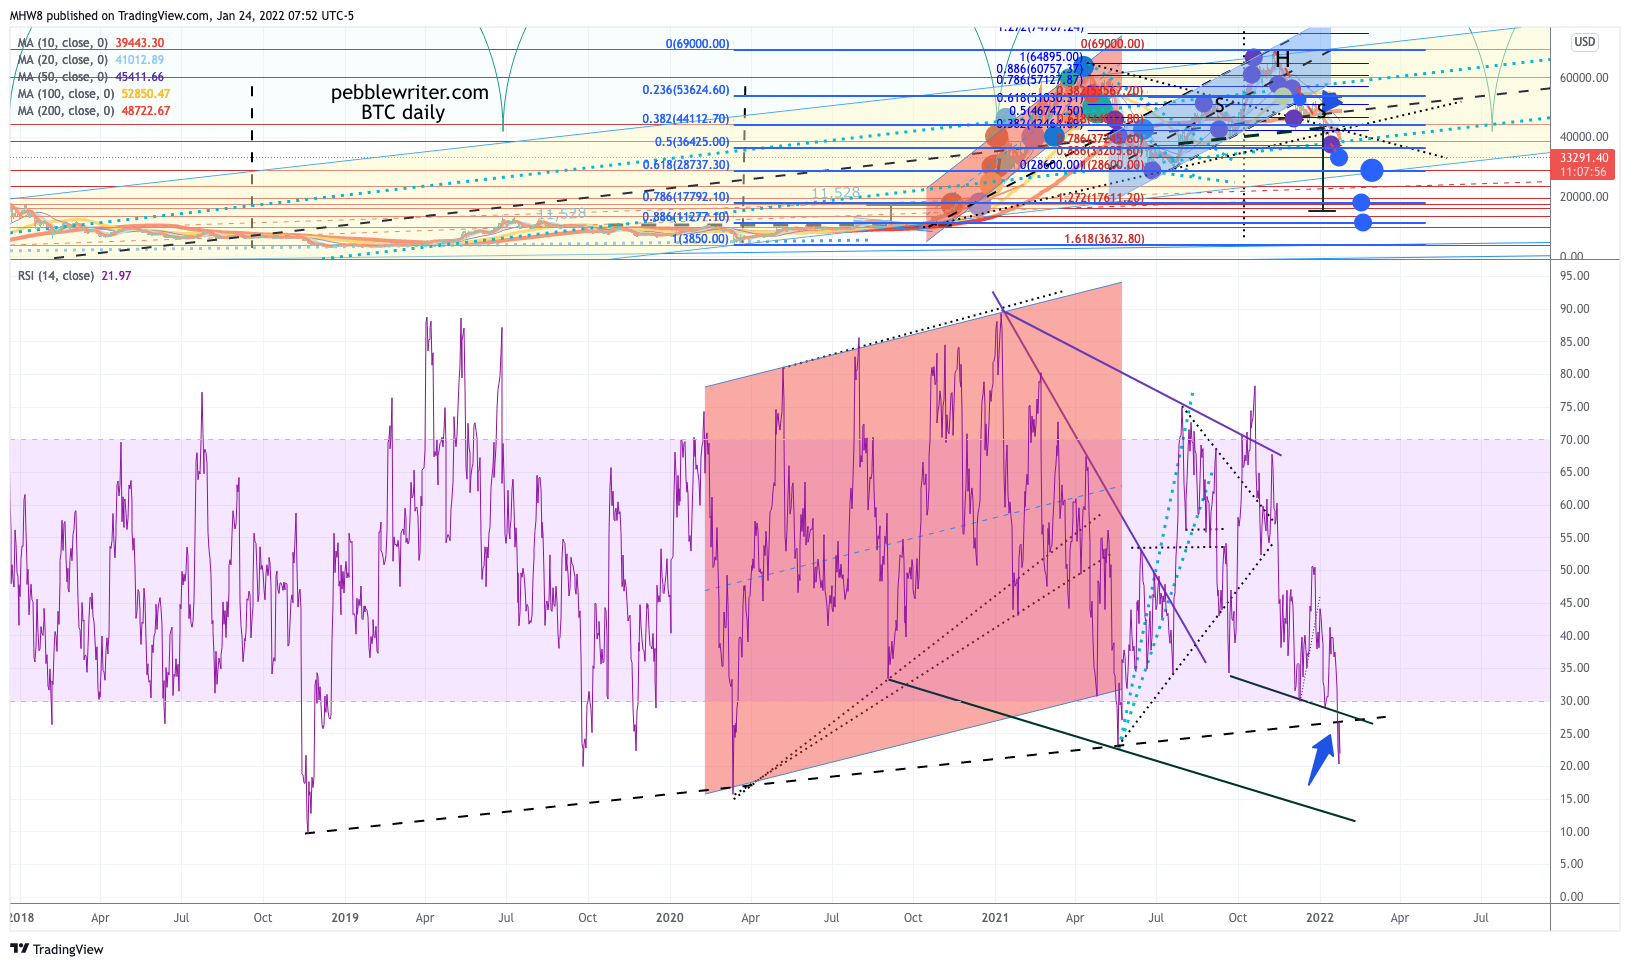
 BTC’s RSI chart has been quite helpful over the past year. Note that the trend line connecting the Nov 2018, March 2020, and May 2021 lows has broken down and been backtested. Though one could argue that it’s oversold, this is a very bearish development longer term and supports the notion that the yellow channel will ultimately break down.
 There is a ray of hope in that ES is approaching a potential bounce spot at 4322.50 – completion of a Bat Pattern and a 10% correction of its highs. If the overall market takes a breather from its bearish ways, BTC should play along. But, at this point, the H&S Pattern, death cross and Fib Patterns all suggest the slide is far from over. Anyone playing the bounce should use stops.