

Futures are off nearly 4% in the wake of Trump’s announcement of very severe tariffs which nearly everyone outside his administration agrees are a huge mistake. It’s merely the latest unforced error that this brain trust has unleashed on the economy and the markets.
 ES has reached our 5501 target, with more to come.
continued for members…
ES’ charts continue to be a bit messy, but the next support below the .786 Fib at 5501 is 5407-5417. After that, 5366, 5135, and 4876.


 SPX’s charts are more clear: 5339, 5236, 5132, 4883 and 4500 – for starters.

 I’m still looking for VIX and VX to reach our targets at 32.96 and 28.31 respectively. This will likely be the first opportunity for equities to bounce.

 EURUSD has broken out, with the pair approaching horizontal resistance at 1.12 and additional resistance at 1.15 and 1.17.
 And, USDJPY has broken down, with horizontal support at 139ish taking on increased importance.
 The DXY itself has reached important support at our 101.41 target. If it breaks down, 98.97 and 97.72 are the levels to watch.
 CL and RB have been hit, falling nearly 7% overnight.
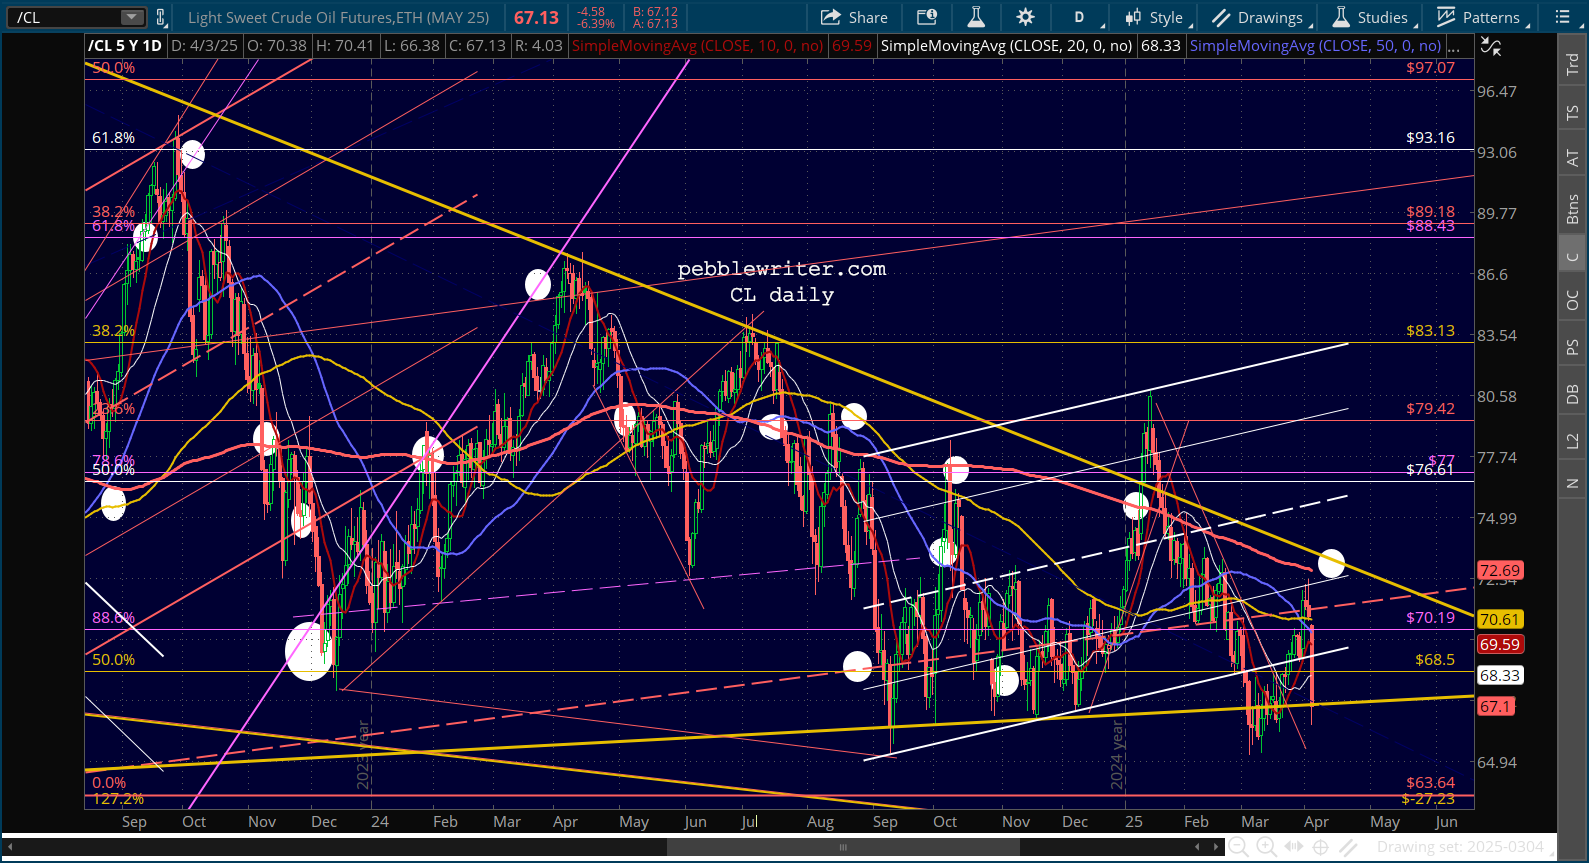
 Between the falling oil/gas prices and, more importantly, the fear trade, the 10Y is testing 4%, with our 39.39 target and 35.55 looking better all the time.
 Note that DJIA’s rising purple channel has broken down.
 COMP is down over 5% and is approaching our 16,212 target.
 Other equity benchmarks…


stay tuned…
Comments
3 responses to “Unforced Errors”
Hello PW, does the XLU model still apply? You used to have two tools for long term forecast, oil and XLU (utilities)
Currently, utilities stocks seem to be holding well.
I’m glad you asked, Tommy. I’ve been looking at it the past few days. For those who aren’t familiar, there has been a cycle going back to at least Nov 2019 just before the the COVID crash that saw the utility ETF XLU make significant lows roughly every 83 sessions – so, about 3 cycles per year. In the 17 such cycles since March 2020, XLU made significant lows 14 times (within 2 weeks of the timing indicated by the cycle.) The 3 times it failed, the cycle coincided with XLU making a significant high. I then found that XLU made signficant highs within 2 weeks of the mid-point of the cycles all but twice. Utilities are unique securities in that they are defensive, income-oriented equities. So, like bonds, we often see them rally when interest rates decline and correct when interest rates rise. But, this behaviour often depends on how investors are hoping to see interest rates behave. When inflation was so low in the wake of the pandemic, for example, investors were hopeful that inflation would return – as a sign that the economy was coming back to life. When inflation got out of hand, though, investors were rooting for rates to decline. Then there were the times when inflation and interest rates weren’t the driving factors, when utilities were caught up in broad equity corrections and were sold along with everything else. With all that being said, the last two times the cycle should have produced XLU lows, they produced highs instead. We also had highs on the off cycle periods as well. These highs preceded drops of 400, 100, 400 and 800 (so far) in SPX. So, I find it interesting that we are approaching another off cycle point (Apr 10ish) which would ordinarily coorespond with an equity selloff. Note that XLU has bumped up against a trendline of resistance in both its price and its RSI and is backtesting the rising white price channel which has guided it higher since Sep 2023. To be fair, it has also bounced off its SMA200 several times since January. So, it seems likely that things are coming to a head depending on how markets react in the next week or so. Will higher inflation produced by the tariffs drive interest rates higher and XLU lower or will the equity correction drive investors into defensive positions like utilities? Either way, the next move should be lower. And, more often than not, declines in XLU correlate with declines in SPX. I’ll try to illustrate the above with charts sometime tomorrow. Stay tuned.
Thank you!