Tag: stocks

  • The Fed’s Big Day

    We’ve pretty much beat the inflation horse to death on these pages over the past six months. Bottom line, It’s too high and potentially out of control.

    So far, however, the Fed’s been able to hoodwink investors and algos and commandeer the bond market. Aside from making things much more difficult for the little guy – who they claim to care about – there have been few negative repercussions.

    But people are starting to talk. At first it was just fringe strategists like yours truly. Lately, it’s financial pundits, important bankers and hedge fund managers. Has the trance been broken? And, if so, will the market care? Today, we’ll finally find out how clever the Fed can be.

    Two years ago, before any of us had ever heard of COVID-19, our charts already called for some pretty dramatic outcomes.  We were pretty sure the 10Y, having reversed right on target at 3.25% in October 2018, was headed for at least 1.55%…

    …a target that was adjusted to 0.15% — 1.33% on January 13 at which point Wuhan City had reported only 40 suspected cases and one death.  On March 8, it reached 0.398% – well ahead of schedule thanks to COVID-19. 
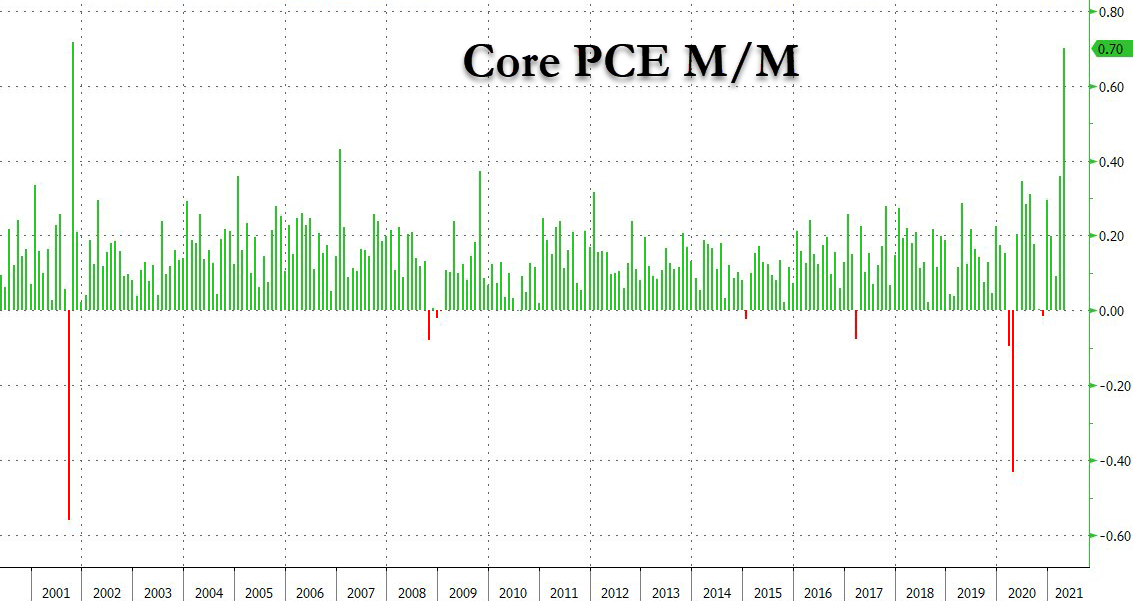
Its rebound has been impressive – aided by a sharp rebound in inflation due primarily to the even more impressive recovery in oil prices.

    Ah, oil… We became convinced in March 2018 that oil was headed for a major breakdown, noting important cycles in its peaks and troughs. At the time, our model showed WTI (then at $62) dropping below $20 in early 2023.

    On Jan 3, 2020 we got more specific, pinpointing $17.12 on April 23, 2023.

    Of course, it dropped much lower and much faster than that. And, it’s recovery has been higher and faster than anyone imagined (or the fundamentals would support.)Interest rates and oil prices are irrefragably joined at the hip.  Gasoline prices are especially highly correlated with inflation… …which has traditionally been highly correlated with interest rates.   But, that all changed in the last couple of months when, thanks to the Fed’s ability to control interest rates, the bond market stopped caring about inflation.

    The stock market was elated as short rates flatlined while the 10Y marched higher…

    …leading to the first time in 20 years that a rapidly rising 2s10s didn’t lead to a market crash.The Fed has pulled off a pretty masterful reinflation of the everything bubble. Are they clever enough to avoid the inevitable pop?

    continued for members(more…)

  • Not So Fast!

    You could argue that the annual PCE print of 3.6%, the hottest since 1992, is merely a function of the base effect – last year’s crash in inflation.But that argument falls flat when you consider that MoM Core PCE, which is completely unaffected by the base effect, soared by a record 0.7%.

    Naturally, both stocks and bonds ignored the data. After all, VIX has plunged 36% in the past 7 sessions, so everything must be okay, right?

    Not so fast.

    continued for members(more…)

  • What’s the Holdup?

    The Dow, the most easily and commonly manipulated index, has gone nowhere since failing to hold its 3.618 Fib extension at 34,430. It begs the question: what’s the holdup?

    Usually, when a closely followed index goes sideways for a while, it’s because an important moving average is moving into position for a backtest. But, is that the case here?

    continued for members(more…)

  • Charts I’m Watching: May 21, 2021

    Yesterday, futures broke out of a very well-formed falling channel for the second time this week. Will it stick this time or is this just typical OPEX nonsense?continued for members(more…)

  • Live by the Algo…

    Live by the algo, die by the algo…so the saying goes.  ES continues to make good progress toward our downside targets, with the usual assistance from currencies and commodities AWOL so far.

    continued for members(more…)

  • Charts I’m Watching: Apr 21, 2021

    Futures are backtesting the 10-day SMA this morning in the wake of the first two day decline since March.

    Look for more to come.

    continued for members(more…)

  • Irrational Exuberance and You

    I received several nearly identical emails yesterday asking whether SPX’s tag of its channel top meant a downturn was imminent. The problem lies with the word “imminent.”We can certainly make a cogent argument that the market is in a bubble: a car company with a market cap of $1.25 million per car sold; more SPACs going public in Q1 of 2021 than in all of 2020 (hundreds of which have yet to buy anything); meme stocks whose PEs would be in the hundreds if they had any earnings; pictures of sneakers selling for $10,000. The list goes on…

    Yet at the end of the day, there’s still so much money sloshing around that dips have not only been few and far between but are very aggressively bought. Those tasked with investing said trillions have settled for relative value rather than value. And bears have been laughed out of the game altogether – easily overpowered by algorithms and the innumerable strategies which key off them.

    We posted this chart on March 23 [see: Fedsplaining] after SPX had been rejected by its 3.618 Fibonacci extension at 3956, noting that anyone (a central bank for instance) wanting to push stocks above that resistance need only to ensure that VIX breaks down below that falling white trend line.

    We examined the same phenomenon back in early 2019 in the wake of the Dec 2018 PPT action [see: The Plunge the PPT is Really Protecting] and countless other times.

    It should come as no surprise that VIX did break down and SPX did, indeed, rise above 3956. Like all the other breakdowns, this one has the potential to keep the party going long past curfew.

    So…another one of those lovely situations where numerous chart and technical patterns suggest a significant selloff just ahead — but, algos are standing in the way. Which will win out?

    continued for members(more…)

  • Calm Before the Storm?

    There are many parallels between yesterday and Jan 26, 2018 – the calm before a vicious 10-day 11.8% storm.  The obvious one is that SPX is back to the top of the large yellow channel dating back to the 2009 lows.  Then, as now, this occurred shortly after SPX had bulled its way through a notable Fibonacci extension.There are other significant similarities.  Recall that then, as now, inflation was running hot due to a dramatic, extended rise in oil and gas prices which accompanied a dramatic, extended drop in the US dollar.  From US Dollar: Capitulation posted on Jan 26, 2018:

    …inflation fears remain a problem. In order to relieve those fears, oil and gas would need to drop — especially from the BoJ’s perspective. …they’re both far enough above Jan 2017’s prices to have generated adequate inflation for Jan 2018.  Needless to say, a 10-15% decline in CL/RB would be a drag on stocks, which are no doubt considering a backtest of the 2.24 Fib extension.

    The “inflation problem” in January 2018 was somewhat different from the one facing the Fed now. After months of CPI exceeding 2%, rising oil and gas prices threatened to push it and the 10Y up to 3%. It finally topped out at 2.95% and the 10Y reached 3.25% a few months later.

    Now, we face a dramatic spike from below 2% in February to over 3% in April unless oil and gas prices plunge right away. I remain convinced they will, but the clock is ticking.

    The Fed has said it sees the rise in inflation as transitory and is thus not concerned. More importantly – we should not be concerned. True, the YoY spike in gas prices will pass as the April 2020 plunge falls out of the comps. But, thanks to the Fed flooding the zone with cash, oil and gas aren’t the only problems. Most commodity prices are back above where they were in 2018 and are still rising.

    And, of course, the national debt that weighs in the balance is now over $28 trillion compared to only $20 trillion back then.

    Ordinarily, I might be tempted to ignore such patterns as the rising wedge in place in ES. Maybe not this time…

    continued for members(more…)

  • Algos to Stocks: “We Got This”

    It’s a light volume day leading up to a holiday weekend – the market’s favorite time to take a shot at important resistance. Though SPX tagged its 3.618 Fibonacci extension several weeks ago, ES has fallen short time after time. The disappointing employment data due out at 8:30 wasn’t going to help, so VIX jumped in with a 7.4% decline at 8:03, falling through the gap close at 18.21 from Feb 21, 2020.  It wasn’t quite enough to get ES up to 3998 (those pesky unemployment data.)But, then, the game’s not over yet…is it?

    continued for members(more…)

  • Stocks to Algos: “Don’t Let Me Down”

    On top of the world, with an adoring crowd gathered below and indifferent law enforcement milling about…there is a bit of a parallel between a famous rooftop concert and the current market.

    As stocks slink into the end of Q1 amidst a bevy of perils, there’s a sense of calm before the storm. Then again, SPX closed yesterday above its 3.618 Fibonacci extension – though just barely this time. Can the algos keep the music playing?

    continued for members(more…)