Tag: gartley

  • Harmonics Scenarios

    Periodically, I like to go through and chart the various harmonic scenarios for both the upside and downside.

    It helps to pass the time while sitting and staring at the computer monitor, watching our forecast play out (so far, so good.)

    It’s also helpful in generating a set of potential outcomes for the market over both the near and longer-term.

    DOWNSIDE SCENARIOS

    Remember, all harmonic patterns begin with a significant reversal which we call Point X.  Over the past year, we can identify several obvious Point X’s, each of which generates its own set of Fibonacci retracements when paired with the recent 1422 high.

    continued…

    (more…)

  • 2nd Time a Charm?

    Taking another stab at VIX’s daily chart.   Yesterday’s low of 17.09 was just .03 off the .786 Fib level of 17.12 we mentioned a couple of days ago [see: The VIX is In].

    There are a couple of different interpretations.  Fist: that the smaller (red) pattern is complete at the .886 and should reverse strongly.  Second: that yesterday’s low is just a Point B in a larger pattern such as a Crab.  Third, That we should be looking at the larger scale pattern — which calls for a Point B reversal at the .786 of 16.67.  So, which is it?

    (more…)

  • Fed Up Yet?

    ORIGINAL POST:

    As expected, the Fed threatened much but did little – extending Twist through the end of the year.  Stocks and commodities didn’t much like it; the dollar is up nicely.

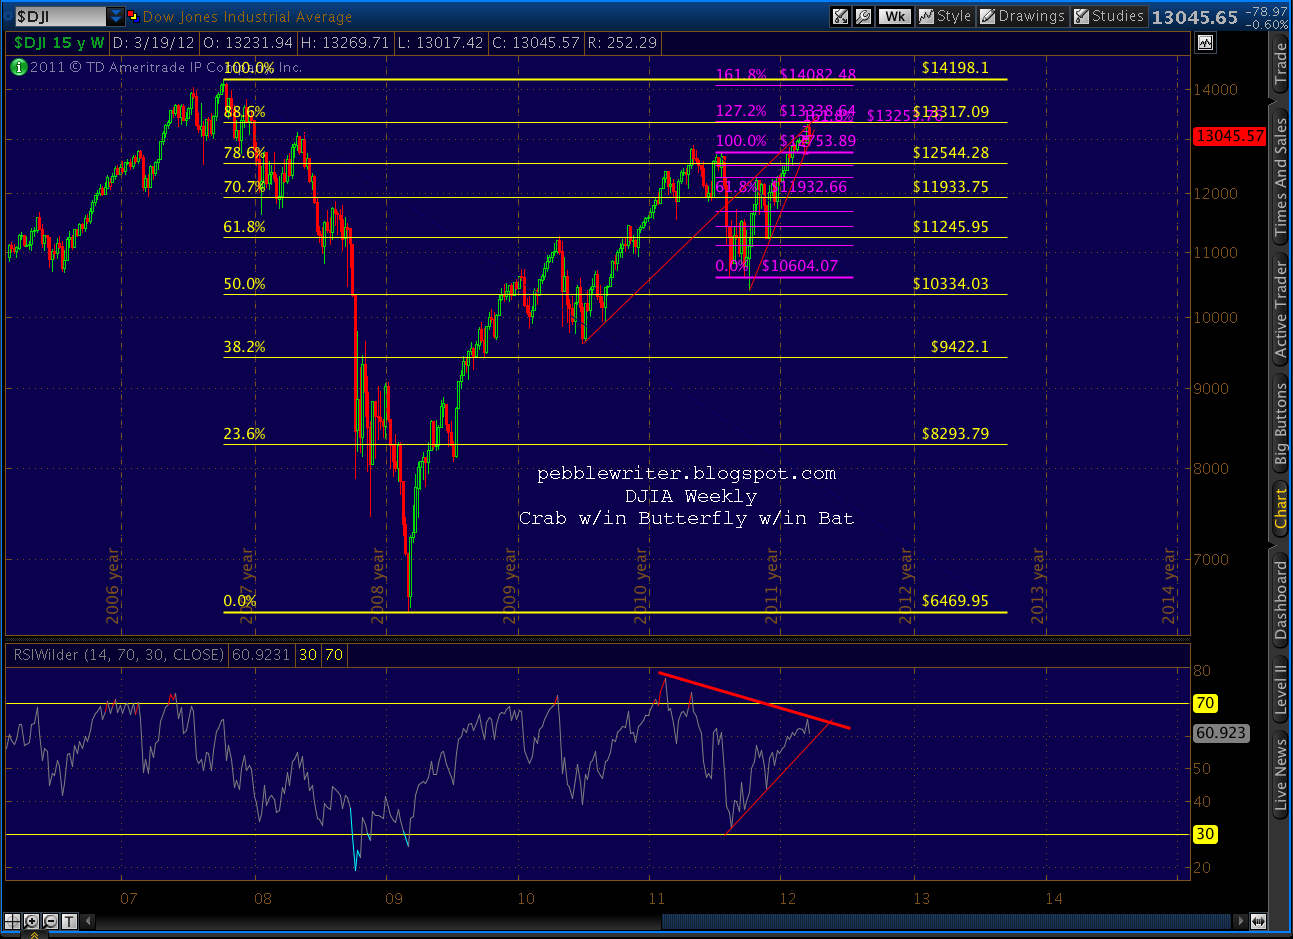
    If the sell-off holds or accelerates at all, it will confirm the Point B we placed at 1363.46 yesterday — the Fib .618 retracement of the 1422-1266 drop. It might also confirm my suspicion that the daily RSI pop out of the channel was an aberration rather than a broadening of the channel, as seen in the following chart.  I keep coming back to the RSI chart below because of its import.

    A drop back into the channel to, say, the midline would probably result in a SPX pullback (Point C) to the channel line around 1340.  A drop to the other side of the channel would likely result in a drop to the other side of the price channel — say 1326.

    Even if we were to call the channel broken, we’d still be looking at a very extended rising wedge in RSI — also a sign of an overbought situation.

    If 1363 holds as our Point B, it leaves the door open for a Gartley, which completes at  the .618 (1389), or a Bat, which completes at the .886 (1404).   Either of these, especially if they come on the heels of a more significant dip now, would likely fit nicely with a VIX drop into the low teens, possibly below the 13.66 watermark.

    Note the smaller scale patterns all had their most common targets exceeded during yesterday’s rumor infused ramp job.  So, the possibility remains that the ramp just continues on up this acceleration channel, straight to our upside targets before turning back down.  That’s certainly what I would have expected had QE3 been announced.  But, I don’t think so.

    I think it’s more likely we get one of the paths below.

    While I’ve been typing this, SPX has recovered to almost even.  In fact, it stopped right at the .886 of yesterday’s highs, seen here on the 5-min chart.  BB’s upcoming appearance will be important.  The lack of a serious sell-off after the announcement should embolden them to leave well enough alone — which might be enough to get a little more downside going.

    I’m going to be traveling over the balance of the week, so posts will be a little spottier than usual.  I know I’ve received many questions and comments in the time it took to put this post together, and I’ll try to answer those after I get to LA this evening.

    Stay tuned.

    ********

    For those who’ve asked about the membership special I’m now running… let me clarify.  If you have any kind of membership other than an annual, you can upgrade to an annual for the next two days and I’ll rebate whatever you already paid.  Your annual membership starts the clock ticking again, so you basically get the past however many weeks you’ve been a member for free.

    This is an especially good deal for quarterly or semi-annual members, who can become annual members at very little additional expense.  And, for those monthly members who’ve been trying us on for size, this is the opportunity to lock in your price.

    Why am I doing this?  First, it’s administratively simpler to deal with one transaction a year than multiple ones.  Second, I’m trying to encourage more members to join.  We have six times as many page views each day as we have members.  So, I know a lot of folks are thinking about it.  And, there are less than 20 charter memberships left — where your annual rate is fixed for the life of the site.  I’d love for existing members to have first crack at them.

    And, perhaps most important of all, the more members we have on the site, the more time I can devote to it.  So, tell your friends and neighbors.  Remember, when they sign up as an annual member, you get an additional 3 months tacked onto your membership just for the referral.


  • SPX: The View from 30,000 Feet

    Our charts have grown fairly “busy” lately, what with harmonic patterns, chart patterns, fan lines, channels, etc.  I find it helpful every now and then to take a step back and examine those elements that have had the biggest impact in recent years — and are likely to continue doing so.

    In my opinion, the two patterns that have influenced prices more than any other are Fibonacci levels (primarily related to the 1576-666 decline) and fan lines.

    Note how strongly prices reacted to each of the Fib lines off the Mar 09 lows.  Every Fib level played an important role in providing support and/or resistance at pivotal points.  The .236 didn’t slow the advance much, but it provided much needed support after a 9% decline.  A tag of the .618 touched off a 17% correction (caught by the .382) and set the stage for the Gartley pattern completion at the .786 a year later.

    (more…)

  • The Road Ahead

    I’ve taken advantage of a relatively quiet morning in the markets to finish mapping the road ahead.  There are quite a few harmonic patterns in play right now.  My practice is to map all the apparent possibilities and look for confirmation (or lack thereof)  between patterns — and then look for ways in which they agree or not with all the chart patterns, channels and analogs I’m watching.

    It’s fairly exhaustive, so takes a fair amount of time.  I hope to post the results in the next hour or two.   In the meantime, the short-term forecast is still for increasing prices.  This morning’s chop does nothing to change that, but does illustrate the importance of using stops.

    Like yesterday, l will occasionally post short-term trading opportunities.  For traders so inclined, the idea of shorting at 1328 and buying back at 1298 is a great trade.  But, it requires a certain degree of vigilance.  For the buy and hold crowd who aren’t interested in 30 point blips, feel free to ignore such forecasts.

    Whichever camp you fall into, please remember to use stops at all times.  These are very precarious times, where unforeseeable events capable of moving markets are unfolding daily.  Please don’t get caught with a significant portion of your net worth hinging on any particular forecast — mine or anyone else’s — without protection.

    For those of you who who haven’t yet signed up, prices are going up at midnight tonight (PST.)   Current members are not affected, of course.  And, as before, the first 100 annual members are grandfathered for the life of the site.  If you’re a quarterly or semi-annual member, you might want to consider upgrading to annual.  To sign up, click here.

    Stay tuned.


    Update:  2:30 PM

    The 5-min RSI just broke out from a falling wedge on positive divergence.  If it can stay above the upper bound this morning’s decline should be erased, and then some.  Watch for a back test of the wedge, which would correspond with a back test of the little red trend line at around 1311.

    Still working on the longer term picture.  I’ll send a message as soon as it’s posted.  At this point, all members should be receiving an email within minutes of when a significant post or update is posted.  Please let me know if you’re not receiving these messages.

    I’ve put the texting option back in the sidebar to the right.  Just enter your cell phone and service provider and you’ll be notified of new posts.  Note:  it doesn’t notify you of post updates, just the initial publishing of a new post.

    UPDATE:  4:05

    That worked out pretty well.  The falling wedge paid off as advertised, turning an 8-pt decline into a 2-pt gain at 1310.50 — just a smidge below our 1311 target.  I hope readers were able to take advantage of it.

    Since I didn’t complete the longer-term picture before the close, I’ll work late this evening and try to get it up before turning in.

    BTW, I get a number of emails during the day from readers, and I’m good with that.  But, I much prefer that anything market related — questions about strategy, investment options, etc. — go into “comments” on the post.  I’m likely to see them more quickly, and more importantly, your fellow readers might benefit from the discussion.  Thanks!

  • Update on EURUSD: April 26, 2012

    A couple of days ago, I updated all the EURUSD charts [see: Update on EURUSD], commenting that the pair was approaching a crucial test of the channel that’s guided it for the past year or so.  With this morning’s mildly positive action, things have gone about as far as they can.

    Note in particular the dashed, red channel and the corresponding RSI trend line.   It looks more like a very strong back test than anything else.  If so, and things get going on the downside again, we should finally complete the H&S pattern (lots of those lately) and reach Point D (1.2721) of the presumed Bat without any difficulty.

    One thing of particular interest to bears is the series of fan lines from the Jan 16 lows.  Each has very clearly provided stair steps lower over the past two months.  The latest to be back tested is highlighted in yellow and happens to form half of a rising wedge over the past 16 sessions.

    This rising wedge is about 2/3 of the way to the apex (1.3335), which is also the .886 of the little Gartley or Bat that’s under construction.  We reached the .707 earlier this morning, poking just above the red, dashed channel line intra-day.

    A close outside the channel and above the RSI TL would be wildly positive for the euro; I must admit, I just don’t see that happening given the conditions in the euro zone vis-a-vis the craptastic picture everyone’s painting on this side of the pond.

    More later.

  • Going, Going…

    I’d be impressed if the bears were able to deck OPEX — the perennial champ — and let the H&S pattern play out just yet.  But, here we are, at the bottom of the nice little channel that’s guided the upside since 1357 on April 10.  I suspect the sell-off will be limited to 61.8% of the rise, or 1370.

    The nice thing about the .618 is that it leaves open the possibilities of a Gartley, with a reversal at the .786 at 1365, or extension to a Crab’s 1.618 at 1335 — which would be a nice level at which to start a back test of the neckline.

    If there’s one thing you can count on these days, it’s the market’s insistence on maintaining maximum ambiguity for as long as possible.

    More later.

  • Charts I’m Watching: March 22, 2012

    ORIGINAL POST: We’re finally seeing reactions on the harmonic pattern completions we’ve been watching for what seems like forever [see: Everything’s Coming Up Crabs.]RUT completed a Crab Pattern (in red) within the last leg of a Bat Pattern (purple) off the 2011 highs.  It never has cleared the TL off the May and July highs.  The May 2011 high was a double-top to 2007’s.

    COMP completed a tiny Crab within a little Butterfly pattern and tagged a key trend line off the 2007 highs.

    I call it a trend line because it’s exactly parallel to the line connecting the 2002 and 2009 lows.  A reversal here would make for four touches — i.e. a channel.  But, COMP could continue bucking its bearish divergence and go up to complete the larger Butterfly pattern (purple) at 3250-3295.

    DJIA still hasn’t made a new high since completing a Crab Pattern a stone’s throw away from a Butterfly Pattern (purple) completion at 13,338.64.  We’re still watching for a clean break of the rising wedge in the price chart and the trend line in the RSI chart.


    Though, it’s important to note that, at these prices, we came within 28 points of completing a Bat pattern (yellow) at the .886 (13,317) in the weekly chart.  That would make for a logical back test if/when the rising wedge finally breaks.  It might also be the 5th and final wave target if today’s move stays within the wedge itself — which is just as likely.

    Coming up….SPX.