Tag: DXY

  • VIX: Not a Coincidence

    When COMP bounced at 10,572.33 on Friday, a mere 7.19 above its June 16 lows, it might have struck some as a coincidence.  It wasn’t.

    It was a well-coordinated effort to ensure that new lows were avoided – at least for the time being.
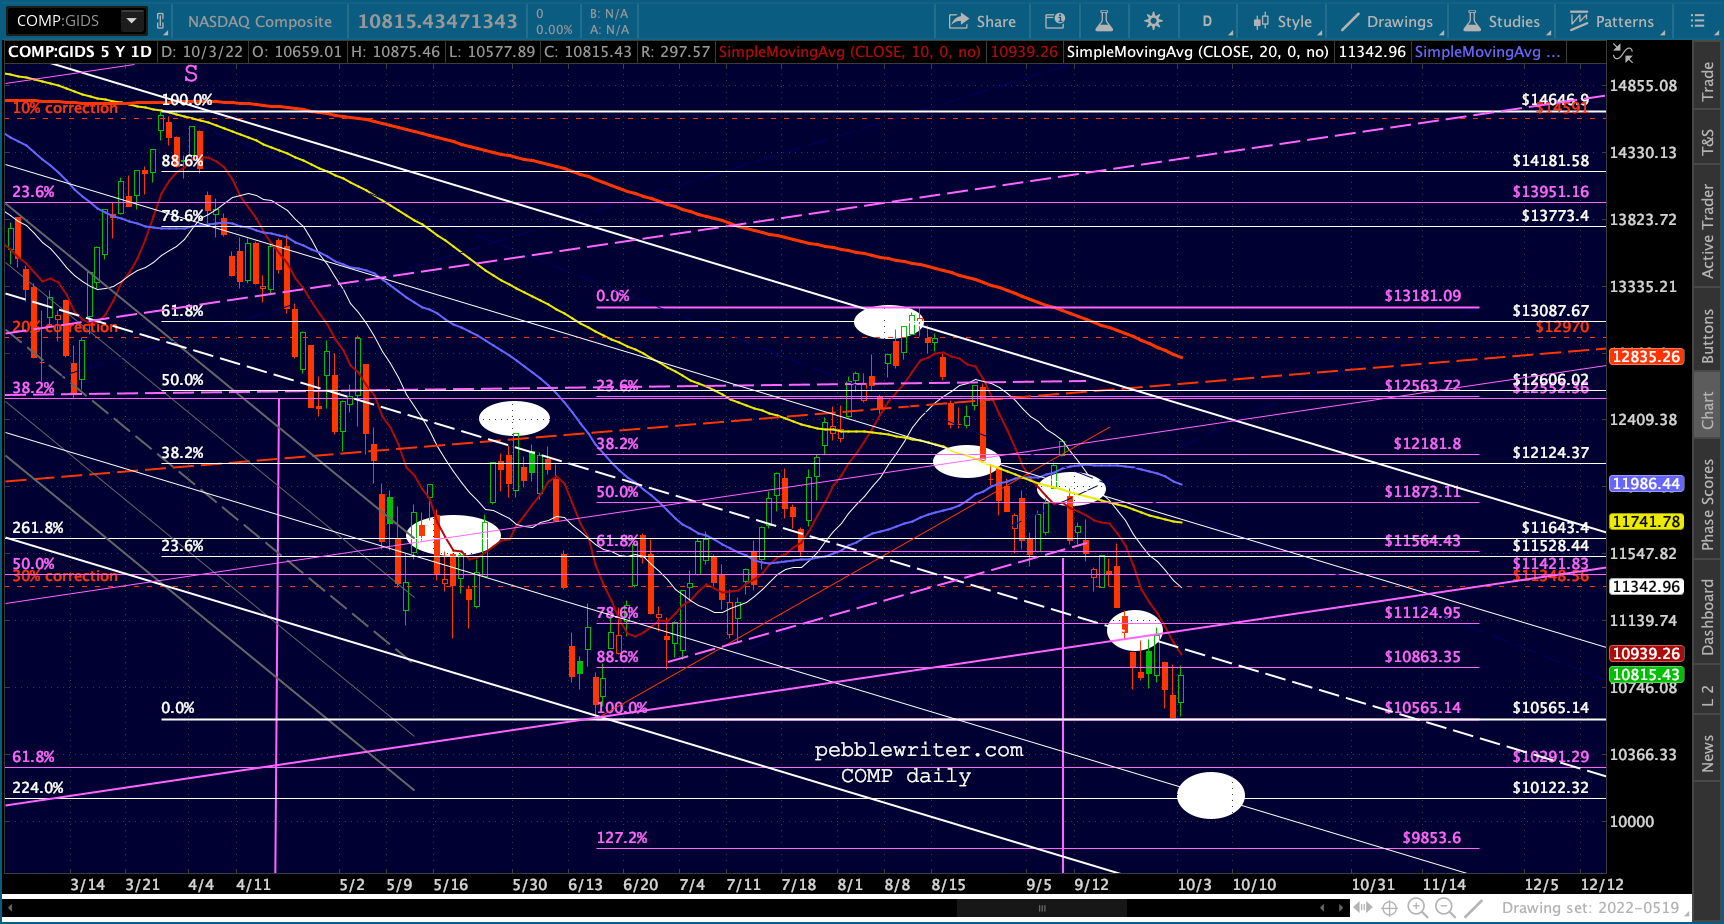
The usual culprit: VIX.  For the 6th session in a row and the 12th time since Jan 24, 2022, VIX tested and retreated from the same trend line – an occurrence the algos have been well trained to respond to with a bounce.  The June 13 test went further, producing a huge bounce because it also broke below two significant trend lines of support as well as producing a bearish (bullish for stocks) alignment in moving averages.

    Yesterday’s huge plunge in VIX similarly wreaked havoc with moving averages – postponing (at least) an imminent 50/200 cross.  Will this short squeeze rally follow the same playbook?

    continued for members(more…)

  • Charts I’m Watching: Oct 3, 2022

    Futures are up about 1%, backtesting the June lows as we approach the opening bell.

    continued for members(more…)

  • (The Latest) Moment of Truth

    As we’ve discussed several times over the past month, VIX’s trend line from Jan 24 was overdue for a revisit. Now that we’ve got it, will VIX nosedive as usual or are we in for something decidedly less bullish?

    The algos are geared up for a bounce.

    continued for members... (more…)

  • VIX at a Crossroads

    For months, VIX has facilitated higher equity prices – plumbing new lows, breaking down, refusing to rise in cases of obvious market distress. Today, it reached a trend line off the previous highs, all of which corresponded with sizeable bounces in the equity markets. It’s an extremely important test for bulls.

    continued for members

    (more…)

  • Losses Accelerate

    Futures are off sharply this morning as important support for various instruments/indices/currencies begins to break down.

    continued for members..

    (more…)

  • Fed Meeting on Deck

    It’s unusual for stocks to sell off in the lead up to an FOMC meeting. Its also unusual for a bearish pattern such as a Head and Shoulders pattern to complete during those days.  Yet, here we are.

    As has been the case since late August, the only thing preventing a severe downturn (aside from the hope that the Fed will suddenly change course and be less hawkish) is VIX – which keeps getting smacked down every time it reaches 27-28.

    continued for members(more…)

  • Another Head and Shoulders Pattern

    Another ugly open for markets as ES, down about 1.25%, completed its H&S Pattern we’ve been watching take shape.

    More grist for the bearish mill…as though we needed any more.

    continued for members(more…)

  • Charts I’m Watching: Sep 15, 2022

    After that vicious selloff, the market is now in wait and see mode – levitated by OPEX this Friday and next week’s FOMC meeting.continued for members(more…)

  • Pretty Soon, You’re Talking Real Money

    Apparently, investors aren’t quite as sanguine about inflation as it seemed. After slightly overshooting our upside target from February, SPX plunged 4.32% – about $1.5 trillion in market cap. Trillion-and-a-half here, trillion-and-a-half there, pretty soon you’re talking real money.  It was the worst day in the markets since March 2020 and one of the worst on record.

    Yet, the talking heads and financial press were all rainbows and unicorns leading up to the CPI print.  The big question, of course, is “what happens next?”

    continued for members(more…)

  • Inflation Rises

    August CPI came in hot, rising 0.1% in August instead of the consensus 0.1% decline. Core was even worse: 0.6% versus 0.3% consensus. The annual print also disappointed, coming in at 8.3% versus expectations of 8.0% or less.Having slightly overshot our 4153 target overnight, ES is now reversing sharply.continued for  members(more…)