Tag: Dollar

  • The Pandemic’s Stark Reminder

    Futures tagged our initial downside target overnight as markets are once again reminded that the pandemic is far from over.

    The shutdown headlines out of Europe won’t surprise anyone who has been watching the COVID-19 numbers.

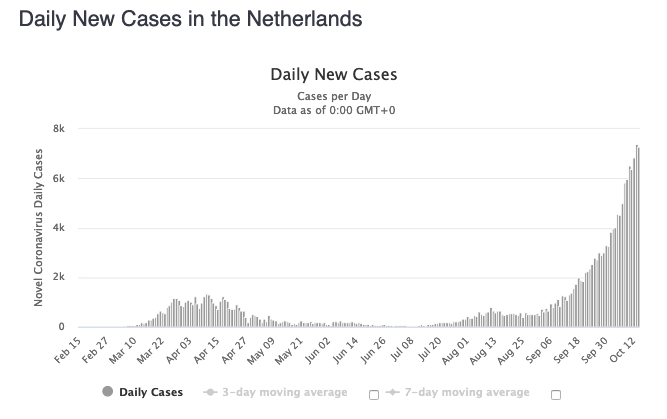
    The US, which was considerably less successful in suppressing cases following the initial or second surge, is on the same path – but from a much higher base.

    continued for members(more…)

  • CPI: Putting the Brakes On

    CPI rose 0.2% MoM in September, half the August rate. It rose 1.4% YoY, slightly higher than September’s 1.3%. Without the outsized gains in used cars and the minor gains in energy (conflicting with the official EIA data), MoM CPI would likely have been negative.

    This is hardly supportive of the reflation narrative driving equity prices lately. This should be the last straw for the 10Y’s bounce, with the resulting breakdown a significant headwind for stocks.

    continued for members(more…)

  • More Gimmicks, Higher Highs

    More gimmicks, higher highs. It’s getting to be an old story. But, as long as voters and algos don’t know or care, it will continue.

    Futures were in danger of giving up Tuesday’s 3421.75 highs when VIX suddenly collapsed by 7% in a matter of seconds.When that didn’t immediately result in a sufficient boost, it happened again, this time around the jobless claims miss at 8:32 and yet again at 9:02 (by 9.8%) for good measure.

    Higher highs, no problem.

    continued for members…
    (more…)

  • Trade Troubles

    The trade deal: the gift that keeps on giving.

    The August trade deficit came in at $67.1 billion, the largest since 2006 – partly a reflection of the pandemic but exacerbated by a 9.3% collapse in the value of the DXY since its March highs.

    At the same time, oil and gas prices have spiked sharply higher since reaching our downside targets on Oct 2. So, bond traders can be forgiven for bidding up the 10Y to nearly 0.80%.If the past is any indication, DXY has much further to go and trade deficits will continue to rise – hardly the outcome the White House promised amid the destructive trade talks in 2018. Remember when the market rallied on every rumored breakthrough?

    No worries, though, as VIX “coincidentally” collapsed by 10% in a matter of seconds, thus preserving a positive open.continued for members(more…)

  • It’s Not Trump

    It’s not Trump, it’s the algos. While the mainstream media focuses on rumors regarding Trump’s return to office, the algos are zeroed in on VIX’s latest failure push above its 200-DMA.This is a kitchen sink moment. Oil and gas are pitching in, with 4.5% and 5.5% pops respectively in the pre-market. And, even USDJPY is threatening a bullish 10/20 cross.

    continued for members(more…)

  • The Dollar’s Demise

    If our charts are to be believed, we are on the cusp of a significant move in currency pairs and the bond yields.

    10Y yields plunged back in March, then began rebounding via a long, drawn-out flag pattern that broke down in late June. Since then, it has been tracing out an equally long, drawn-out triangle pattern that has also broken down.

    It has correlated nicely with DXY, albeit with a 2-3 day lead. If TNX’s latest breakdown holds, we might finally see the next leg down in DXY and the long-awaited, significant moves in USDJPY and EURUSD.

    Needless to say, the dollar’s demise hasn’t helped the trade deficit, which just reached all-time highs despite White House’s claims to have strengthen the trade picture.

    It also doesn’t bode well for stocks. If the past is any indication, October could be a very difficult month.

    continued for members(more…)

  • Because They Can

    A new week, a new breakout in the after-hours for no particular reason.

    And, just when the ramp job started to waver, a 5.6% smackdown on VIX – no news, just a reminder not to focus on the pandemic, the millions out of work, our dysfunctional Congress, the coming election battle, Trump’s tax troubles, etc.

    Why? Because they can.

    continued for members(more…)

  • Core PPI Tops Estimates

    Maybe the Fed had it right, leaving the door open to higher inflation. Though August headline PPI came in slightly higher than expected at 0.3% vs 0.2%, core PPI rose 0.4% versus 0.2% expected.

    S&P futures sold off 8 points on the news, but the algos had other ideas. As is often the case, “someone” hammered VIX and it tumbled back below its 200-DMA at 8:39. The algos were only too happy to oblige, breaking ES out of its latest falling channel.

    Honestly, who needs economic data? Why not just have the Fed trading desk announce the day’s high, low and close every morning?

    continued for members(more…)

  • DXY Breaks Trend

    VIX’s 10/20 cross held yesterday, meaning we almost got a lower low on the day. The overnight ramp job was good for 32 points before DXY started attracting attention. It has dropped below the falling trend line it was patiently following, meaning our forecasts in the currency space are accelerating – especially EURUSD and silver.

    continued for members(more…)

  • Update on AUDUSD: Aug 26, 2020

    After a long, dry spell, I’ve had several requests this week for charts for AUDUSD.  Given the USD’s weakness of late, this seems like a good time to dust off some very old charts.

    In April 2017, we noted that the pair was at important support – its SMA200. If it held, it was in a position to break out of a falling channel. If not…

    …should it drop through the SMA200 at .7546, I would not want to be long at all.  There’s plenty of downside potential, starting with .6584 – the .886 Fib retracement of the rise from .6006 in Oct 2008 to 1.1079 in July 2011.  Should .6584 fail, the October 2008 lows are all that stand in the way of a test of .5493 – the .886 Fib retracement of the rise from .4775 in Apr 2001 to 1.1079.

    Then, I pretty much forgot about AUDUSD…until this week.  Funny how things turned out.  The pair spent over a year bouncing back and forth across the SMA200 until finally breaking down for the last time in April 2018.

    From there, it was all downhill until Mar 19, 2020 where it came within .0015 (0.3%) of the .5493 target.

    Should we care that it has bounced back to potential overhead resistance?

    continued for members(more…)