

It’s been quite a while since I took a look at AUDUSD. I remember the last time [see: May 16, 2016 Update] having some difficulty squaring the harmonic picture with the long-term channels. They just didn’t line up in any logical way.
In spending the past few days staring at the charts, it makes a bit more sense now. But, you have to simultaneously look at USDJPY, DX, EURUSD, SPX and CL. Good thing I have a lot of monitors.
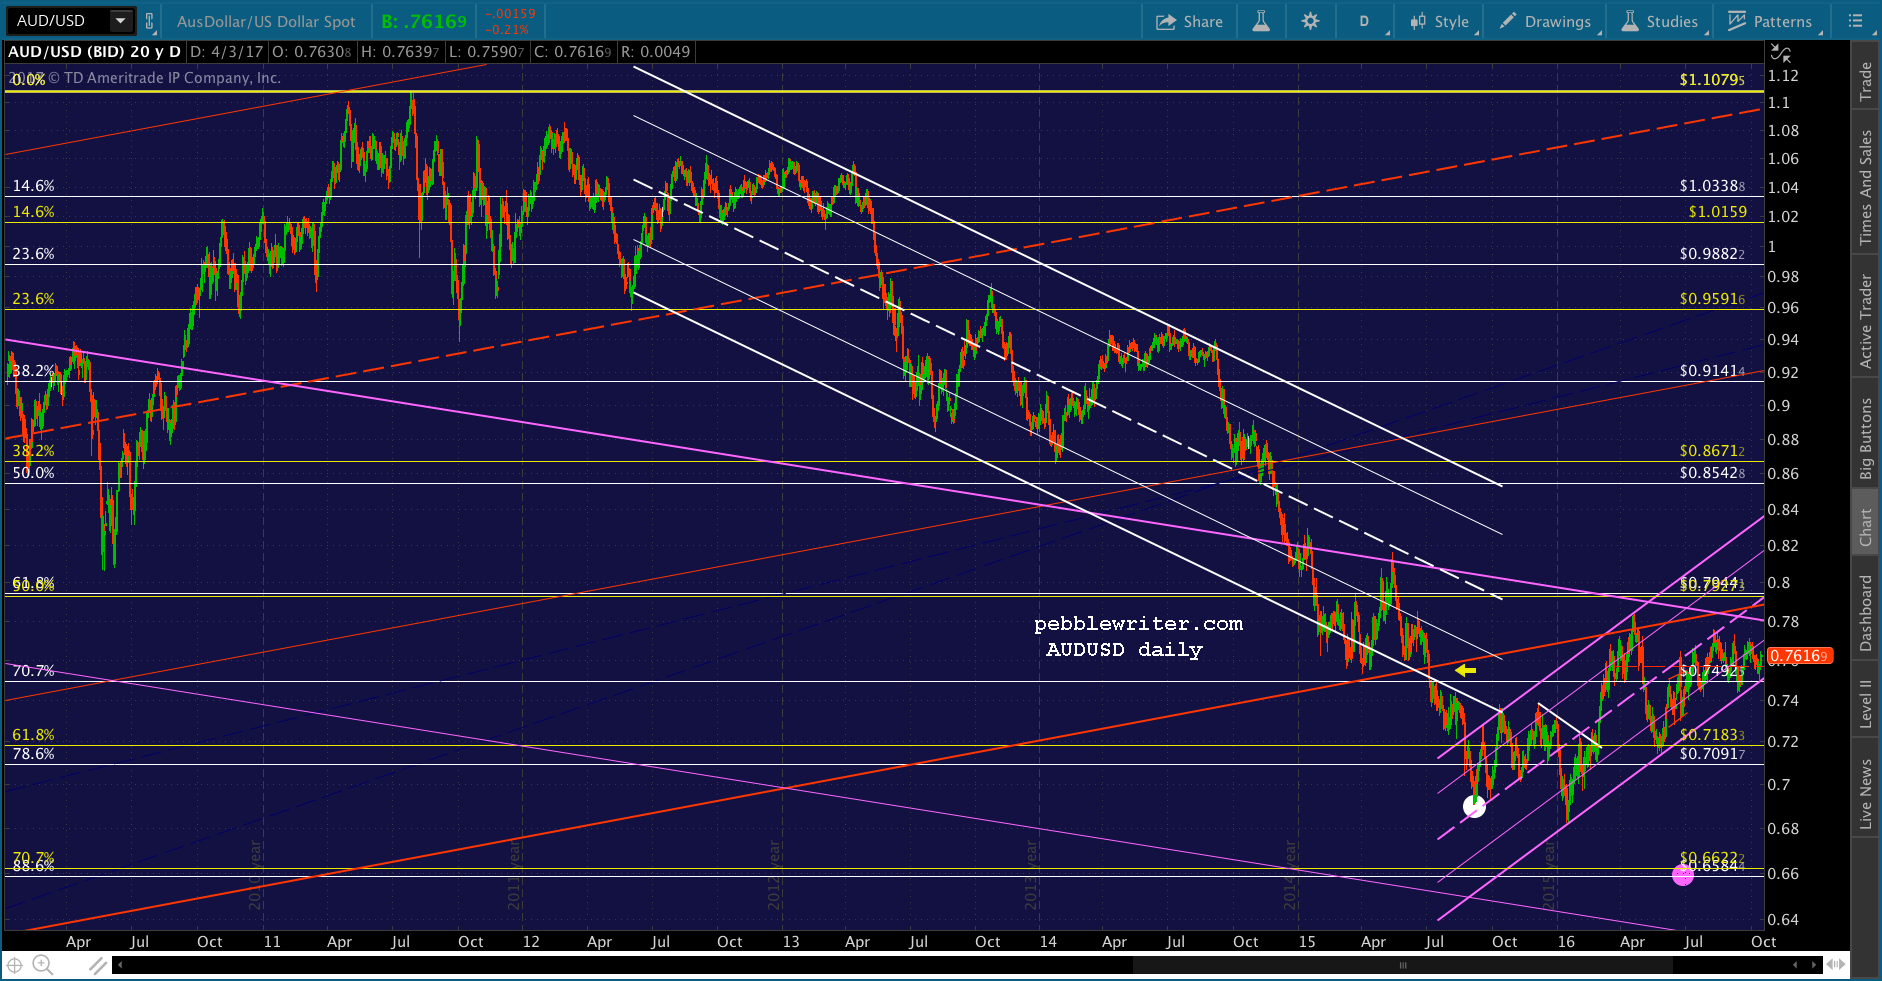
At the time of that last post, AUDUSD had just tagged its 200-day moving average — normally a excellent spot for a bounce. But, it didn’t seem quite ready at the time.
It’s reasonable to believe AUDUSD will bounce strongly off its SMA200, but the falling red channel suggests otherwise. Anyone tempted to trade the bounce would do well to wait for it to clear the SMA100 first. If it can’t, there is much more downside potential. That .886 at .6584 is still out there, waiting.
As it turned out, the pair only bounced for one day before dropping through the SMA200 and spending the next two weeks searching for a bottom. It never made it down to .6584, which is actually helpful in constructing our new forecast.
continued for members...
The problem, at the time, was the lack of a tag on a relevant Fib or — even more troubling — the bottom of the channel from 2001. At this point, it’s not entirely clear which channel should dominate.
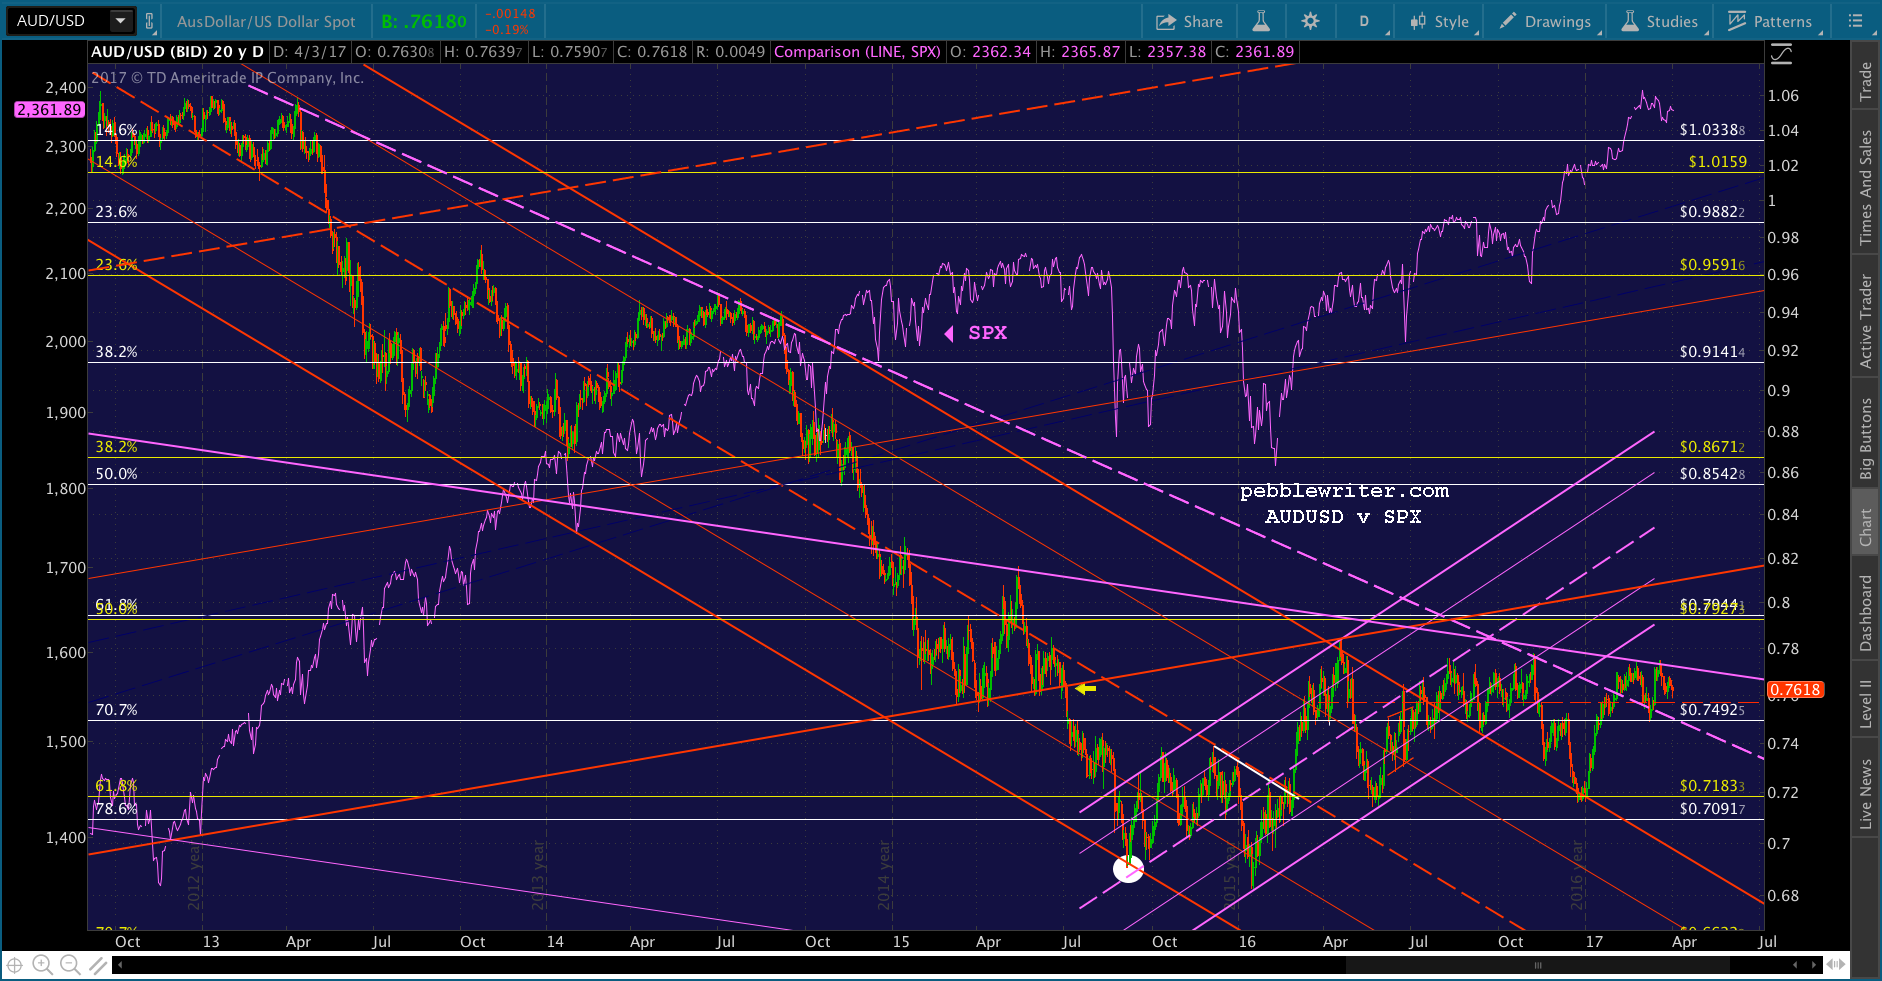
I’ve settled on the two channels highlighted below. While the light blue channel connects two important tops and marked two internal reversals, it has done a horrible job with bottoms.
So, I’m focusing instead on the falling blue channel and the rising red channel. The red channel is bearish as AUDUSD broke down through it in July 2015 and was subsequently backtested.
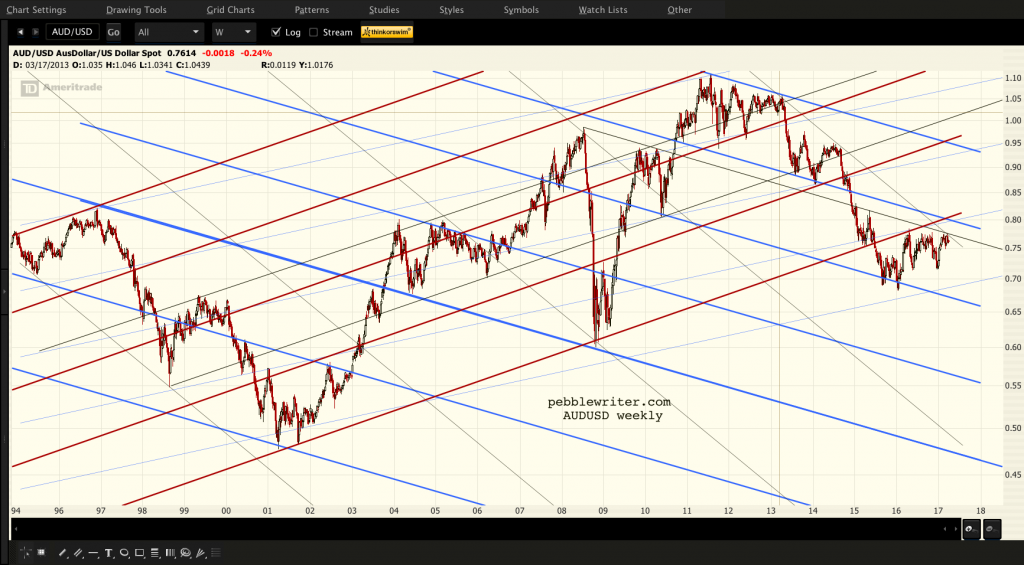
The blue channel is a little trickier. Clearly, it flashed a bearish warning when AUDUSD broke down through one of its lines in Dec 2014. But, that line doesn’t match up well with the 2008, 2010 and 2015 highs. A parallel trend line marked those highs instead.
AUDUSD is back to that parallel TL, and hasn’t yet broken through. Theoretically, it would have potential to bounce up to the blue channel line.
Another way of looking at it is to consider the period Aug 2010 – Dec 2014 as a failed breakout and the recent bounce as a backtest of the channel top. In this case, AUDUSD’s bounce would be considered finished.
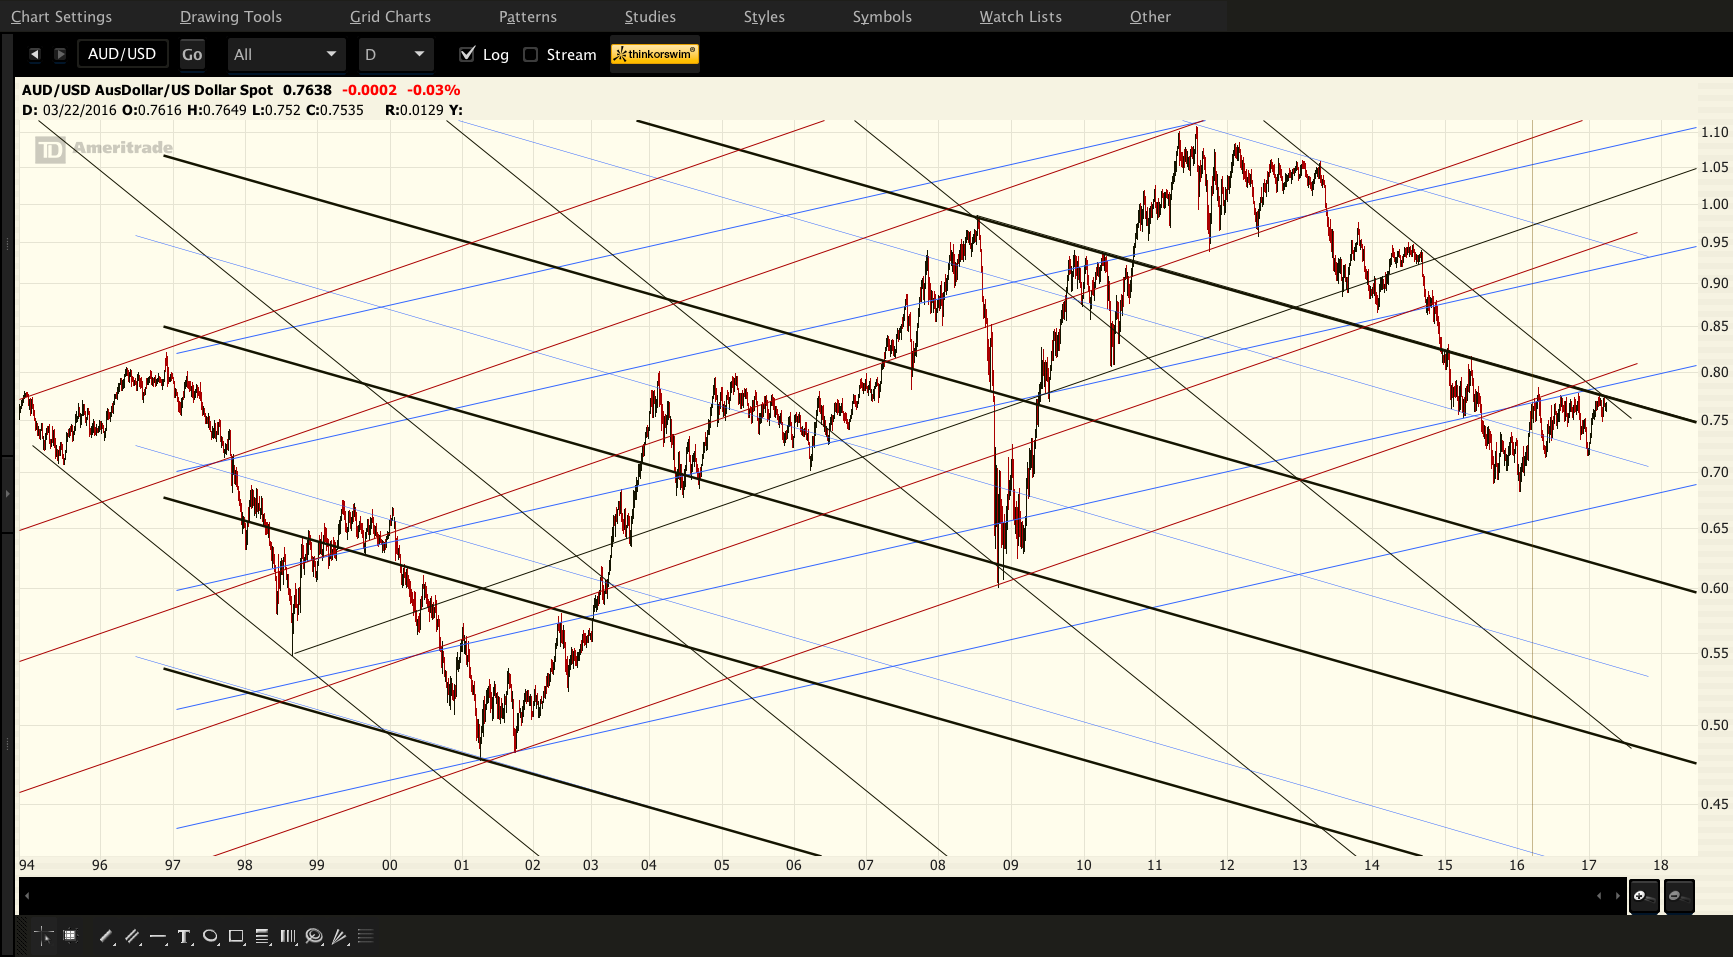 Let’s look at the rising red channel for a moment. If we operate under the assumption that the red channel bottom was meant to hold…
 …we can see that there was a falling white channel which intersected it in early-2015. This would have meant the USD was topping out.
 In fact, in Mar 2015, DX did top out (the yellow arrow) after an incredible run from 80 the previous summer. It didn’t seem completely finished to me at the time, as the .618 Fib was just above at 101.797 (versus its actual high of 100.39.)
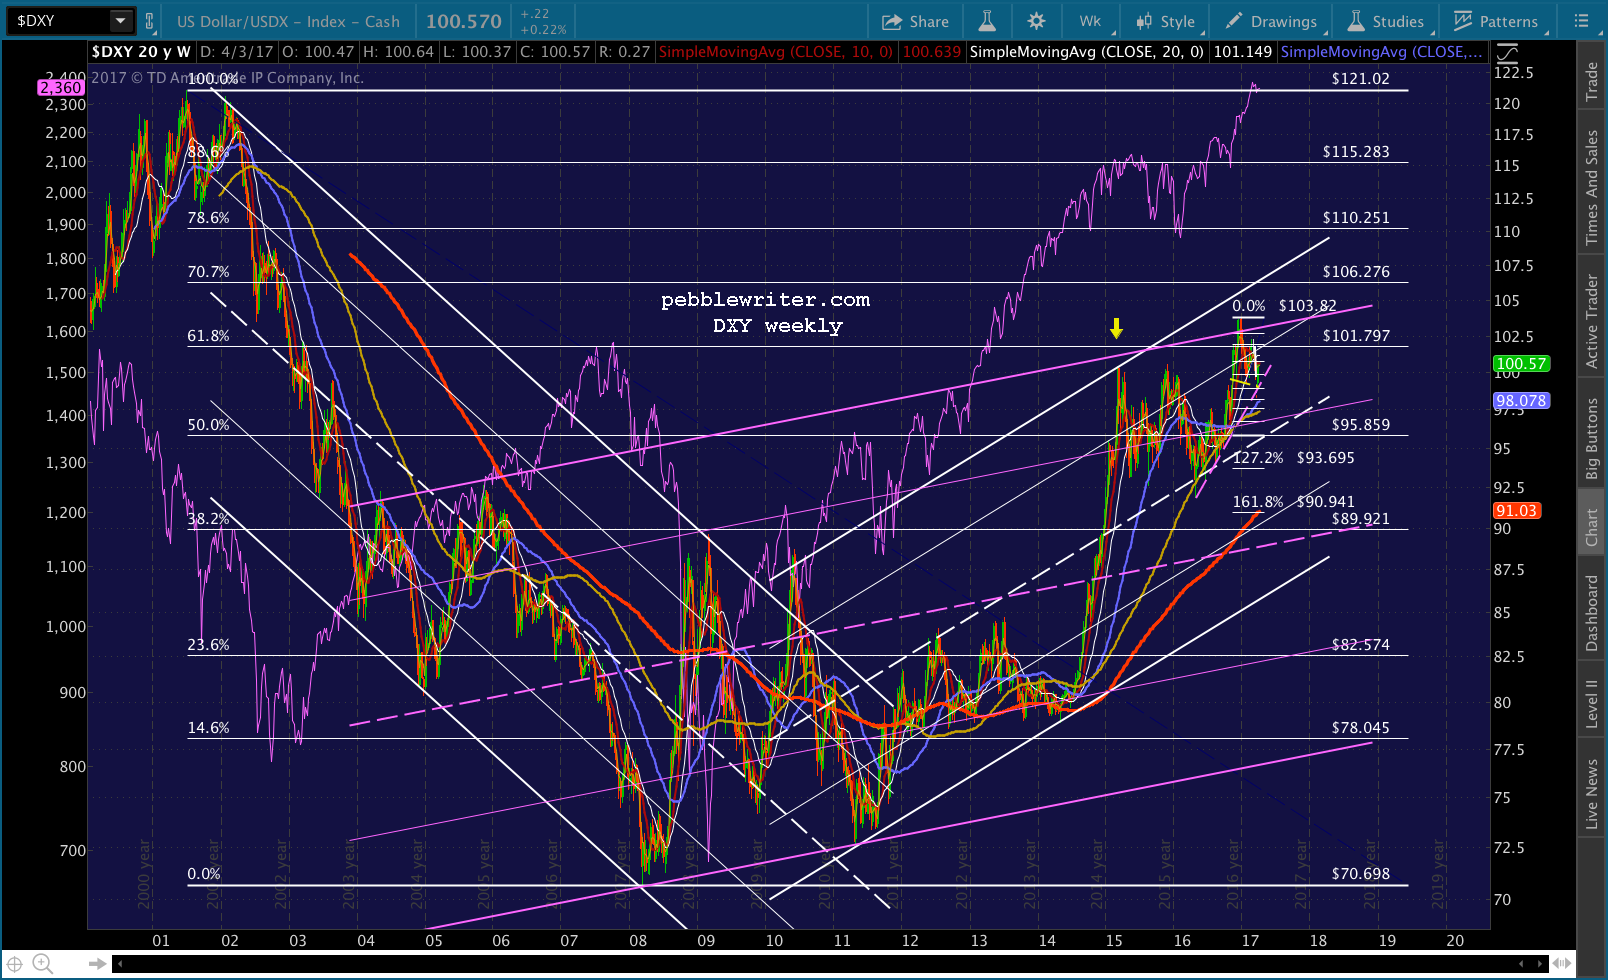 Recall that USDJPY had recently reached a key Fib level at 120.11 (yellow arrow) and was struggling to hold it. Between Dec 2014 and May 2015, it crisscrossed 120 repeatedly, trying to get SPX up past the key 1.618 extension at 2138.
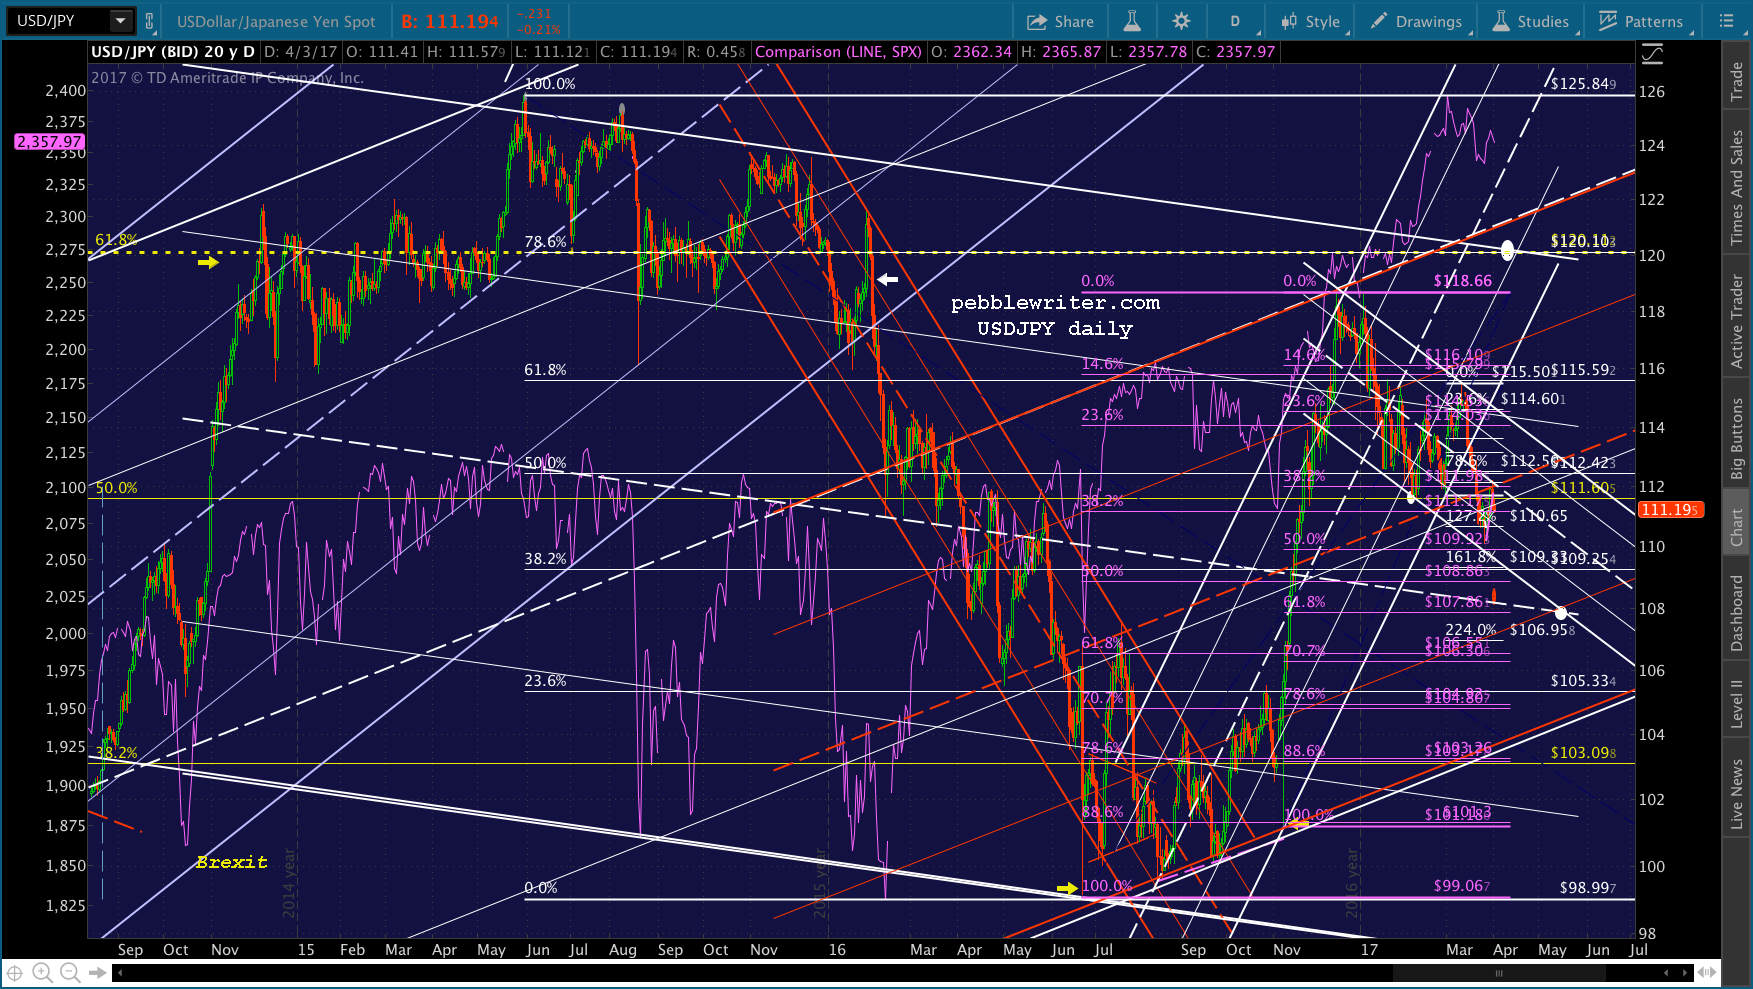 Ultimately, the battle was lost. SPX plunged to 1856 in Aug 2015 and 1810 in Jan 2016. Between those two drops, DX played safe haven and rallied — meaning AUDUSD fell even lower. It broke down through the red channel bottom (yellow arrow) and the falling white channel broke down as well.
We replace the falling white channel with a broader red one — not a great fit, but about the best we can do.
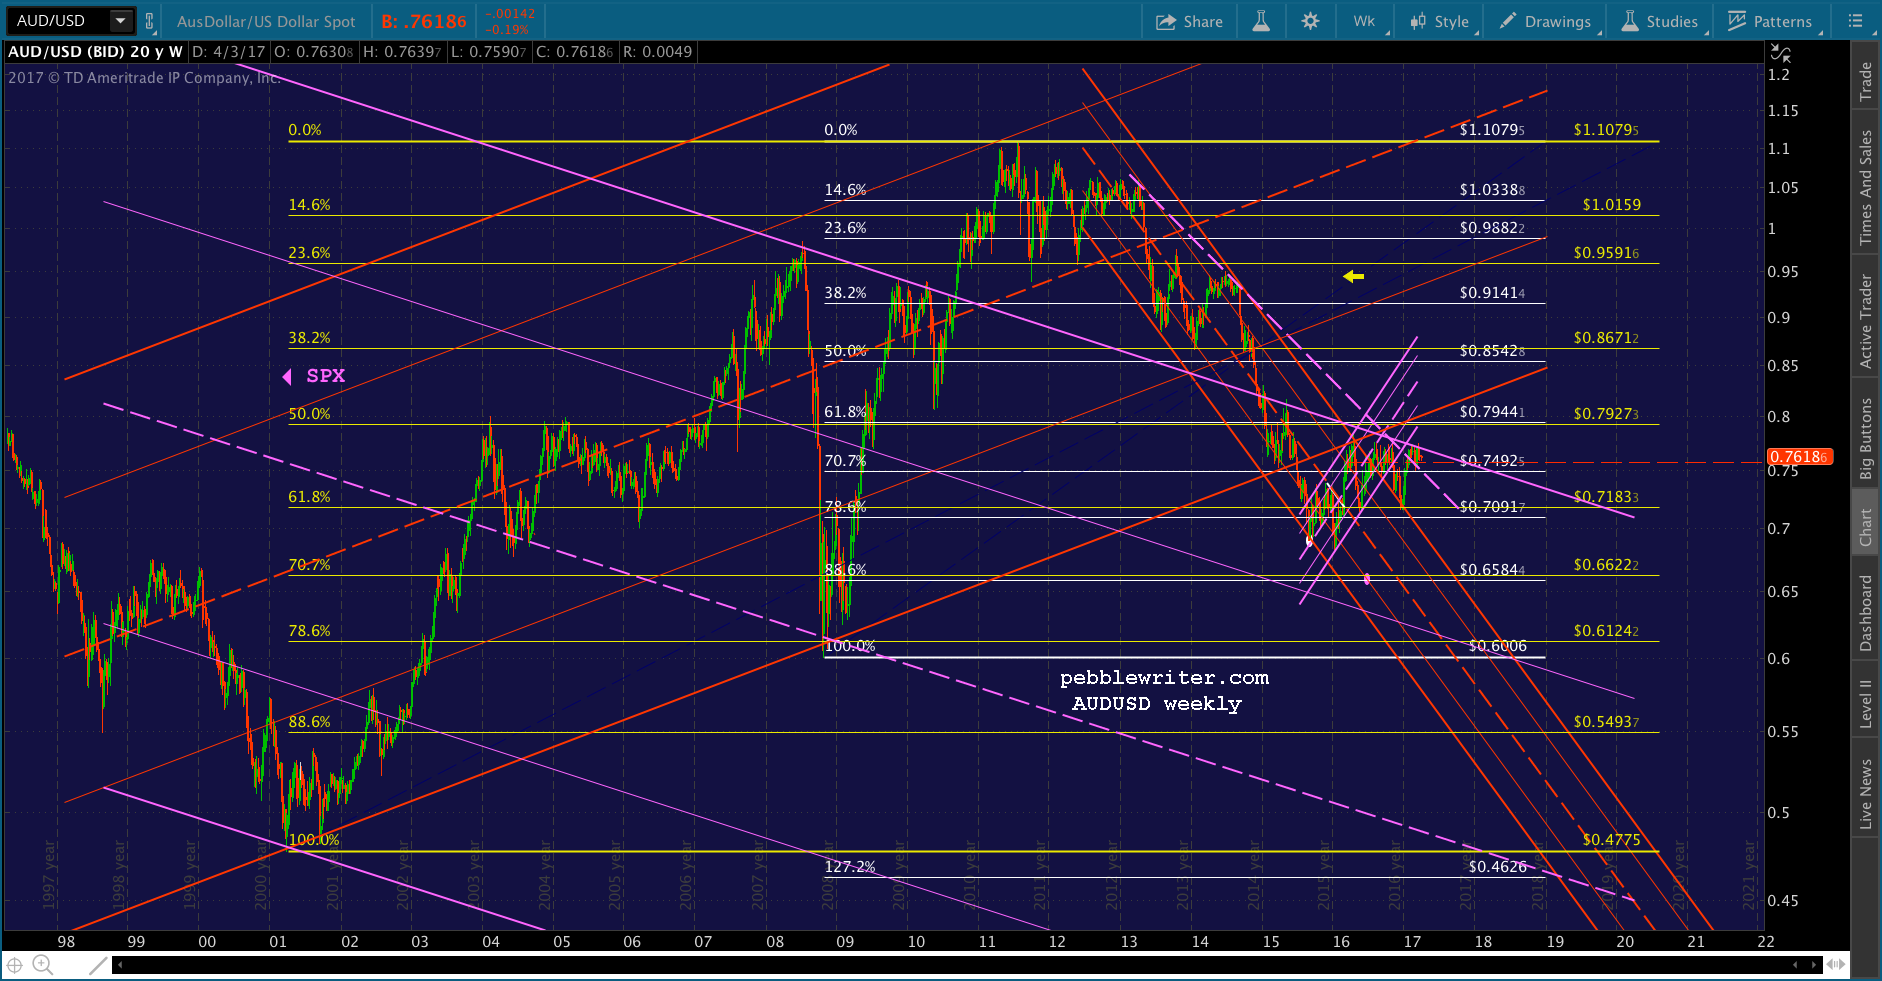
 When a falling channel breaks down, it’s nearly always a very bearish development. Given AUDUSD’s strong correlation with SPX, this breakdown was no exception. AUDUSD went on to drop below two key Fib levels, too: the yellow .618 and white .786.
In Feb 2016, CL took over ramping duties — nearly doubling from 26 to 51 by June. So, DX was allowed to reverse. This enabled AUDUSD to recover some of its losses. But, it ran out of steam when it reached a backtest of the broken, rising red channel (yellow arrow below.)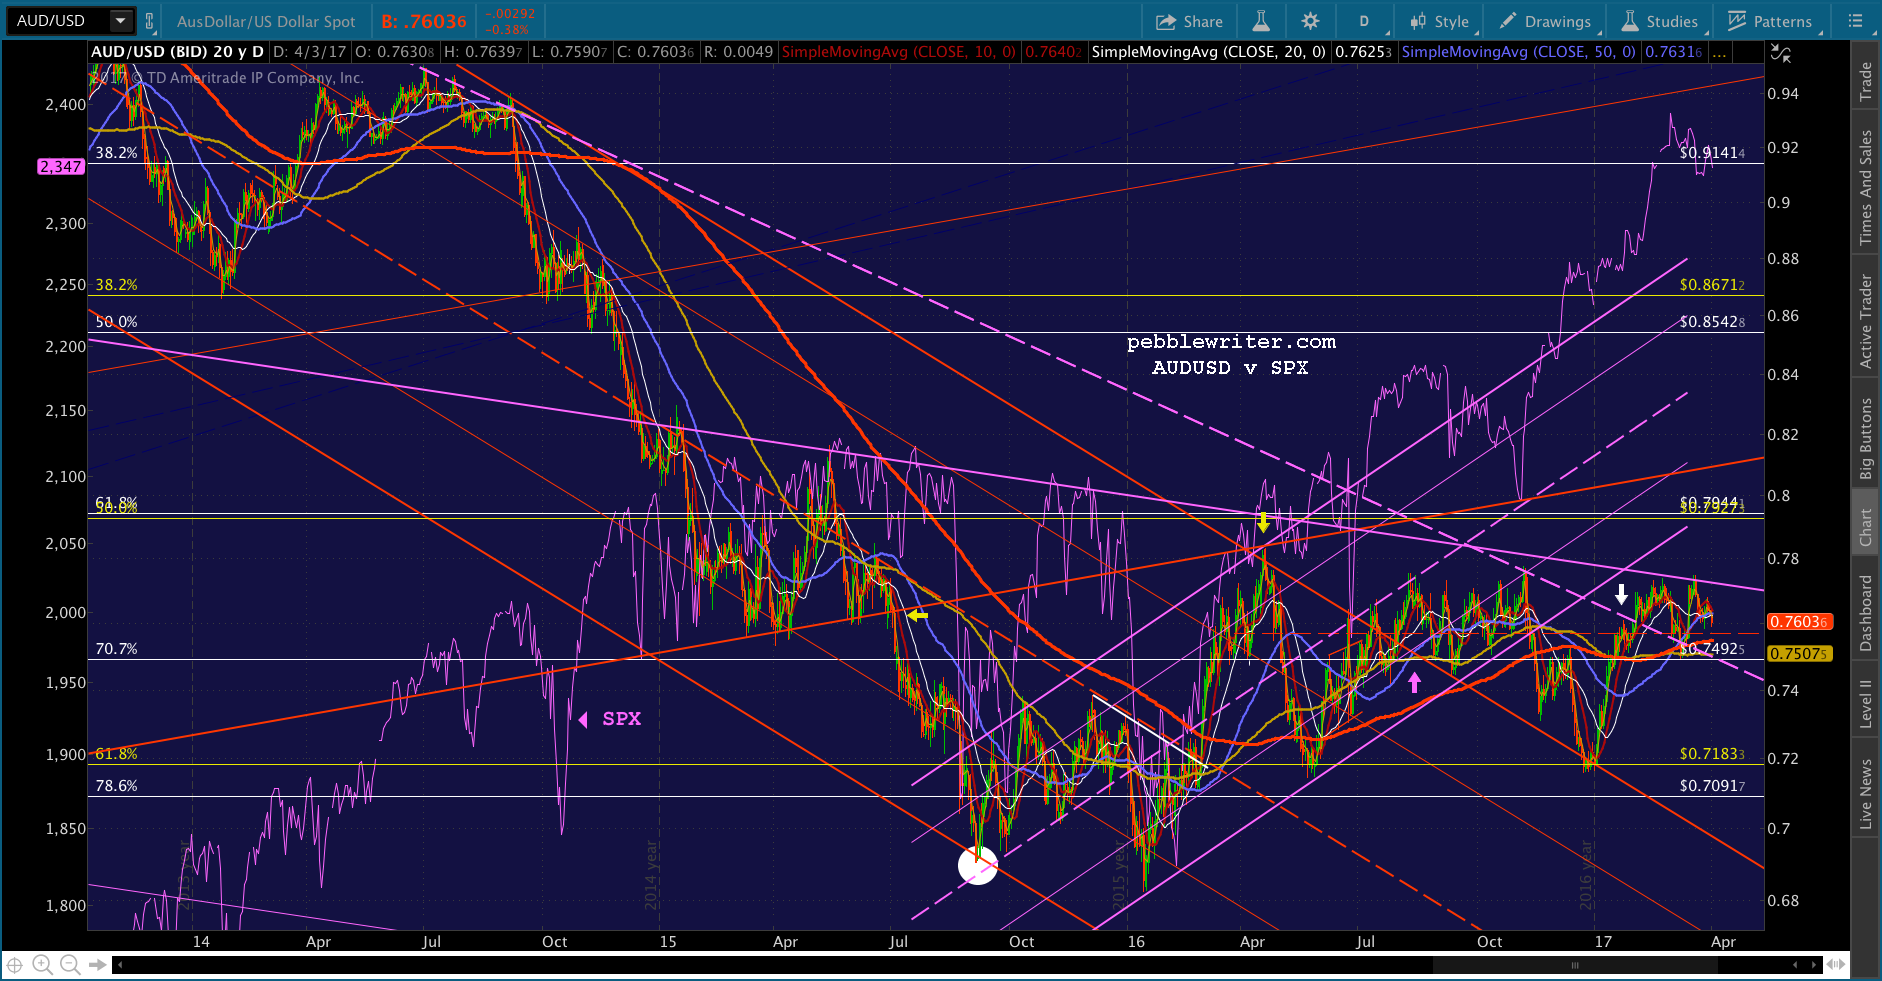 Note that AUDUSD backtested the broken red channel and the top of the new, falling red channel at the same time — about Apr 20, 2016. Following the tag, both it and SPX fell again — though SPX was propped up following the Brexit debacle by the rapidly appreciating CL, VIX and USDJPY.
Note AUDUSD’s breakout from the falling red channel in July (the purple arrow), its backtest of the channel in December, and its subsequent breakout of the purple TL in Feb 2017 (white arrow.)
The rising purple channel guiding its ascent from its Jan 2016 lows broke down in Nov 2016 when DX broke out past its .618 in order to drive SPX higher into the year end. Note that this started off as a defensive move (to recover the election night losses) and ended up being an offensive move (to break SPX back above its pre-election highs and 2138.
From about Oct 10 through the end of the year, SPX and AUDUSD were moving opposite one another as DX rallied sharply with USDJPY’s spike from 101 to 118 (again, the response to the election) between Nov 9 and Jan 3
With the end of the year (as well as 2016Q1) put to bed, and stocks back above resistance (now support) we have to wonder whether or not AUDUSD can maintain its latest bounce. If the falling blue channel and the rising red channel have anything to say about it, AUDUSD’s next move should be lower. But, the various “breakouts” — which have really only gone sideways — argue otherwise.
At this point, we start to overlap with our outlook for stocks in general. Every manipulation conducted in the past 8 1/2 years has been about propping up stocks and, secondarily, minimizing the damage from the various manipulations.
At this point, CL can’t run much higher without creating inflation problems. DX can’t get much higher without choking off trade and encouraging higher interest rates. USDJPY is currently correcting, but will reach support before long. It’s a very complex situation that will certainly involve the USD.
Meanwhile, Australia has its own serious inflation problems as hot money continues to flow in from China and the Far East — inflating real estate, hard asset and equity bubbles. The inflow of cash serves to prop up the Aussie dollar — and should continue to do so until something happens which is “scary enough” to change the dynamics — presumably a correction in equities which, in my estimation, is long overdue.
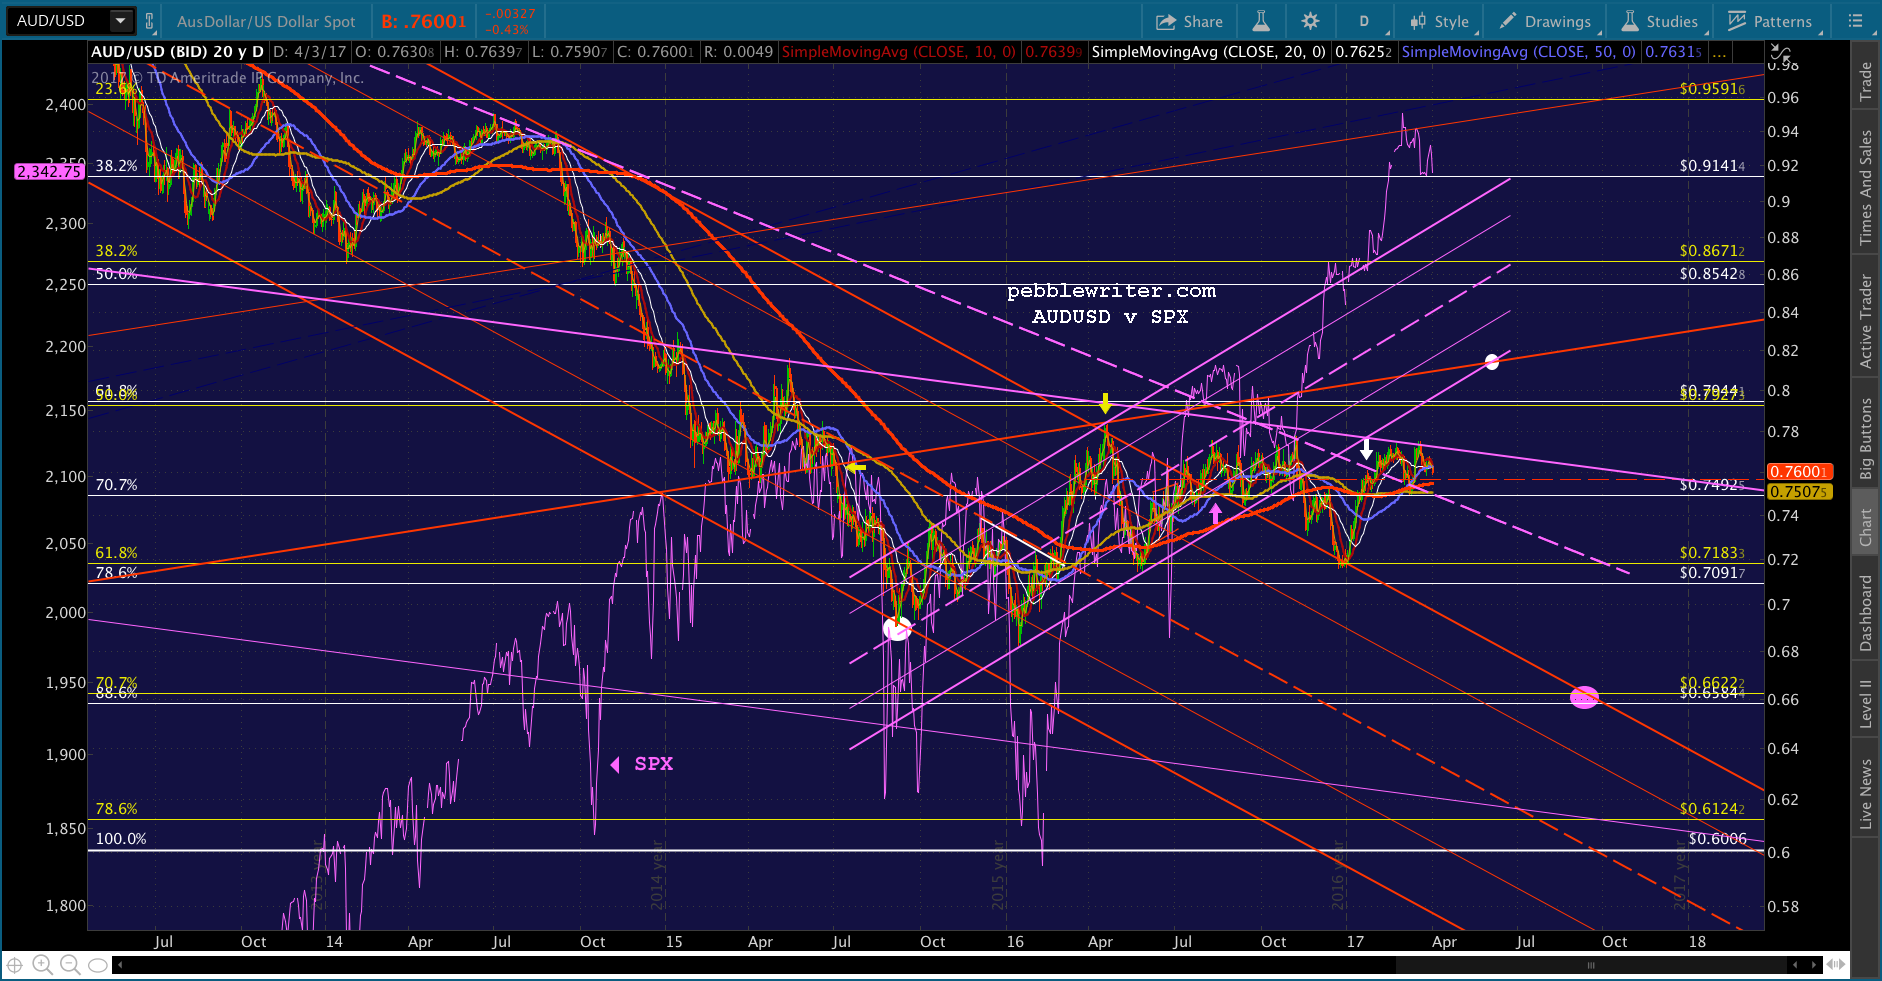 In other words, the little breakouts past the red channel and the purple TL shouldn’t be counted upon to prop up this pair. While it is currently above its SMA200, it is theoretically safe. It could continue rallying to backtest the little (broken) purple channel until it reaches the red channel bottom again in early June at, say, .814 — a 7% increase over current levels.
But, should it drop through the SMA200 at .7546, I would not want to be long at all. There’s plenty of downside potential, starting with .6584 – the .886 Fib retracement of the rise from .6006 in Oct 2008 to 1.1079 in July 2011. Should .6584 fail, the October 2008 lows are all that stand in the way of a test of .5493 – the .886 Fib retracement of the rise from .4775 in Apr 2001 to 1.1079.
GLTA.