UPDATE: 5:35 PM
S&P cuts Spain two notches, from A to BBB+, based on contracting economy…cites declining disposable income, private sector deleveraging, front-loaded fiscal consolidation and an uncertain outlook for external demand in many of Spain’s key trading partners.
UPDATE: 3:25 PM
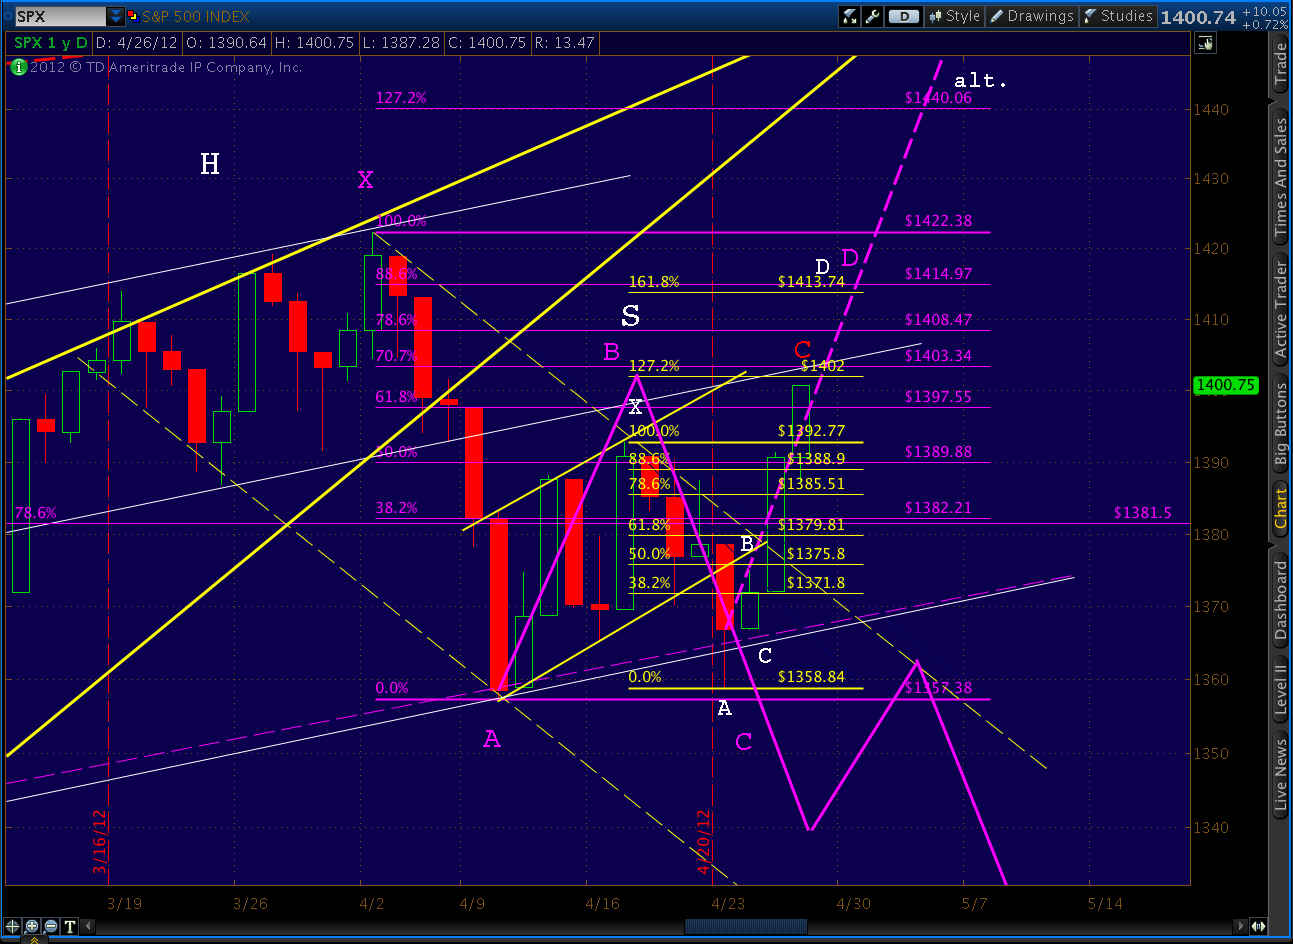
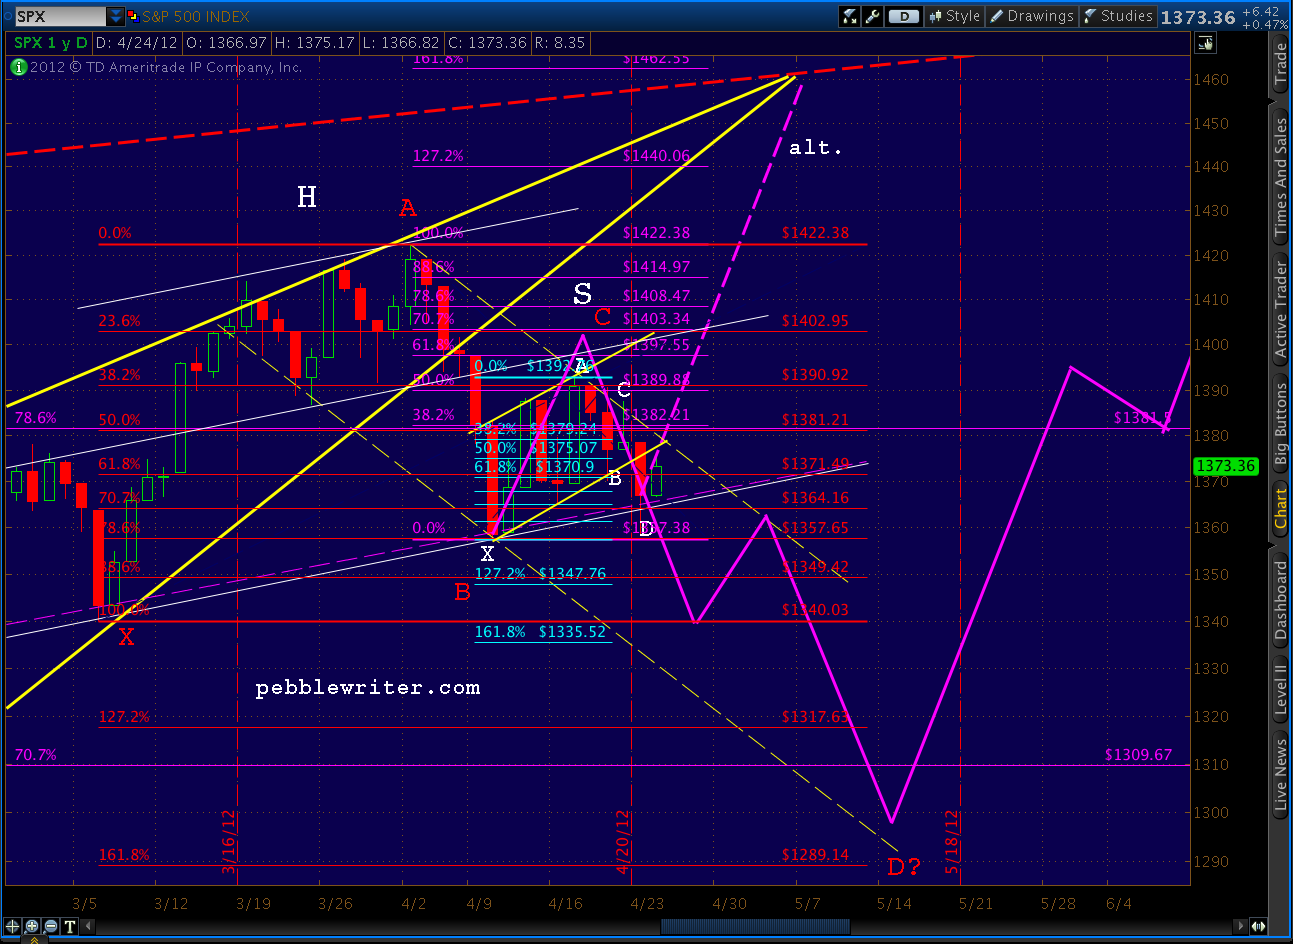
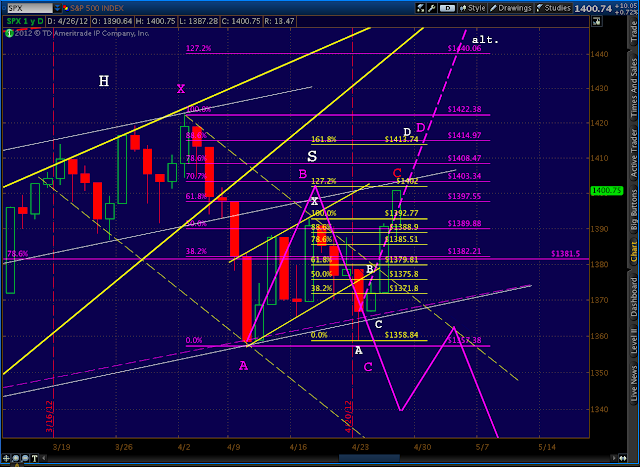
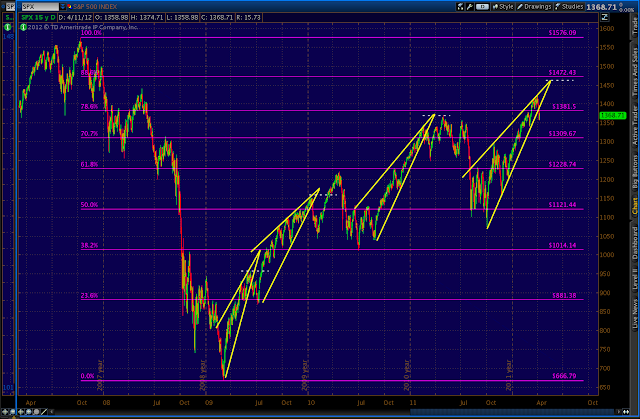
Here’s a close up of the alternative path, which looks stronger with every uptick. I haven’t altered its course since first charting it a couple of weeks ago. Remember, it remains only an alternative until the H&S pattern busts.
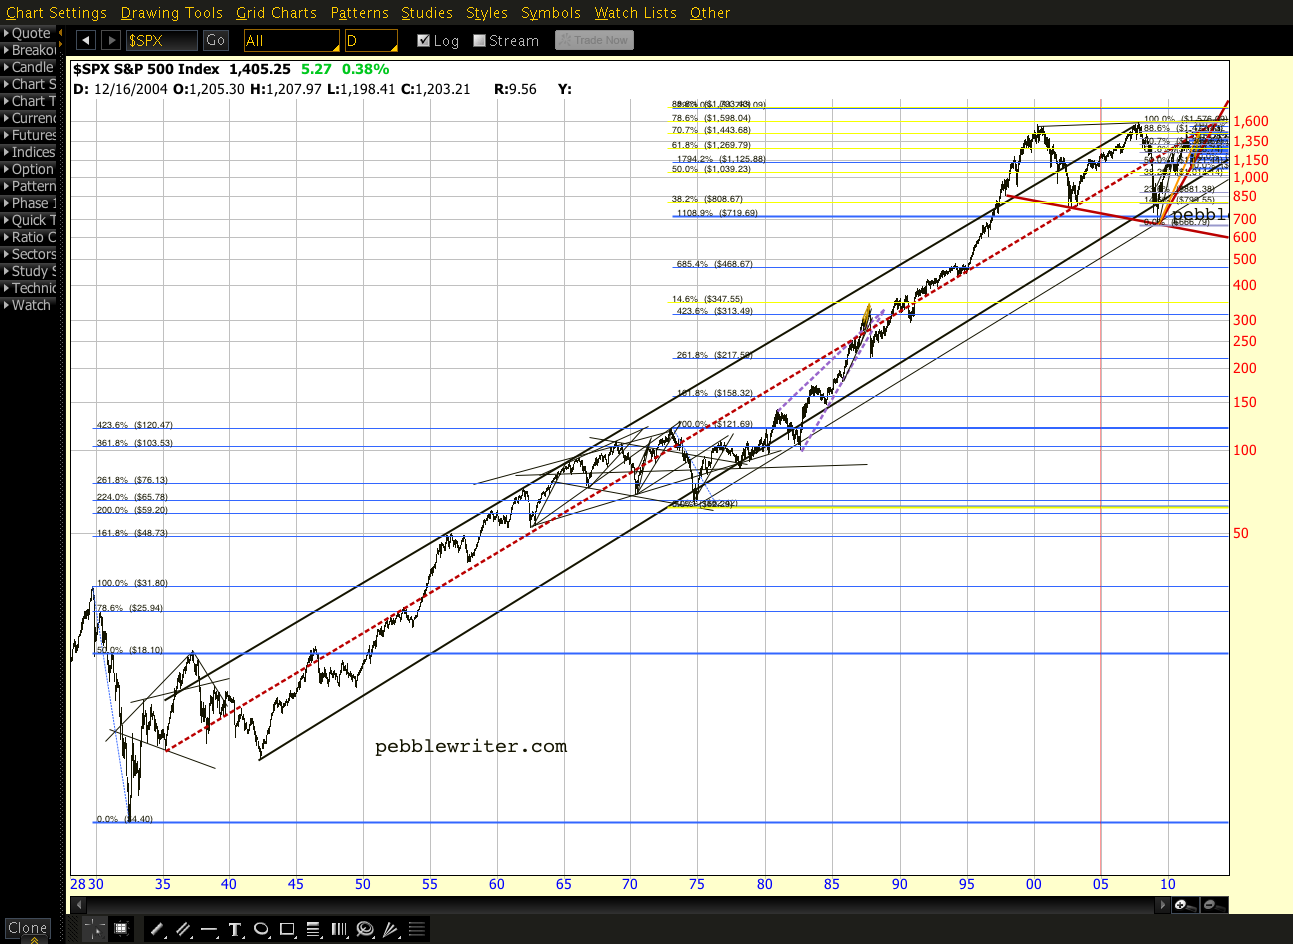
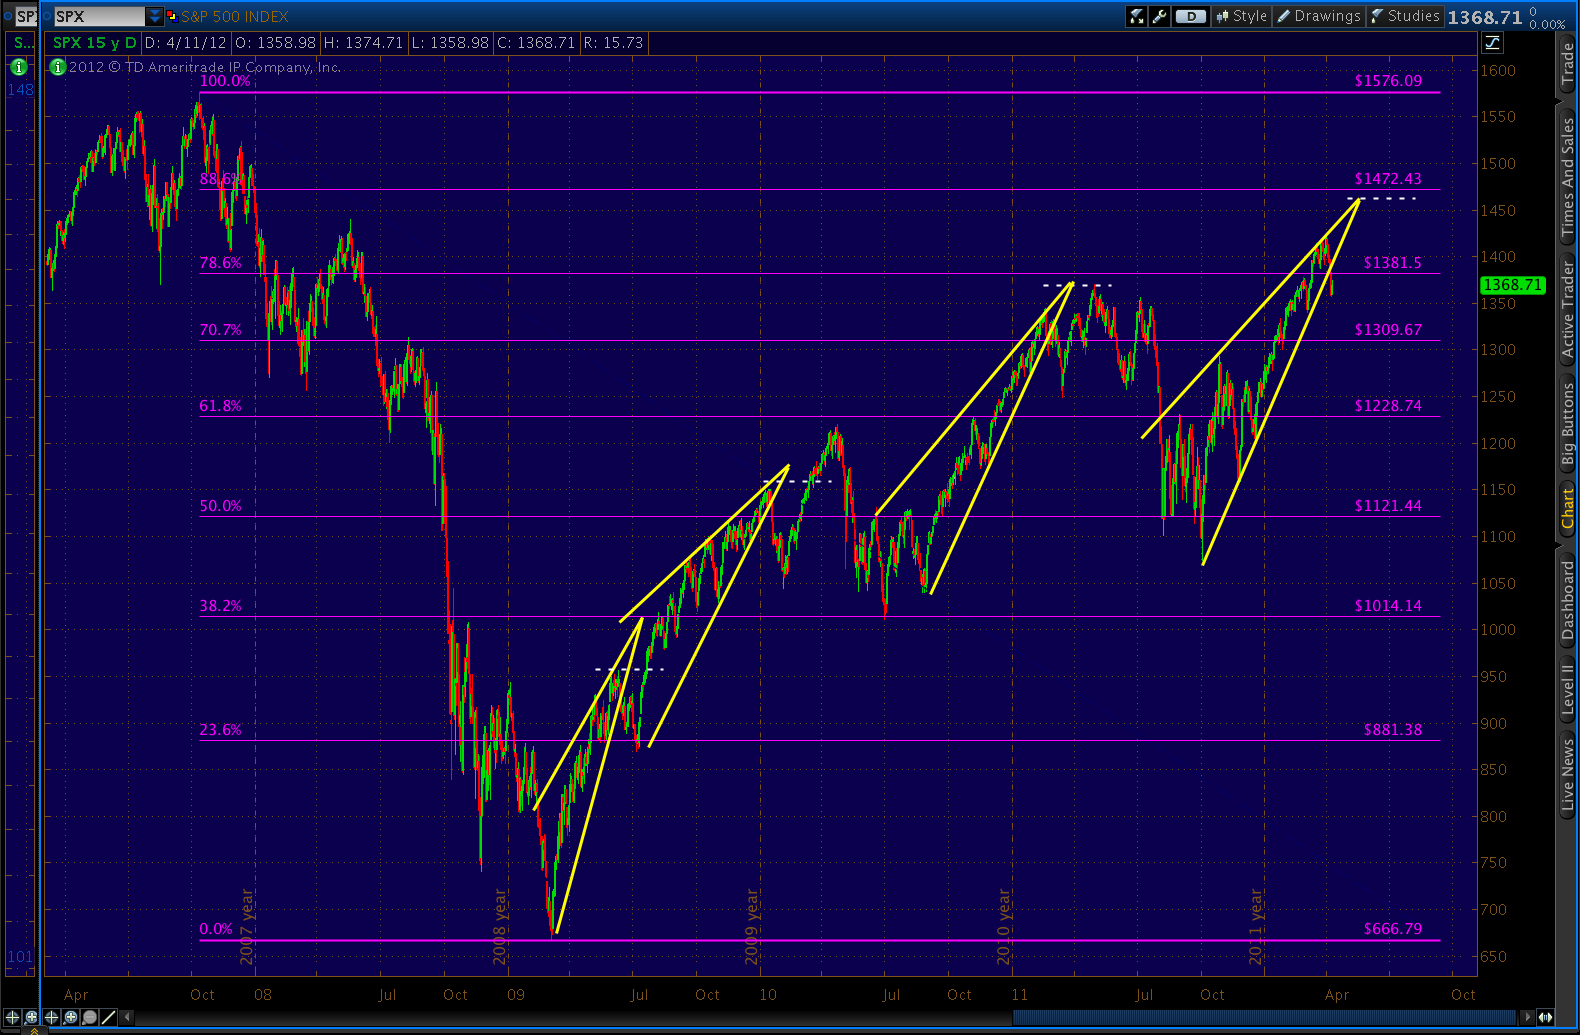
As we originally discussed, the thick, red dashed line is our target. It’s the center line of a channel that goes back to 1935. Really. The rising wedge apex intersects with it at around 1462, which is the 1.618 extension of the purple Crab pattern detialed below (Point X at 1422.38).
FWIW, it’s also the 3.000 extension of the small Crab pattern (yellow) nestled in the B-C-D legs of the larger Crab.

UPDATE: 3:15 PM
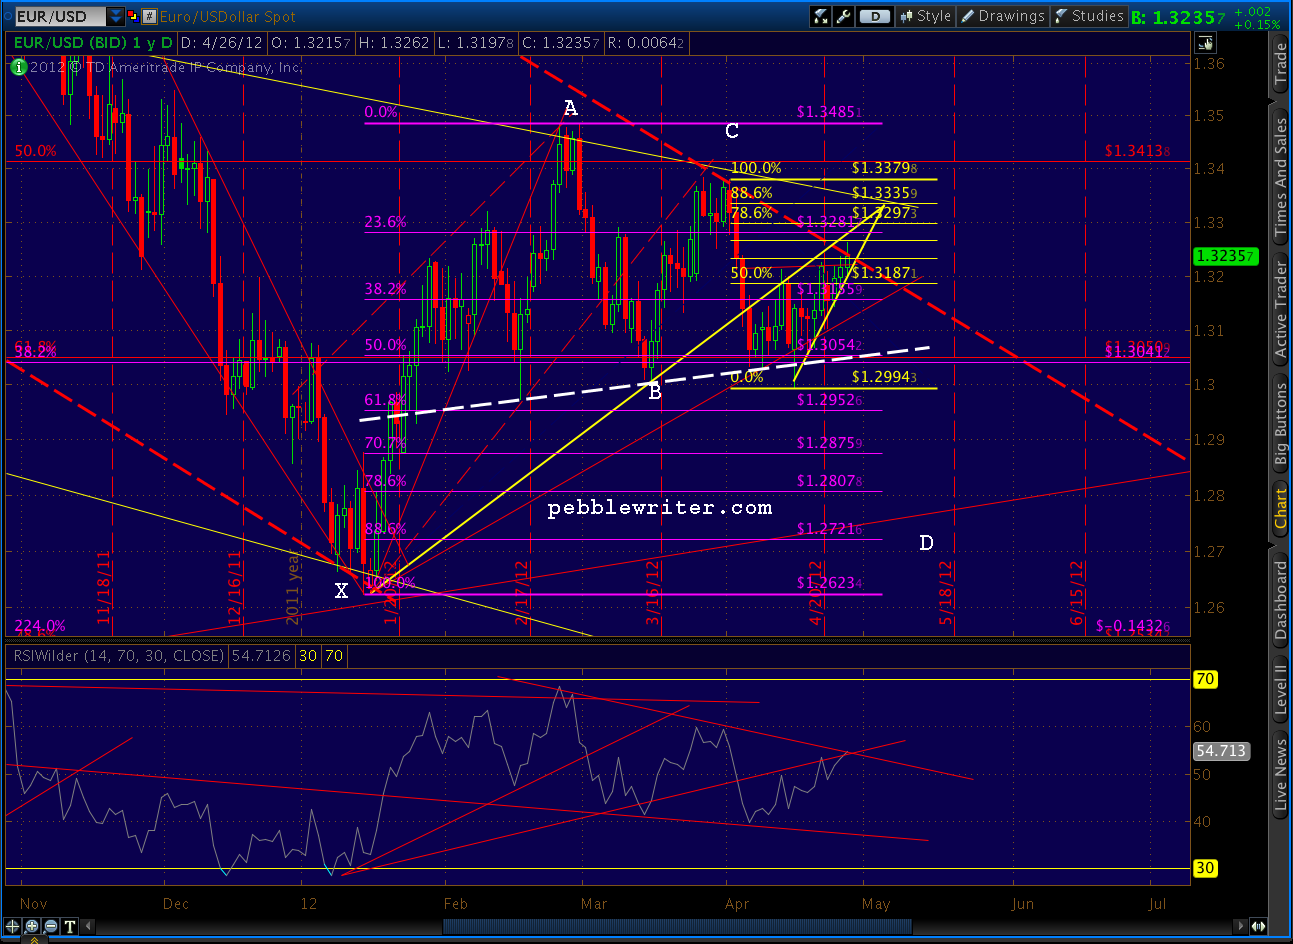
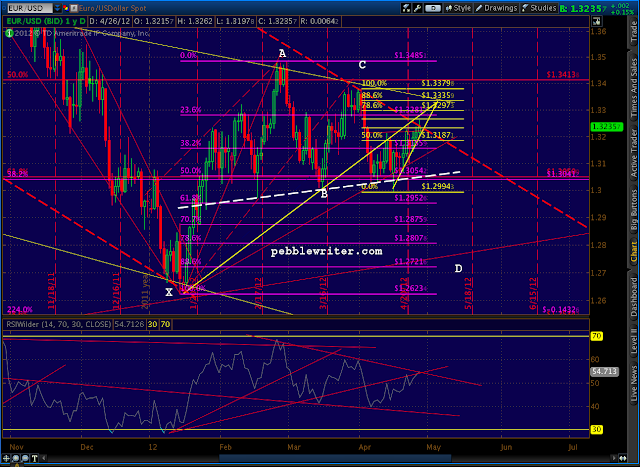
Interesting that today’s ramp has come without any help from the euro zone. EURUSD continues to stall at the channel line discussed in this morning’s update on the euro.
ORIGINAL POST: 1:45 PM
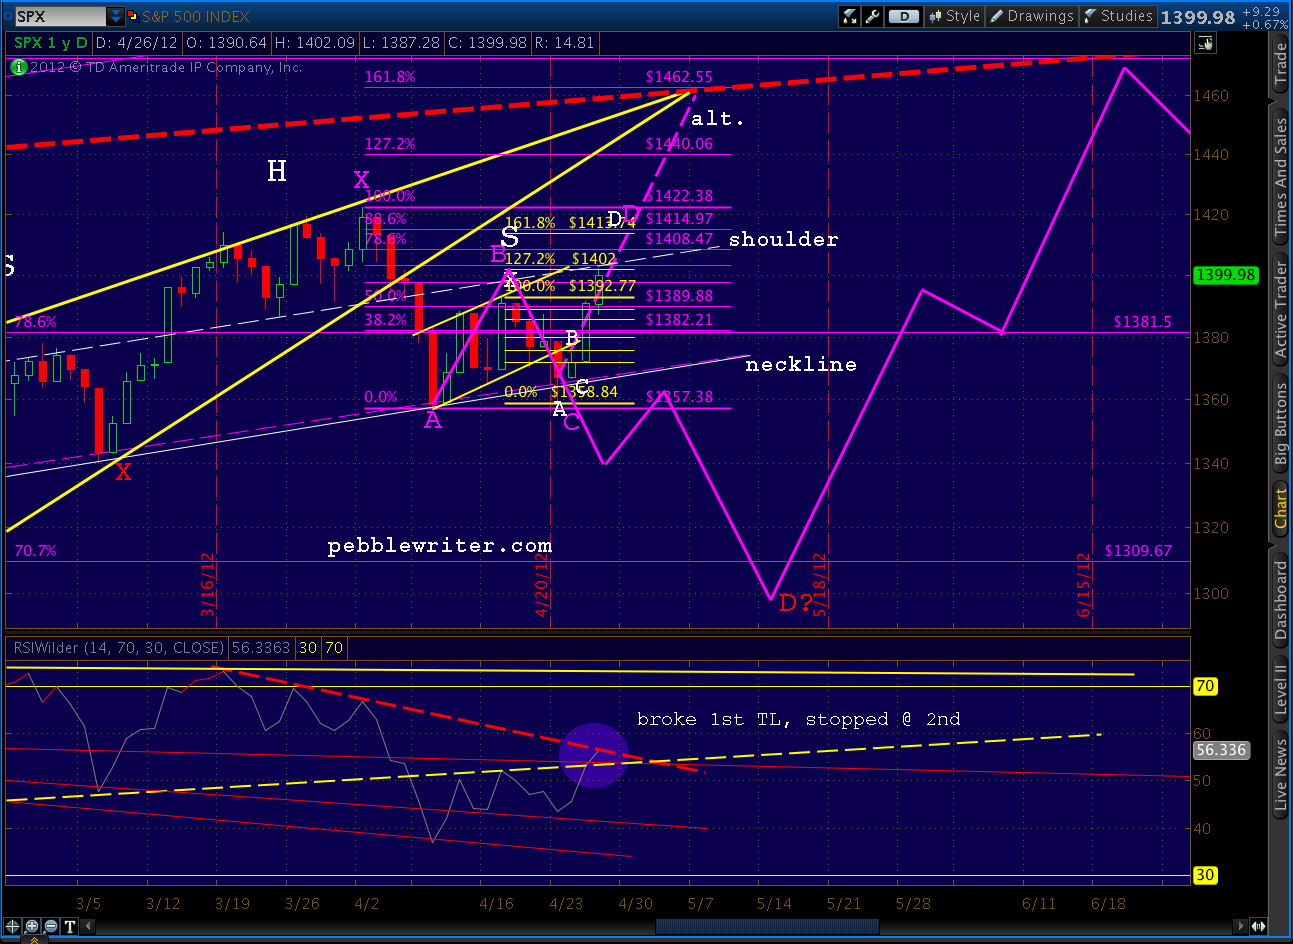
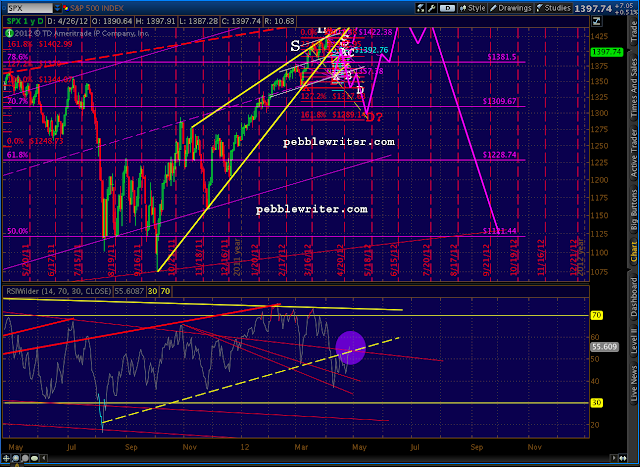
Yesterday we examined the fact that SPX had broken a 26-session channel and was in danger of following our alternative forecast higher — the purple dashed line marked “alt.” in the chart below. Remember, that alternative calls for a strong move to 1462-1472 in short order, while the analog calls for a breakdown first.
We took a close look at the RSI trend line that, broken back on the 5th when the rising wedge was broken, was being back tested big time. I mentioned I’d be watching it like a hawk, as I felt it would hold the key to which way this confusion resolves.
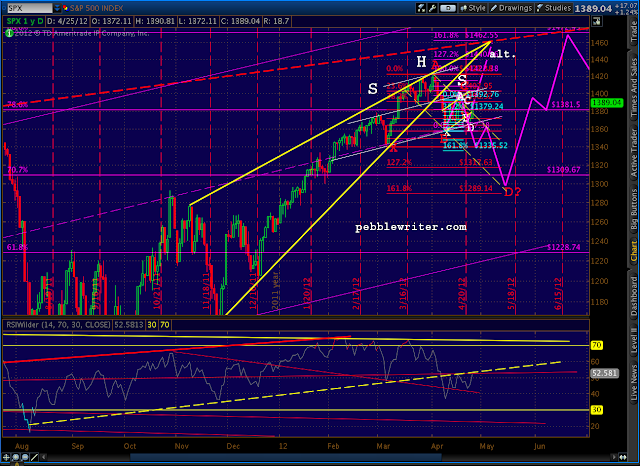
As of right now, that RSI trend line is being broken. While it’s possible this is an intra-day head fake, I’m not so sure that I’m willing to bet cold, hard cash. Note the highlighted circle on the RSI portion of the chart below.
And, expanded here…
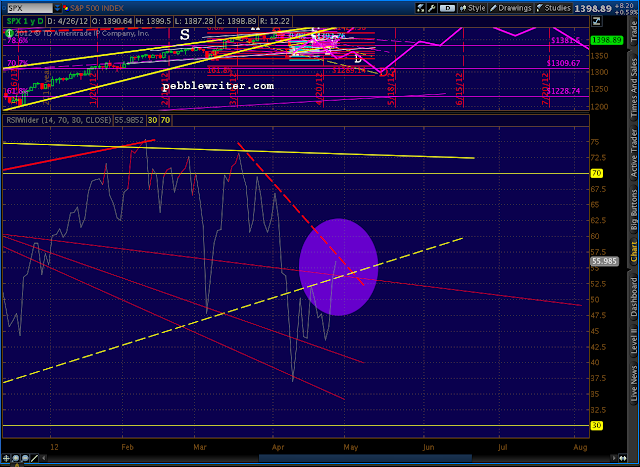
There is the possibility that the downward sloping red, dashed TL will catch it on the way up, but the yellow TL just broken was a major feat. A close above the TL would imply a definite momentum shift.
From a bearish perspective, one small Bat pattern that indicated more downside busted when we moved above 1392. The larger Butterfly (labeled in red) will need its Point C moved over to today’s high, but won’t bust until/unless we exceed 1422 (where C > A.)
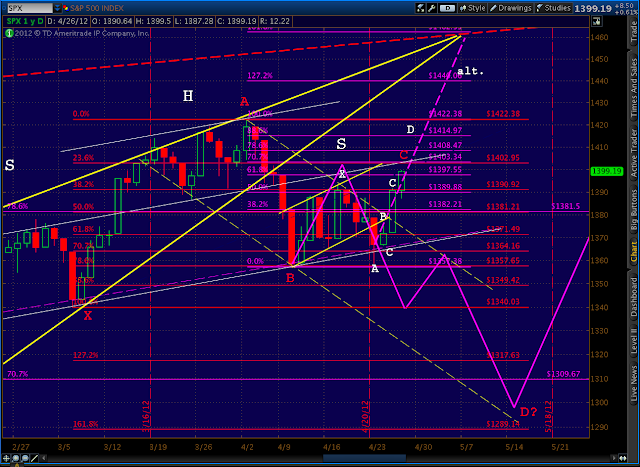
From a bullish perspective, the Bat/Crab pattern marked below in purple correlates very well with the smaller yellow Crab — which, until this morning, was just a Bat. Remember, Bats terminate at the .886 retracement, and Crabs at the 1.618 extension (or more).
The small yellow Crab’s 1.618 is 1413.74, while the larger purple Bat’s .886 is 1414.97. When two targets are in such close proximity, it lends additional credence — all else being equal. Technically, we could get a move to 1414ish and still have a valid H&S pattern, but as we discussed yesterday, it puts additional strain on the pattern — and the analog — playing out, unless we see a very quick reversal.
As we approach 1400, the market should at least pause. It’s the original H&S “idealized” shoulder line, the 1.272 of the small Crab pattern, and a nice round number. But, unless we reverse in the next hour and see that RSI dip back below the TL, I’m increasingly positive about a move to at least 1414-1415 to fulfill the Crab and Bat.
Remember, this is still a back test of the rising wedge. But, I’ve been studying rising wedges a lot lately; and, as we discussed many times [see: In a Fix], it’s not uncommon for a back test to go on up and tag the original apex — faking out all who were playing the broken wedge.
More later.