

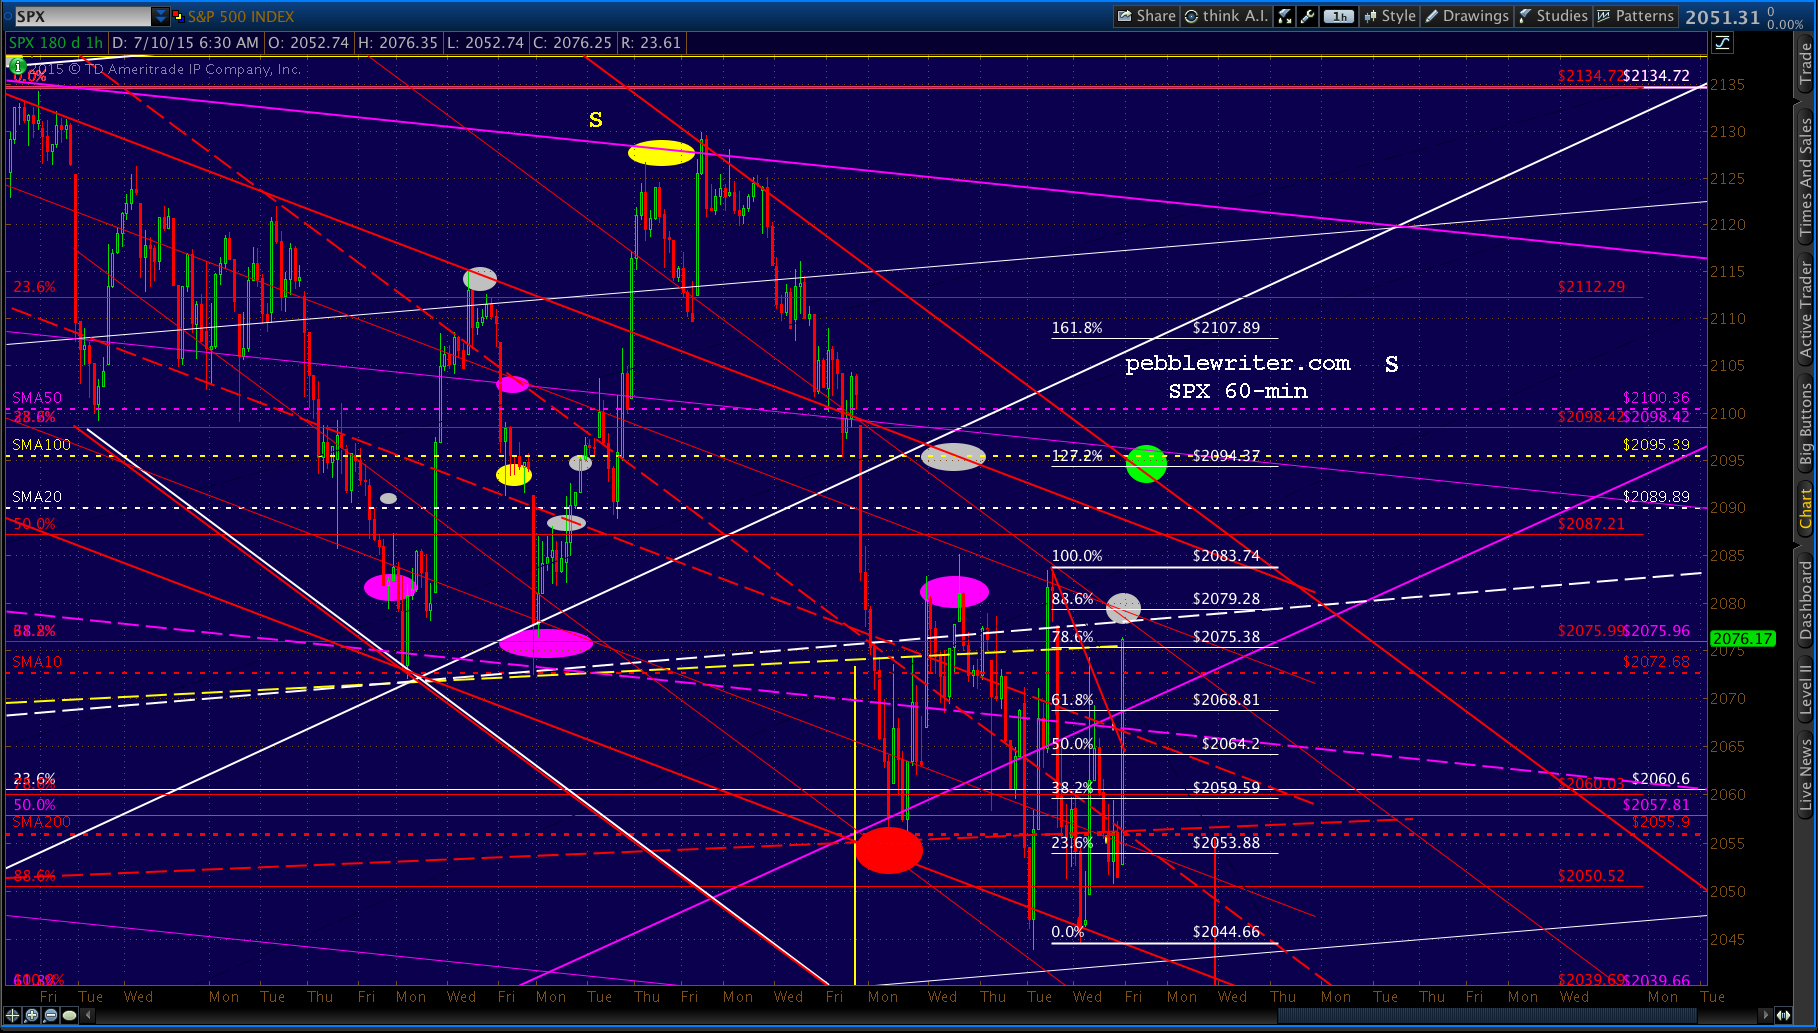
We had a successful outing yesterday, with the decision to short at 2074 rewarded with a move to our first downside target of 2055 and even our second one at 2051. From yesterday’s members section 10 minutes into a very strong opening:
I’d try a short here at 2074 with an objective of the SMA200 at 2056 — also a .618 retrace from yesterday’s lows.
As for today, we had strong overnight moves in USDJPY… and EURUSD…
 …which have led to a 26-pt ramp job in the eminis. Look for SPX to easily reach yesterday’s upside targets.
continued for members…
Initial resistance should come at the yellow H&S neckline at 2075, followed by the white channel midline/ .886 combo at 2079ish, followed by the SMA20 at 2090 and, if things get rolling, the SMA100 at 2095.
 Note: the EURUSD, which provided much of this morning’s upside, may have already played out. It has backtested the white .618 as well as a (red) trendline from the April lows. USDJPY, on the other hand, has further potential up to 123.02.
 UPDATE: 9:34 AM
 Note that the USDJPY has had a serious exuberance event this morning. So, the ramp job is one that is intended to carry over into market hours.
 Here’s an updated chart showing the Fib patterns relative to last Friday’s high of 2129.87 (white grid) as well as the all-time high of 2134.72 (purple grid.)
Note, first, that SPX is backtesting the purple channel bottom. Note, also, that the red 1.272 (a Butterfly Pattern on the red grid) and white .618 are very close to one another at the falling red channel top (yellow target.) This represents a very appealing target if SPX can catch a bounce at 2068-2072.
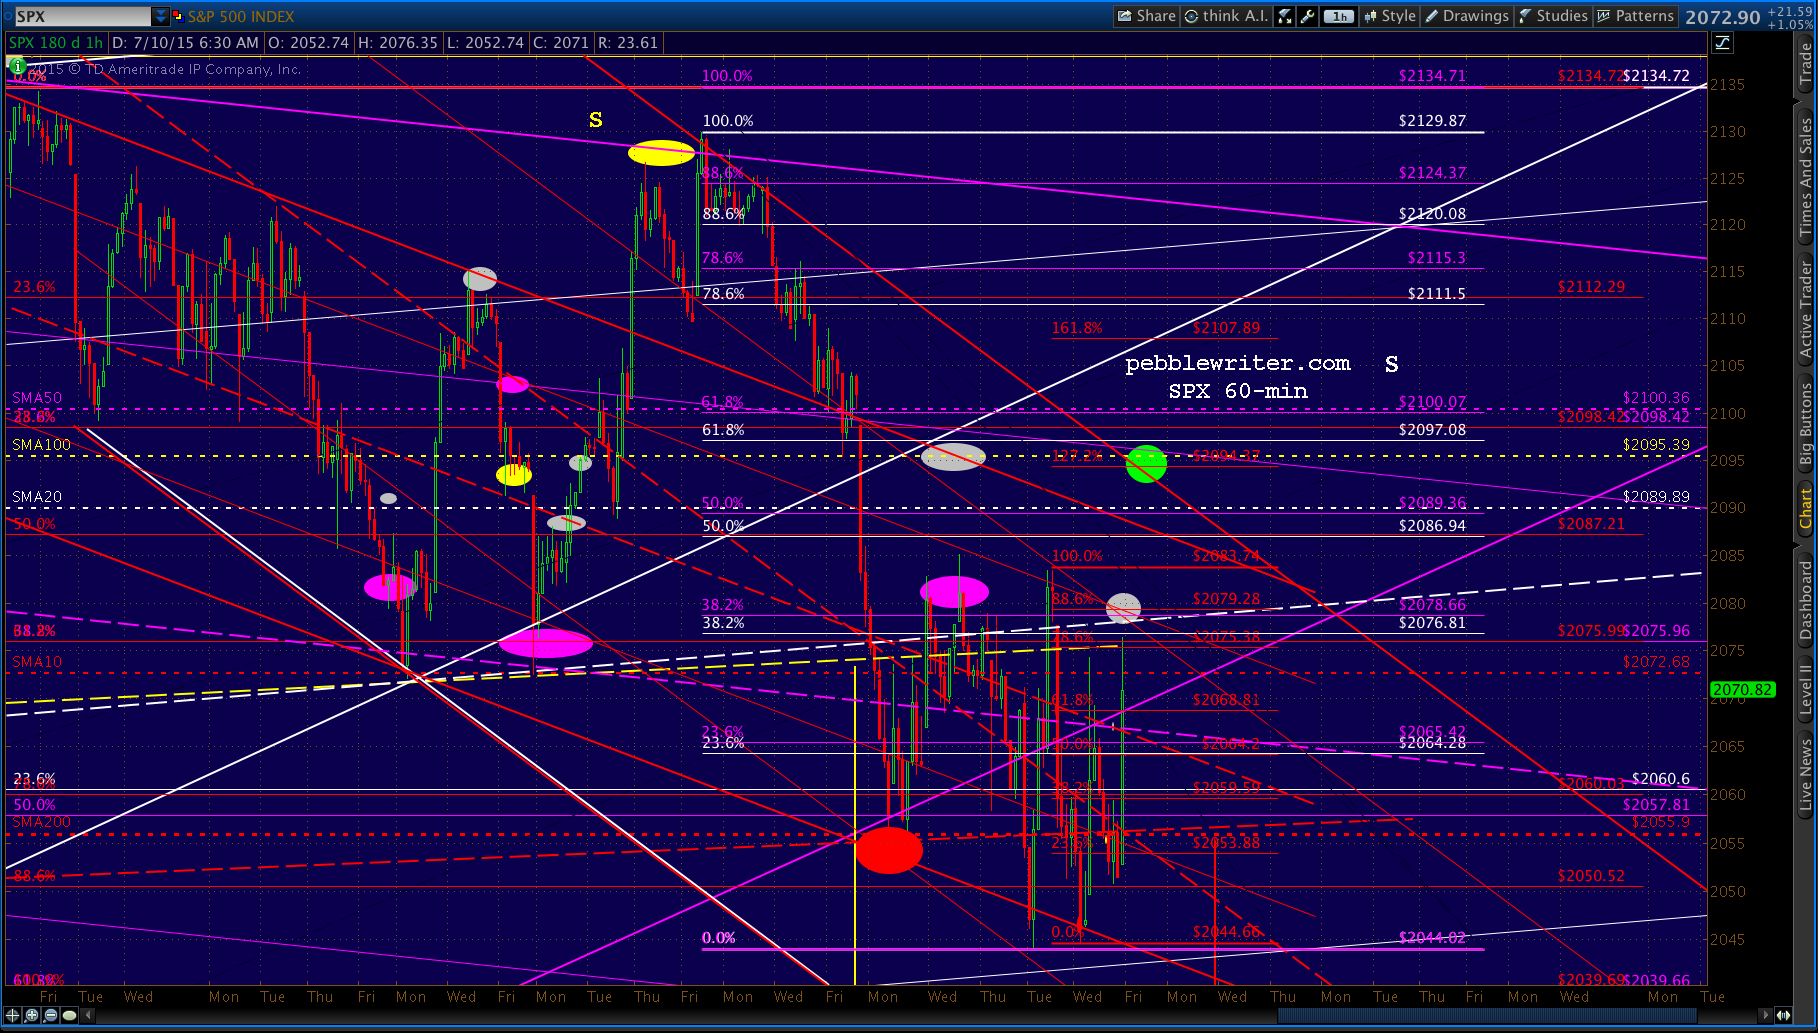 Of course, if SPX can’t clear 2076-79, this would have very negative connotations for the bulls as it would represent two separate backtests of a pattern that targets 2008.
UPDATE: 11:00 AM
 Keep a close eye on the USDJPY 5-min chart for signs of the algo-fest shutting down.
 UPDATE: 11:38 AM
We’re hitting a little turbulence here with the European close. The key is getting past this morning’s high at 2076.35 and then the channel line at 2077ish. But, there’s a lot more resistance after that: the red .886 at 2079.28, the white channel midline, etc.
 UPDATE: 11:49 AM
 UPDATE: 12:35 PM

UPDATE: 1:50 PM
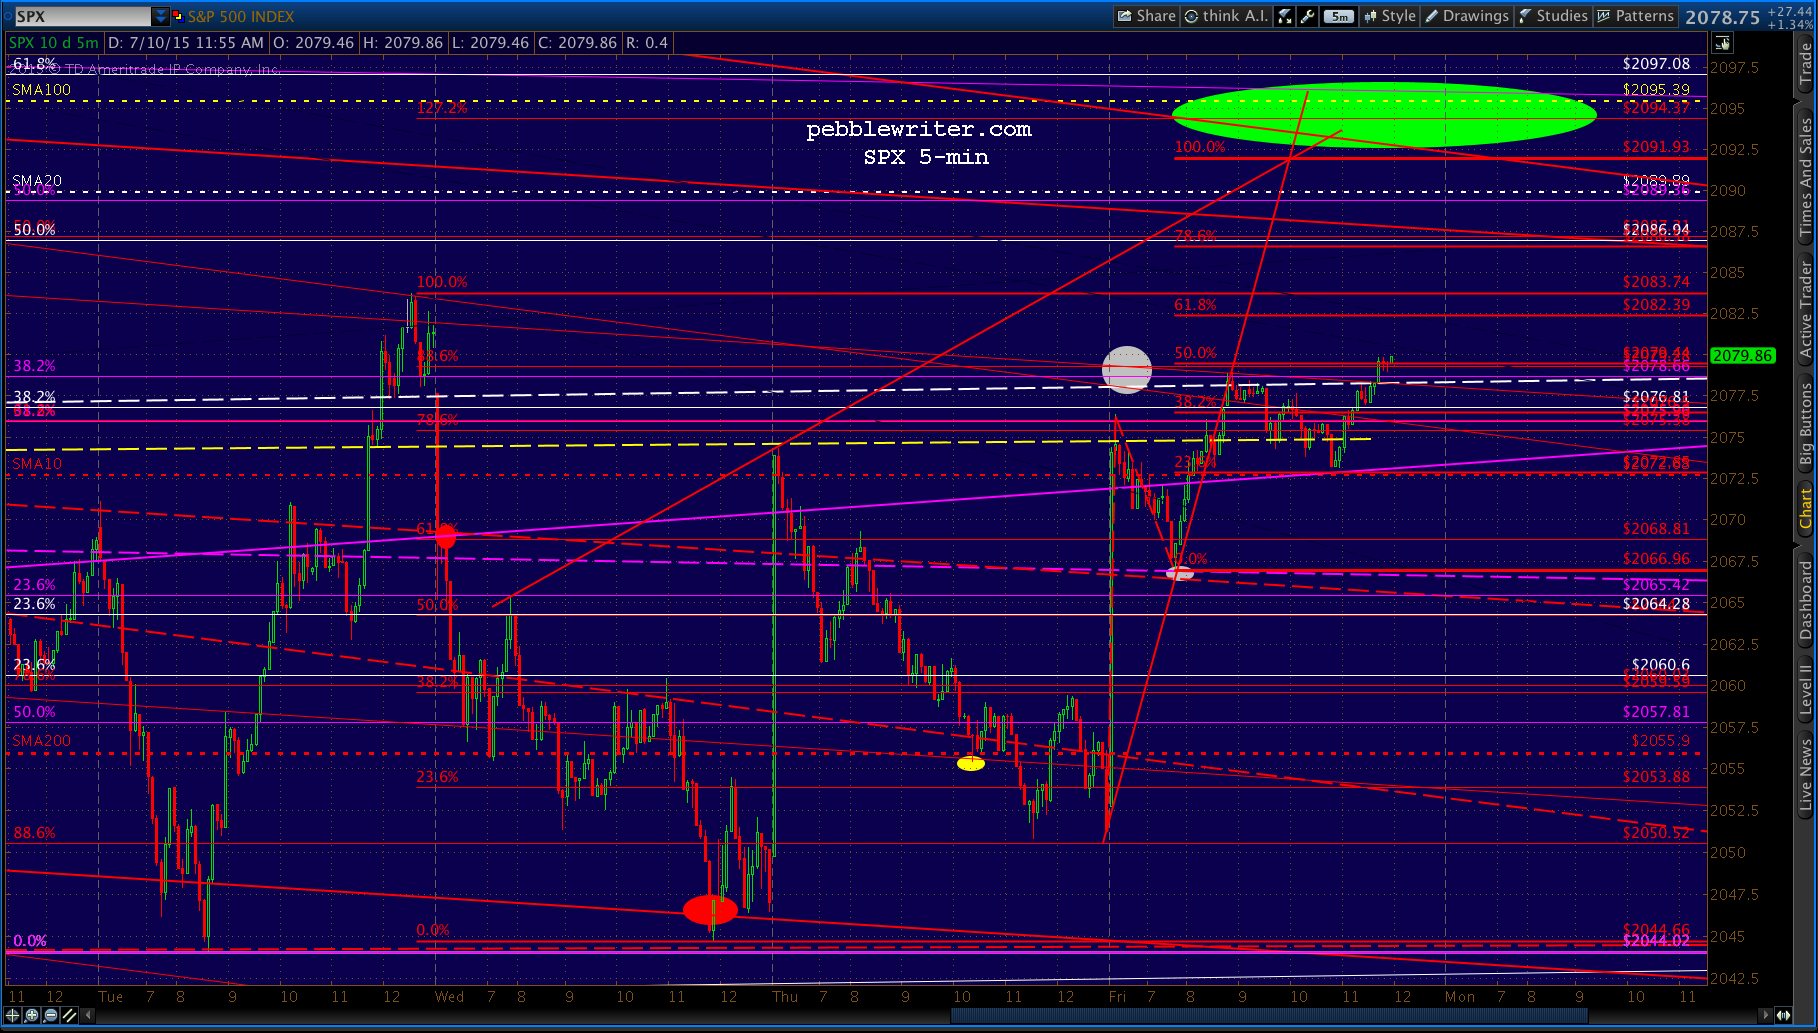
Apparently I jumped the gun a bit. Appears we’re going to tag the SMA10 and attempt to backtest there, instead. 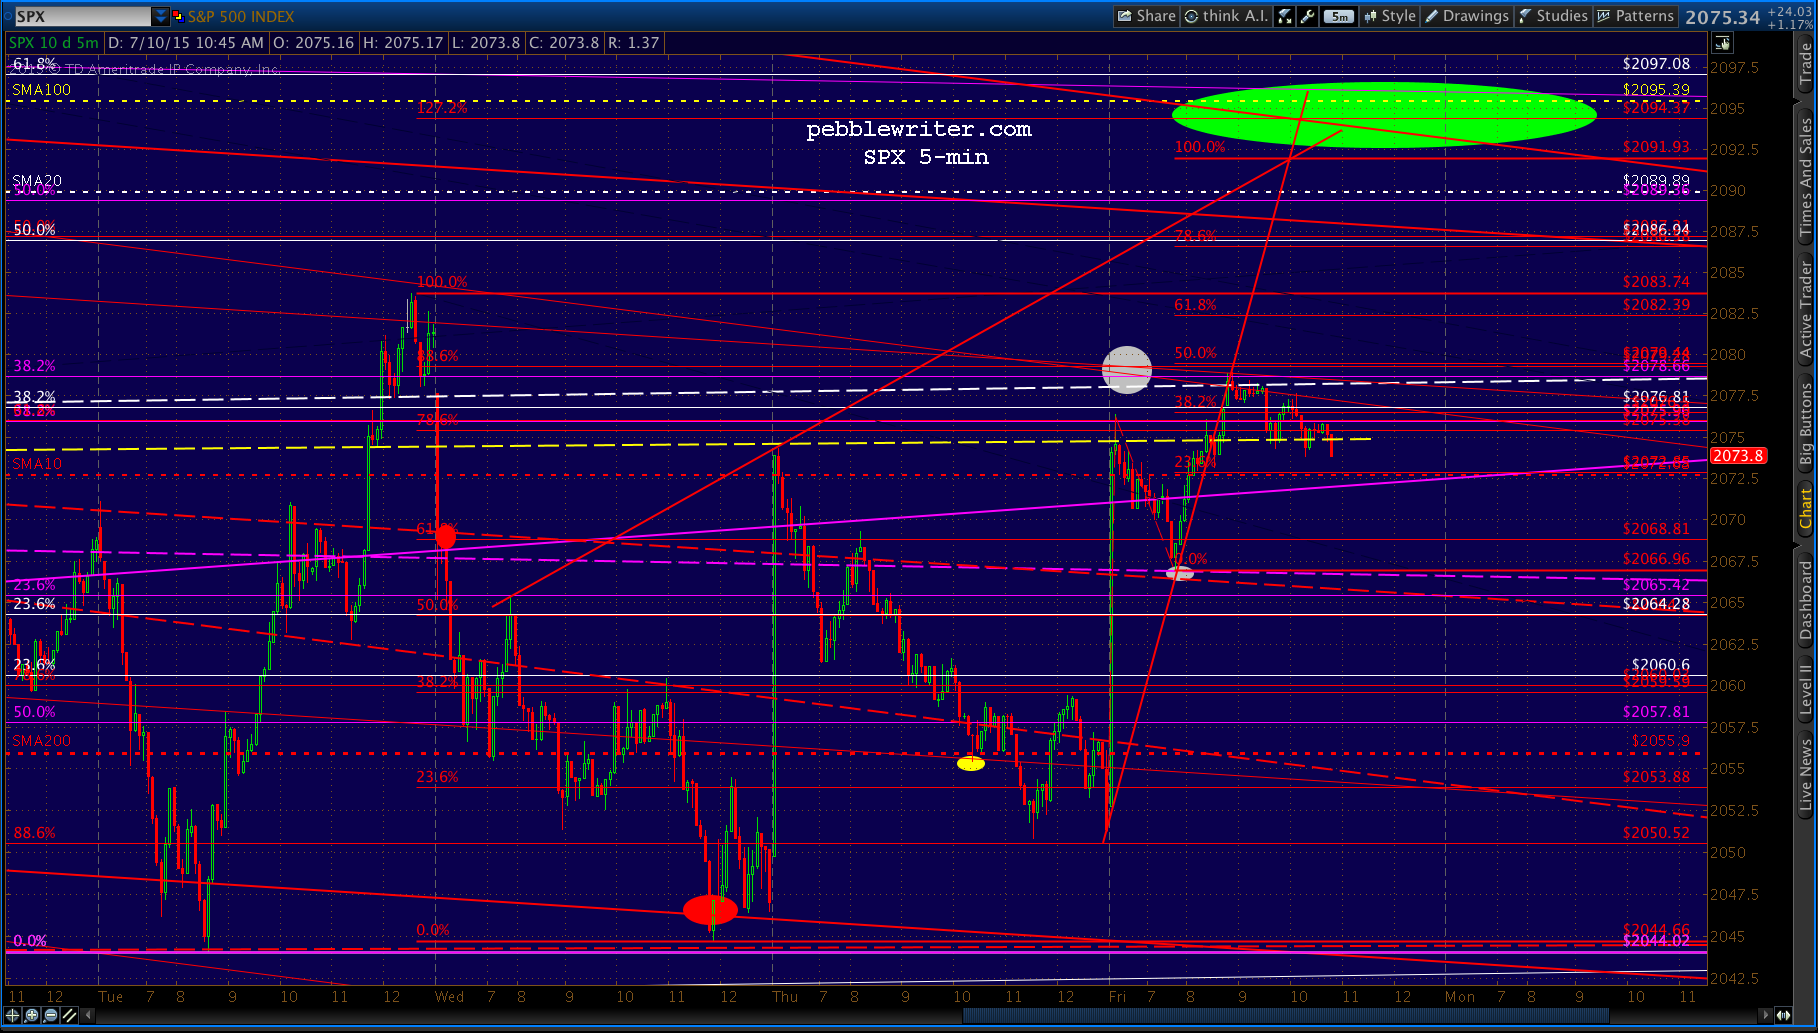 Watch your stops, as USDJPY isn’t inspiring much confidence here. If this little white channel breaks down, so should SPX.
 UPDATE: 2:56 PM
It’s just that with SPX up 27-pts on the day, I question whether we would see that kind of push into the final hour of trading. There’s still a lot of headline risk going into the weekend.
Besides, we’re up more than 1% on the day, and over 10% month to date. Why push it?
 Nothing wrong with taking a short position here as long as we set tight stops at, say 2081. A sell off into the close at 2072.50ish would make plenty of sense.
As for next week, much will depend on what happens with Greece and/or China. The upside targets we discussed this morning (2095-2100) are perfectly legit and could come intraday Monday without changing the medium term bearish picture. Anything that bounces out of the falling red channel would target 2120ish. Beyond that, and the falling purple channel is a goner. The downside case is, IMHO, more compelling. Whether SPX tops out at 2081 or 2100, it would form a nice right shoulder for a H&S Pattern targeting 1950ish — not far from the .618 of the rise from last October. But, I still favor a drop to 2013 that firms up the rising white channel and creates an opportunity to pressure the BOJ and ECB into more QE. From yesterday:

One thing I’d not even consider — staying long or short over the weekend. Today’s melt up was completely fabricated and not worth the risk.
GLTA.
Comments
2 responses to “Ramp Central”
What is the forecast for next week? I’m having trouble following the different forecasts – daily versus little longer term.
Please see the discussion and charts at the end of today’s post.