UPDATE: July 2, 2011
Friday evening’s subpoena of BofA CEO Moynihan is a great reminder of the many lingering legal problems all the banks still face. It might give even bullish investors pause about the wisdom of trying to ride the financials any further.
Regular readers will recall I have been extremely negative on the financials for several months now. From a fundamental standpoint, there is little in the QE-less, higher interest rate world to suggest sustainable profitability is probable, let alone possible.
But three weeks ago, when XLF completed a bullish Bat pattern, I suggested we were in for a rebound (see below). The pattern called for an upside of 16.55, but I felt the rise would be contained by the channel it’s been in since Feb 18. Now, it’s closing in on our target and a nearly 7% profit.
There are other reasons besides the channel, however, to question whether XLF can go much further.
First, the fan line it broke through on June1(which had been providing support) is now prepared to pose substantial resistance. It’s the yellow dashed line below.

Also, at Friday’s high of 15.66, XLF completed a bearish Bat pattern that has a target below 15.

Last, the 200-day moving average looms overhead at 15.69 — 3 cents above Friday’s high. On the hourly chart, the RSI is well into nosebleed territory. Along with the histogram and the MACD, there’s an obvious hook to the downside.
The BofA subpoena announcement came after Friday’s close, so the markets haven’t had the opportunity to react. Given that, and the technical indicators we’ve looked at, I’m expecting a sharp reversal. The financials can then get back to that zombie shuffle we all know and love.
ORIGINAL POST: June 6, 2011
Update on Financials: Getting Off Cheap
If the reported settlement of $20 billion is all it takes to get the banks out of their foreclosure fraud liability, we should see a pop in the financials.
I’ve been watching a bullish Bat pattern evolve in XLF. While I’m very bearish on the financials (and the market in general), a settlement could provide a short-term boost that leads the XLF and the overall market higher over the next few days.
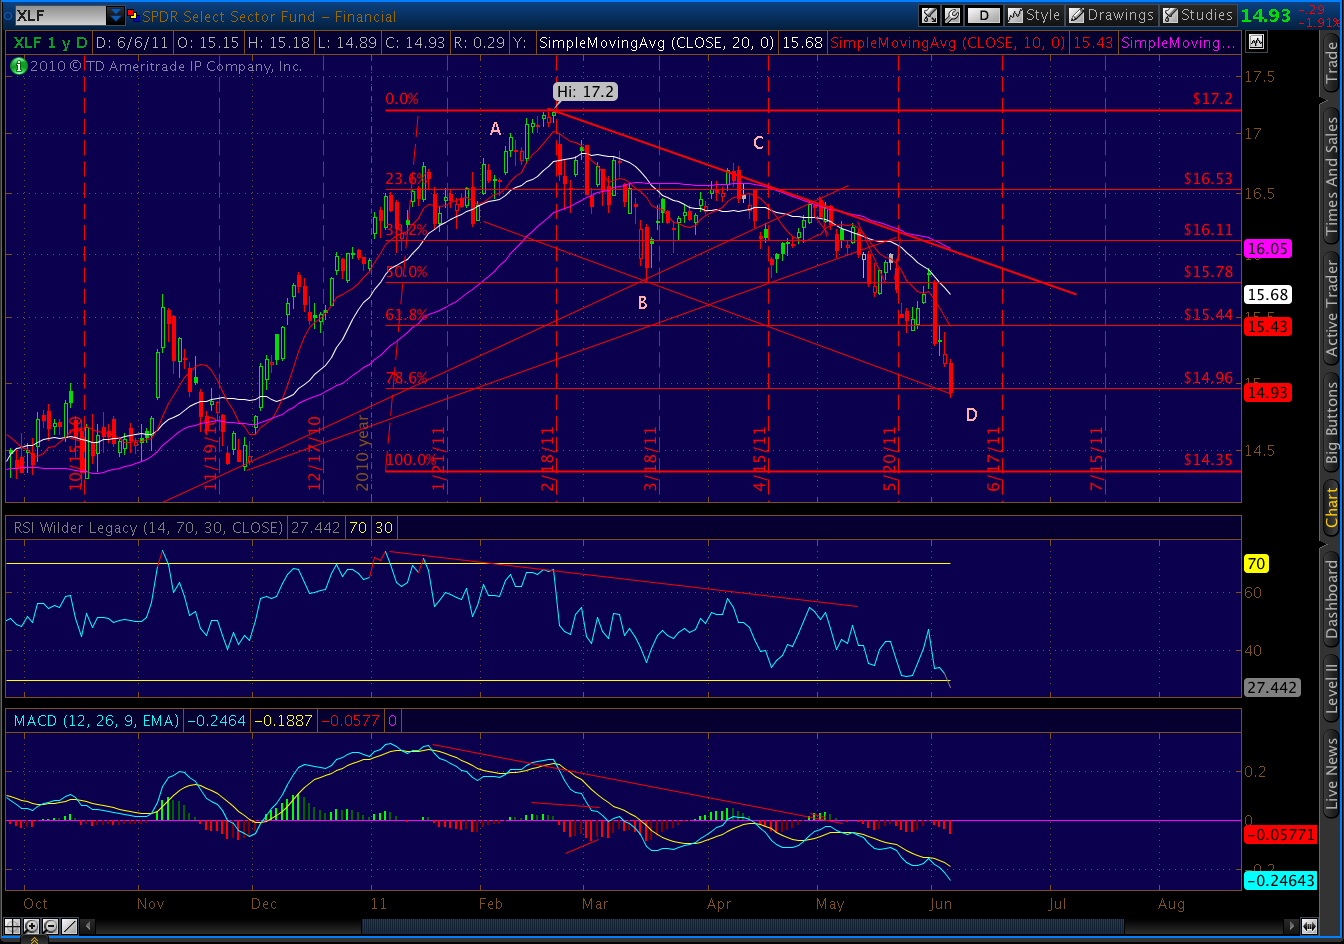
The pattern targets an upside of 16.55, but a return to the upper end of the channel is likely all we’ll see.
One note of caution for traders: this pattern’s CD leg is currently approaching a 2.00 extension of the BC (1.94 at today’s low.) Bats can also extend to 2.24 or 2.618, which would result in continued downside to 14.6 or 14.24 respectively.
That would drop XLF out of the channel, which is entirely possible. Experienced harmonics traders look for a confirmed move in the anticipated direction before placing trades, and place stops to limit the fallout from the 30% failure rate.