It puzzles me how, when the market does exactly what it’s expected to do, some folks take it as a sign that everything’s somehow changed.
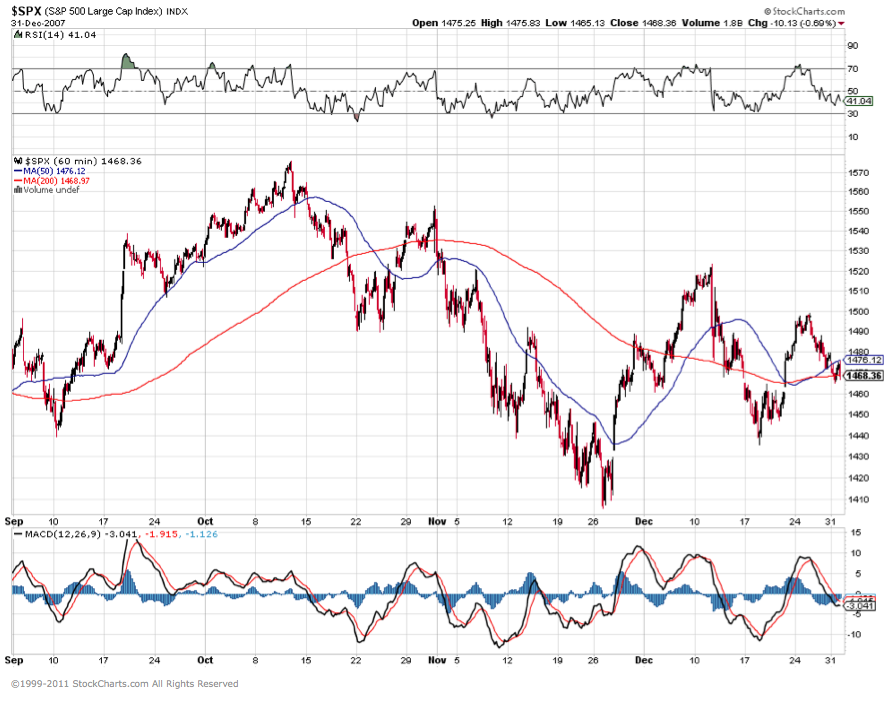
Late Tuesday night [Ten Lousy Points] I blogged for the 1,000th time about the similarities between this market and that of 2007. I pointed specifically to December 21, 2007 as the day most equivalent to Tuesday’s big run up.
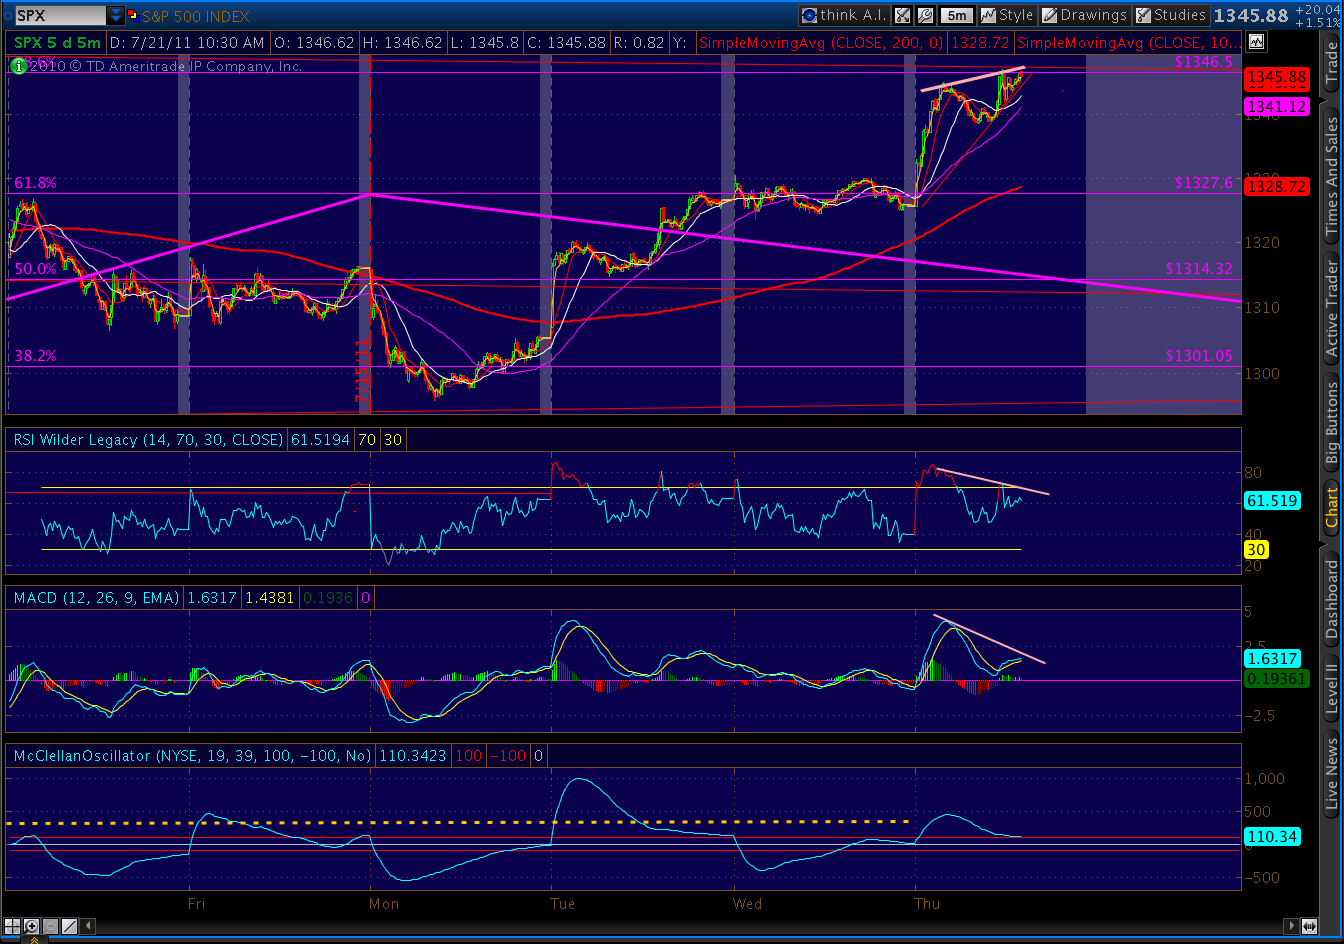
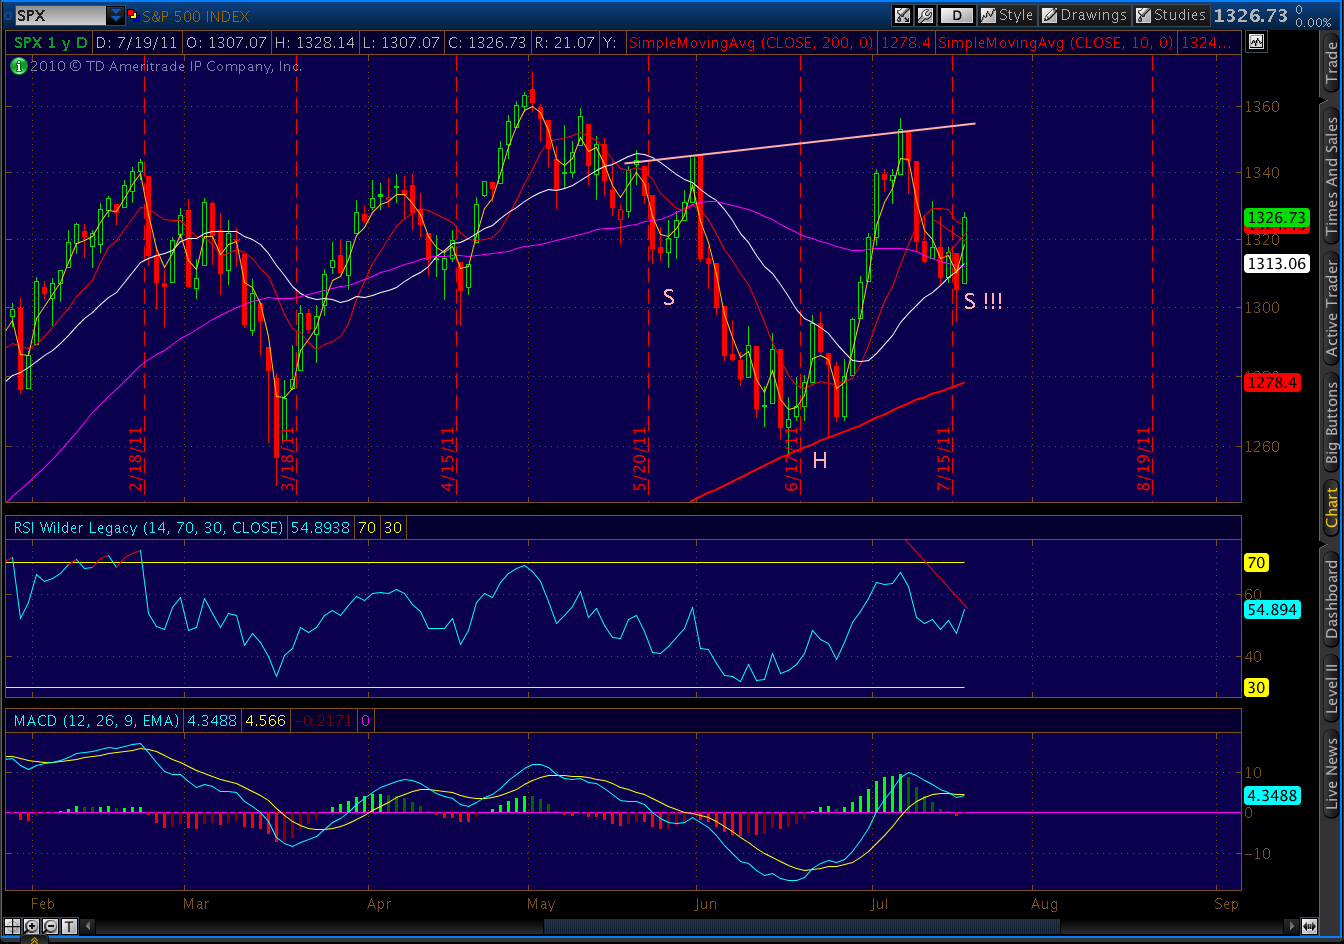
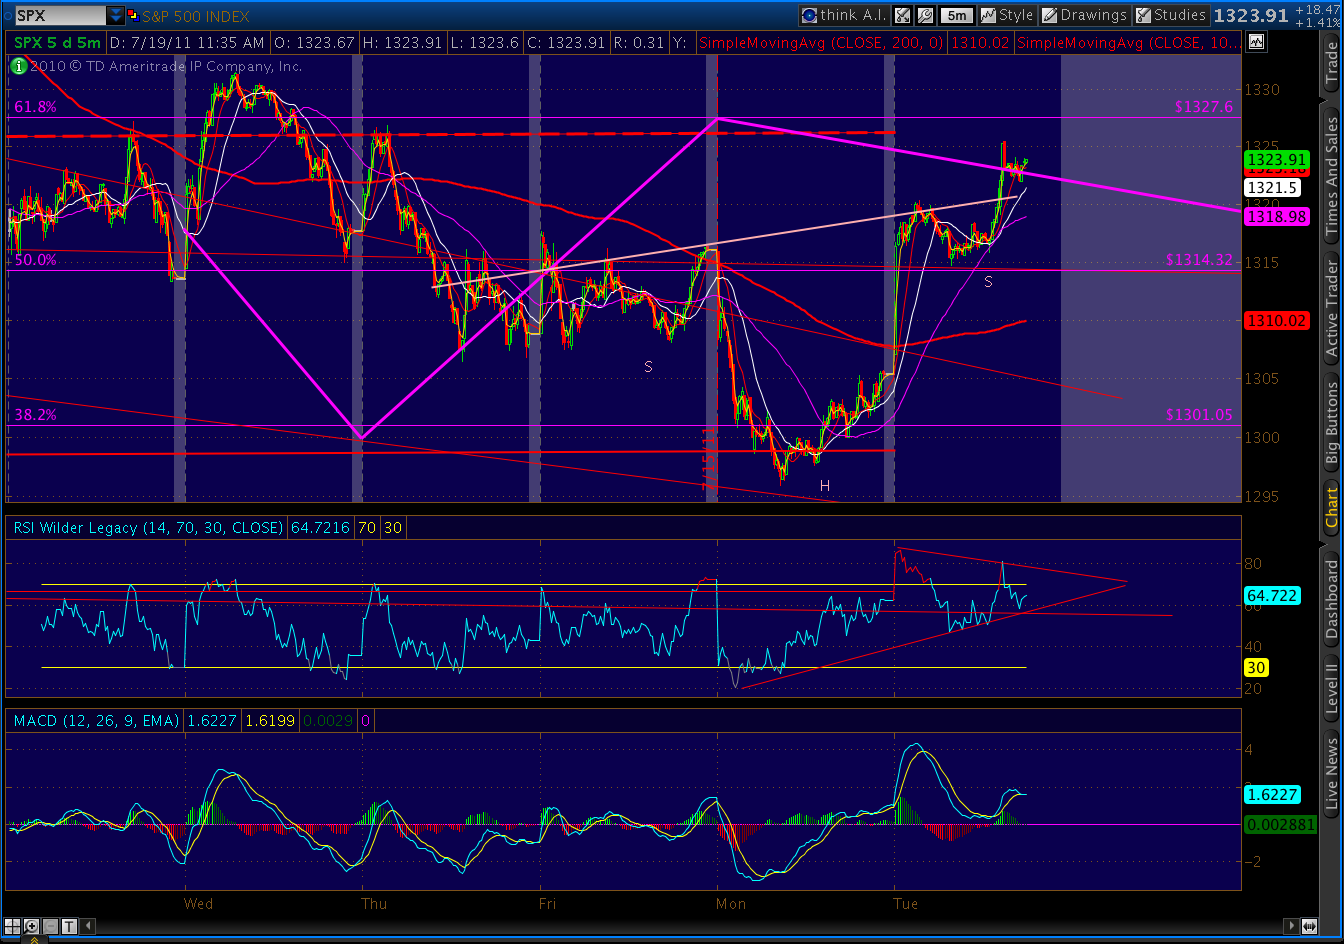
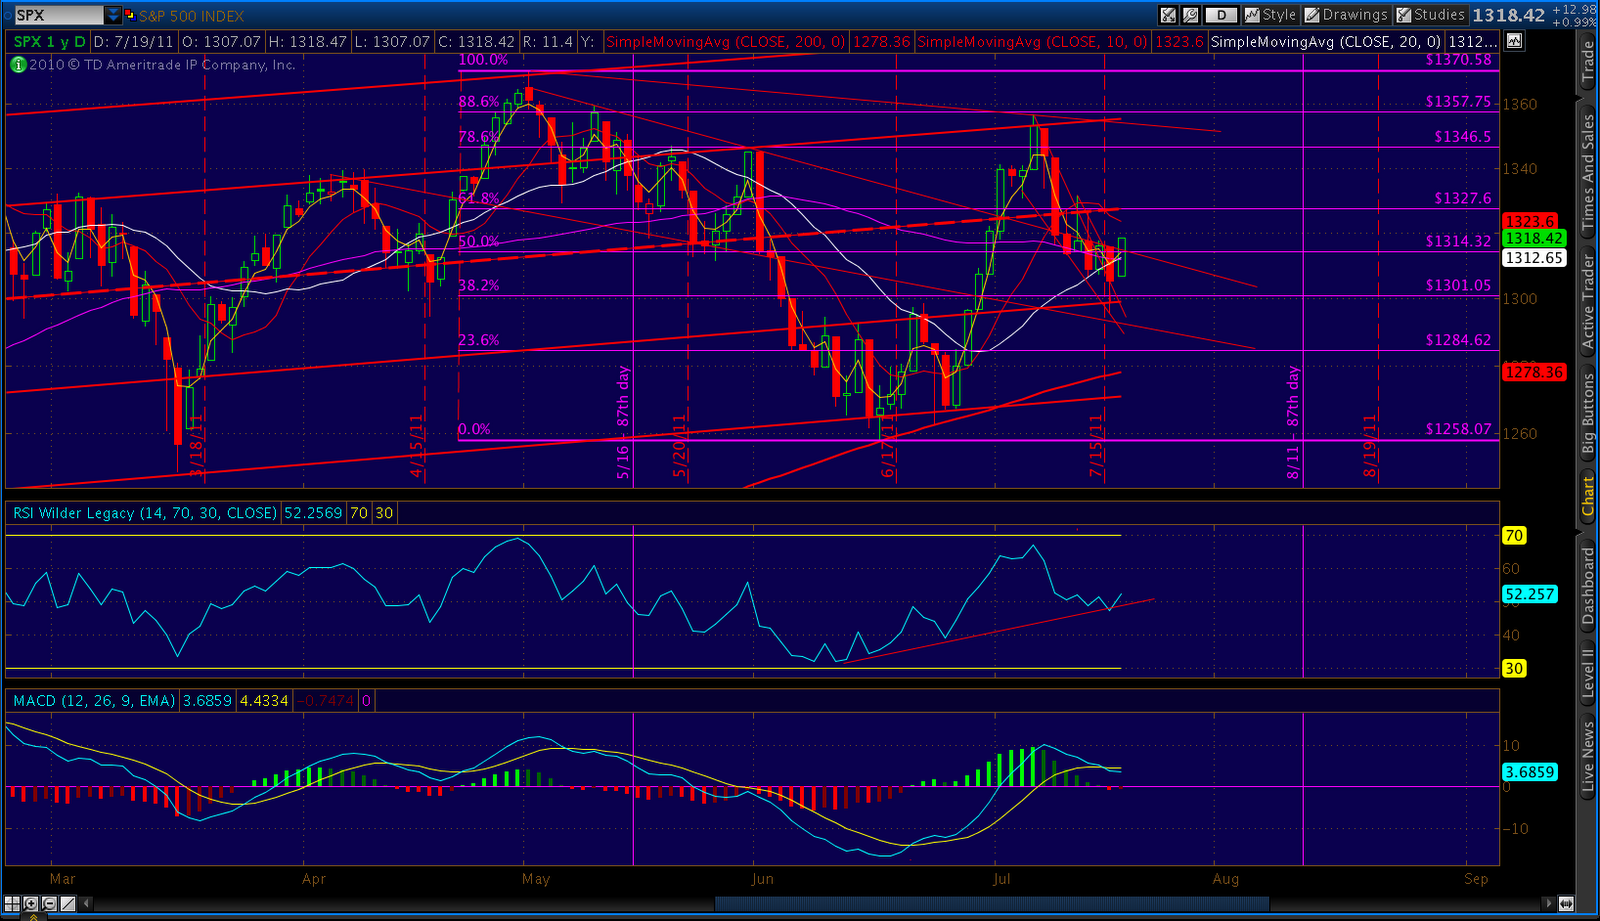
I further theorized that the inverse head & shoulder pattern we completed that day could take us from 1324 up to 1344, where we would be just 10 points away from completing a much bigger IHS pattern that would be extremely bullish.
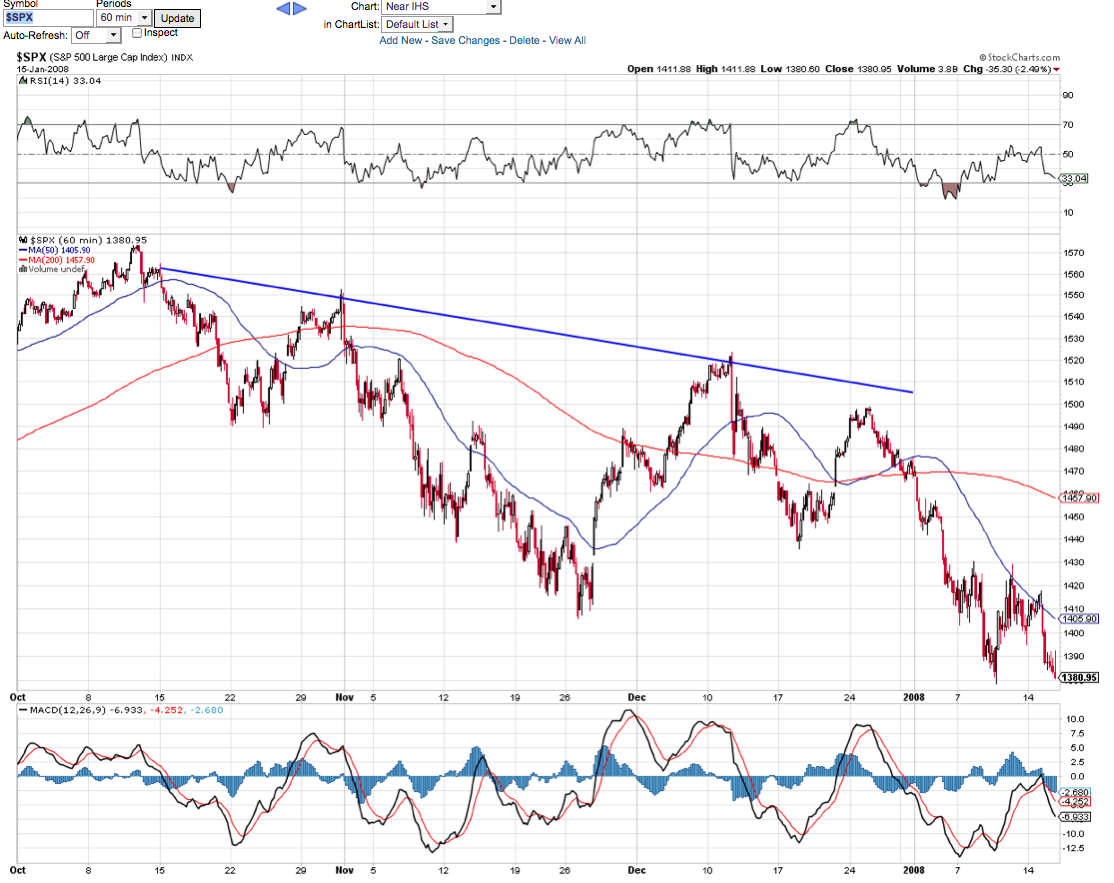
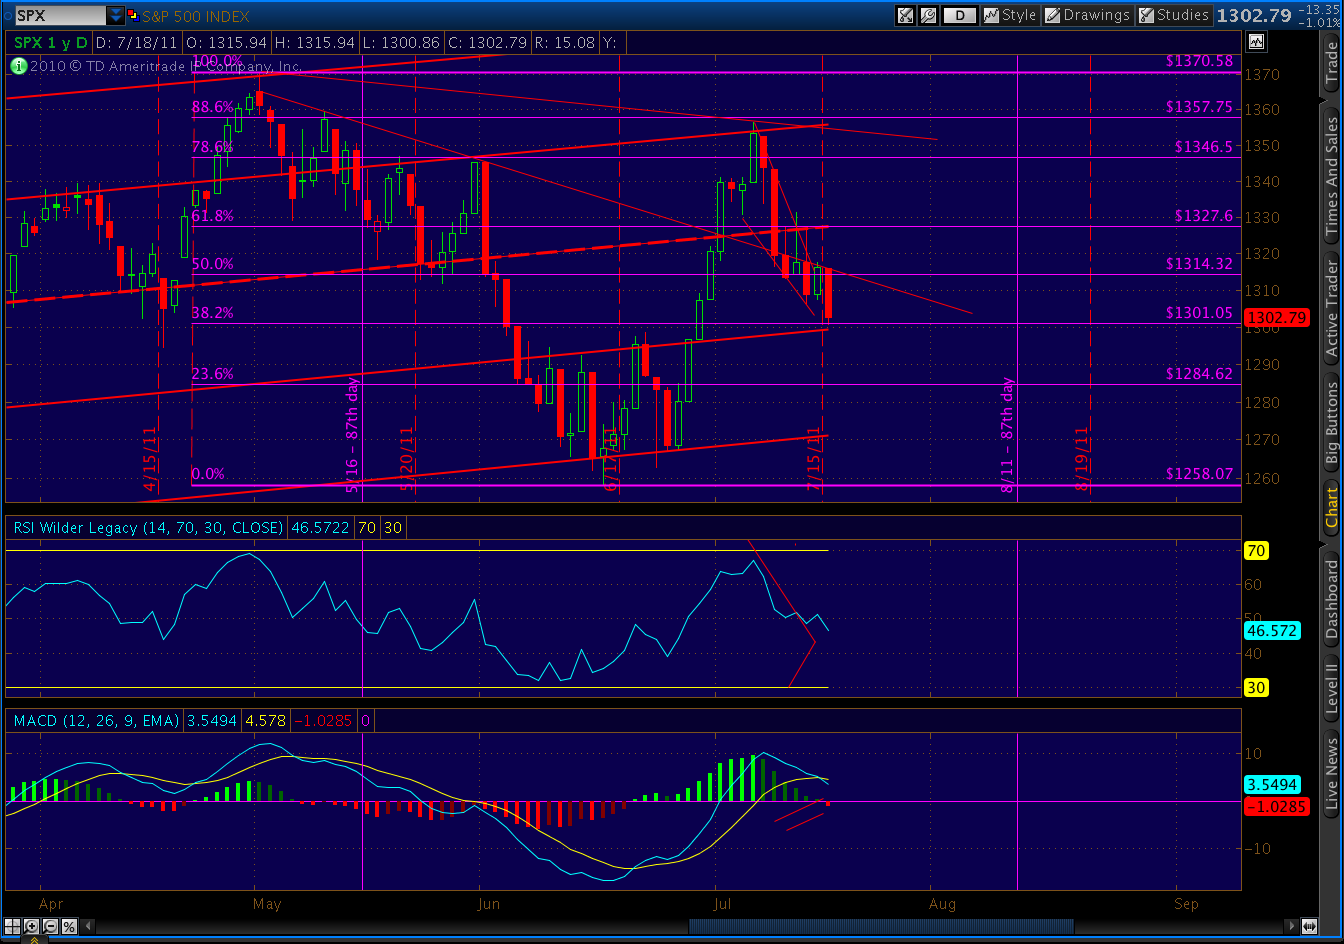
After Wednesday’s market went nowhere, I put up a couple of 60-minute charts — one from December 2007 and one from today [Merry Christmas]. I suggested the time was at hand for us to complete the pattern we’ve been following.
Today, we…um…completed the pattern. So… what’s wrong with that picture? The only thing that bothers me just a little bit is the way we got there. I thought it would take two days, but it only took one. I also thought it would come on the heels of a debt ceiling deal; the deal is yet to be reached.
While it’s entirely possible this pattern will overshoot vis-a-vis 2007 just like we did on July 7th, I think it’s more likely we’ll backpedal a little tonight or tomorrow (when people realize the Eurozone deal isn’t all it’s cracked up to be) and set the stage for another grab at glory when the deal is announced.
It’s also possible that the deal that’s ultimately reached is so wretched that the market takes it as a negative instead of a positive. I mean, it seems a foregone conclusion that some deal will be reached, so isn’t that pretty much priced into the market? What if — and I know this is a stretch — Congress can’t get its act together and do something meaningfully beneficial? Might not the result be a sell off instead of a rally?
I don’t really know. Never been in quite this situation before. But, I do know that there’s very little any politician can do at this point to fix things in such a way that won’t bring a great deal of suffering to most Americans.
The way the game was played, huge benefits were wrung out of the economy for the benefit of a few. Instead of being held accountable, those few are mostly living very comfortably and secure in the knowledge that the system has their backs. The rest of us will be paying the price for many, many years. A debt ceiling increase will do nothing to prevent it.
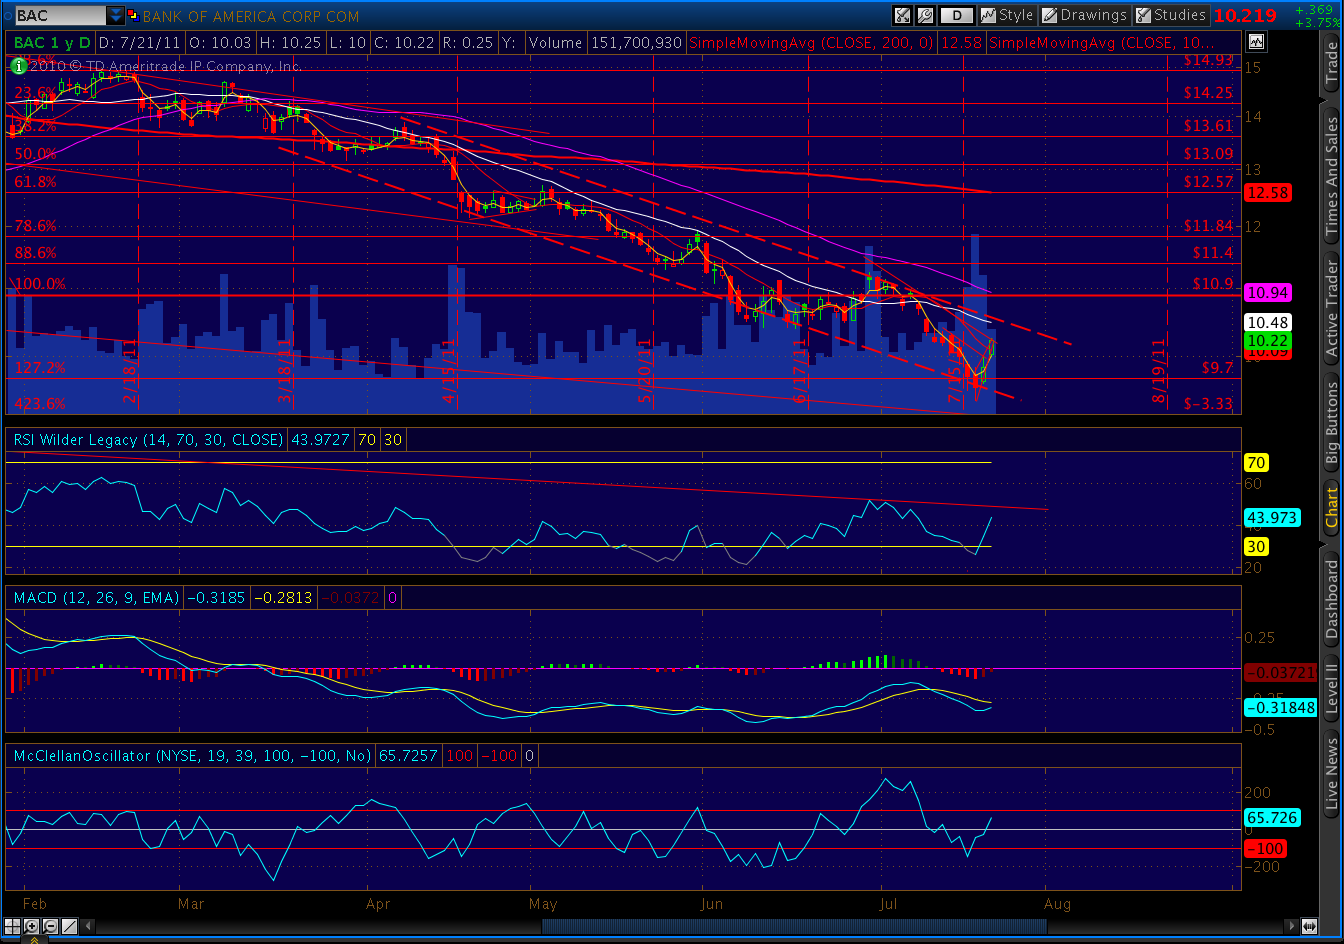
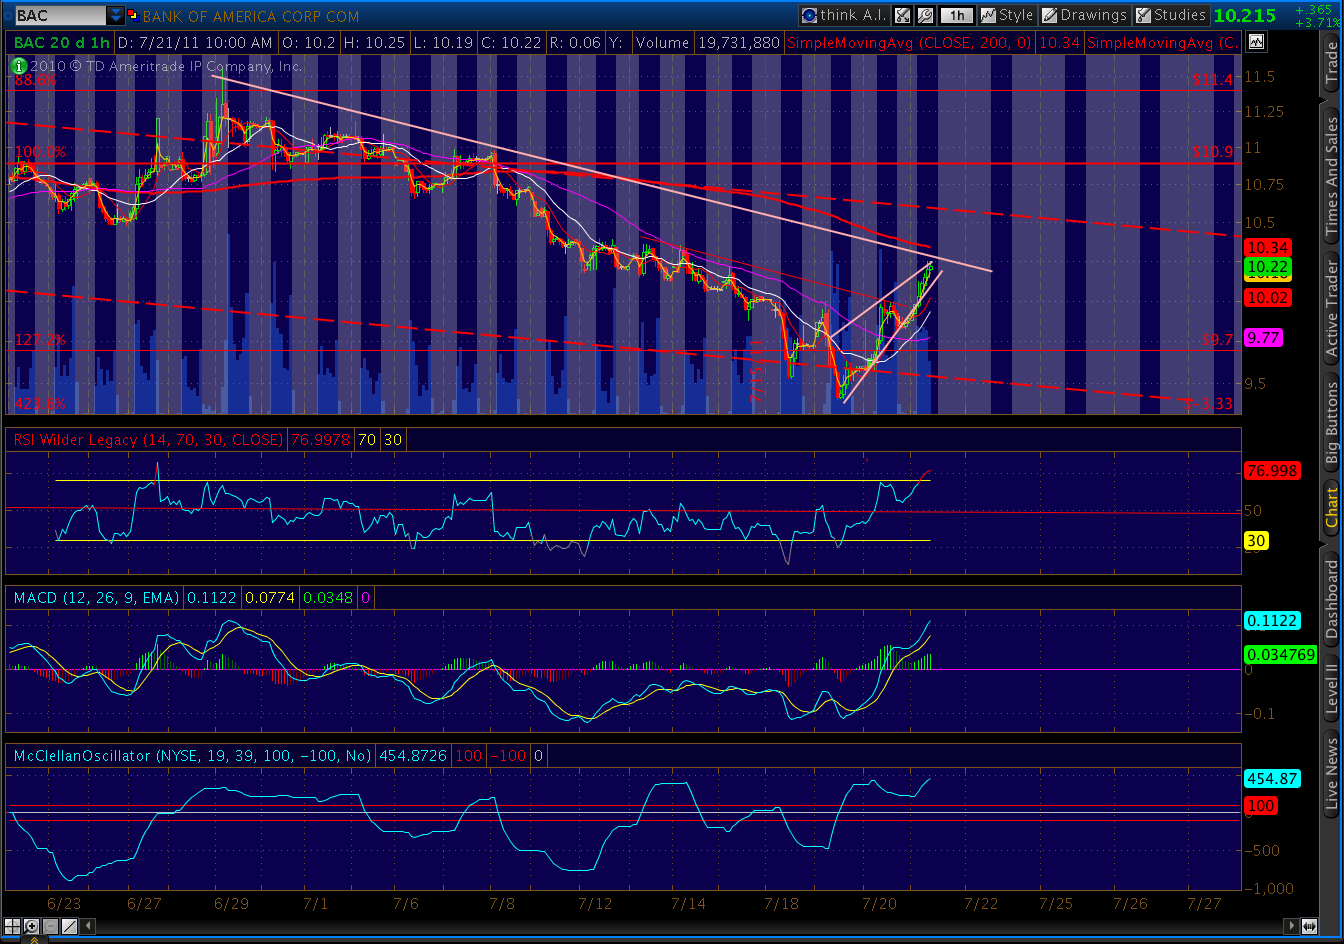
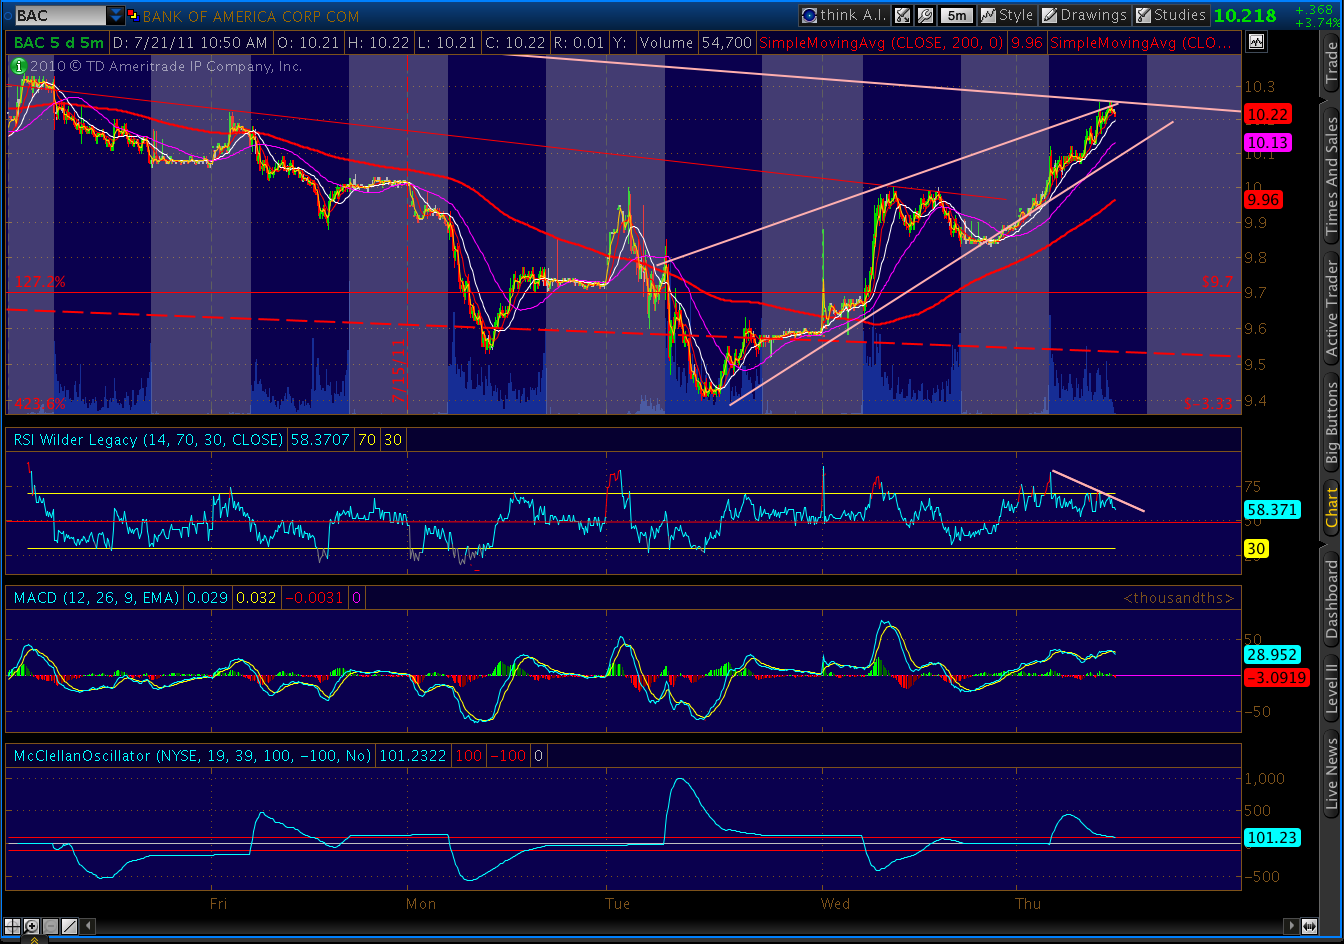
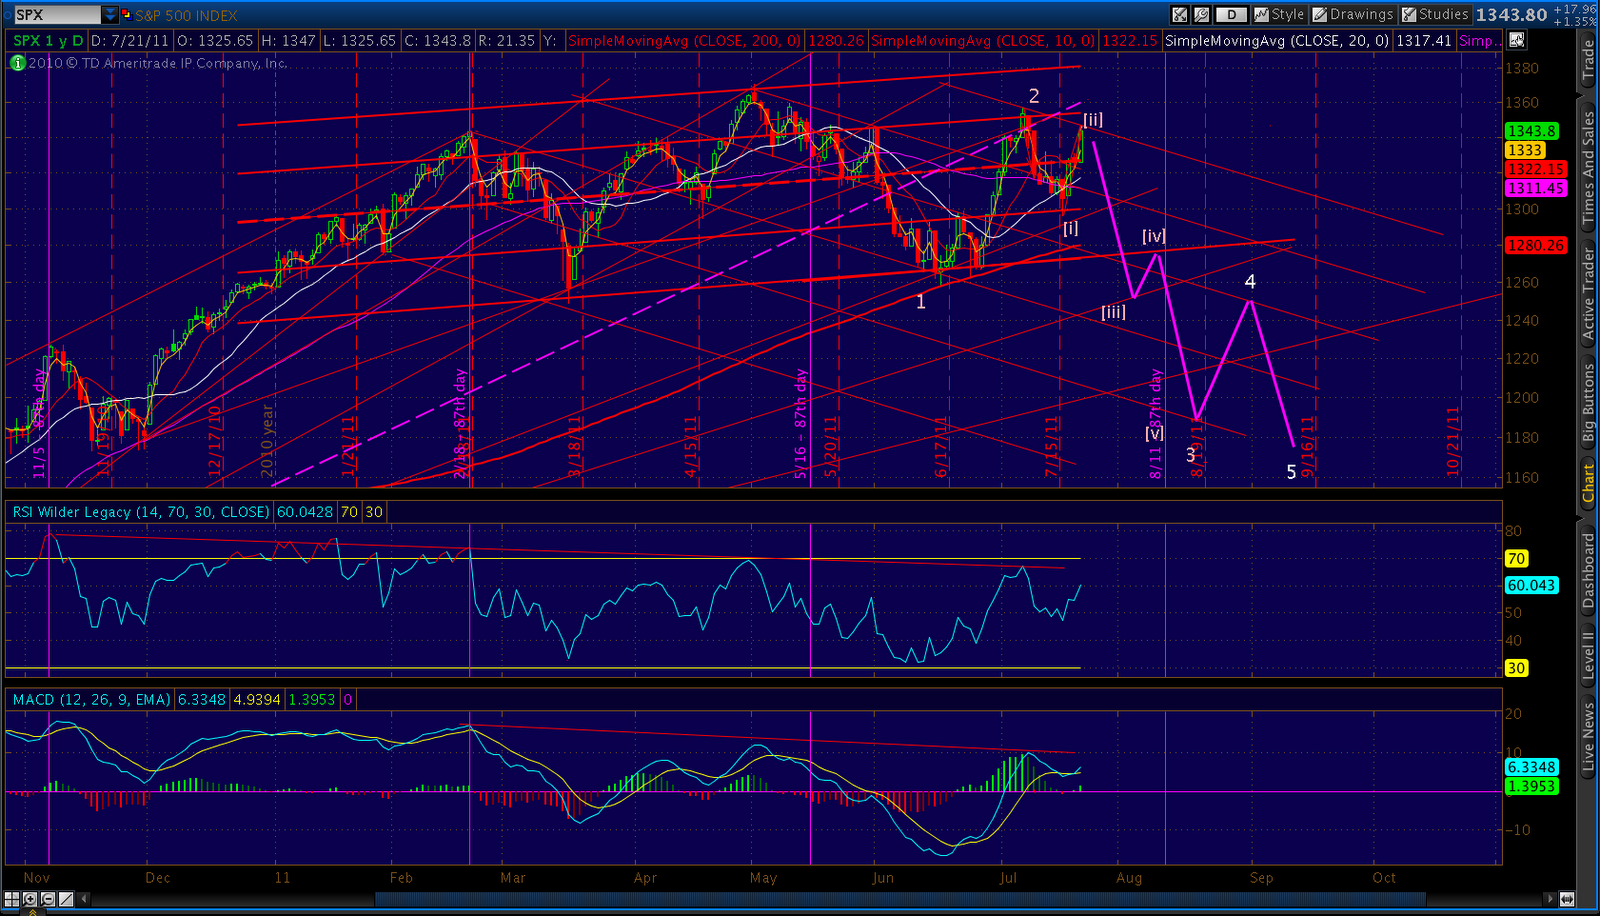
A quick look at what I expect to be the way forward:
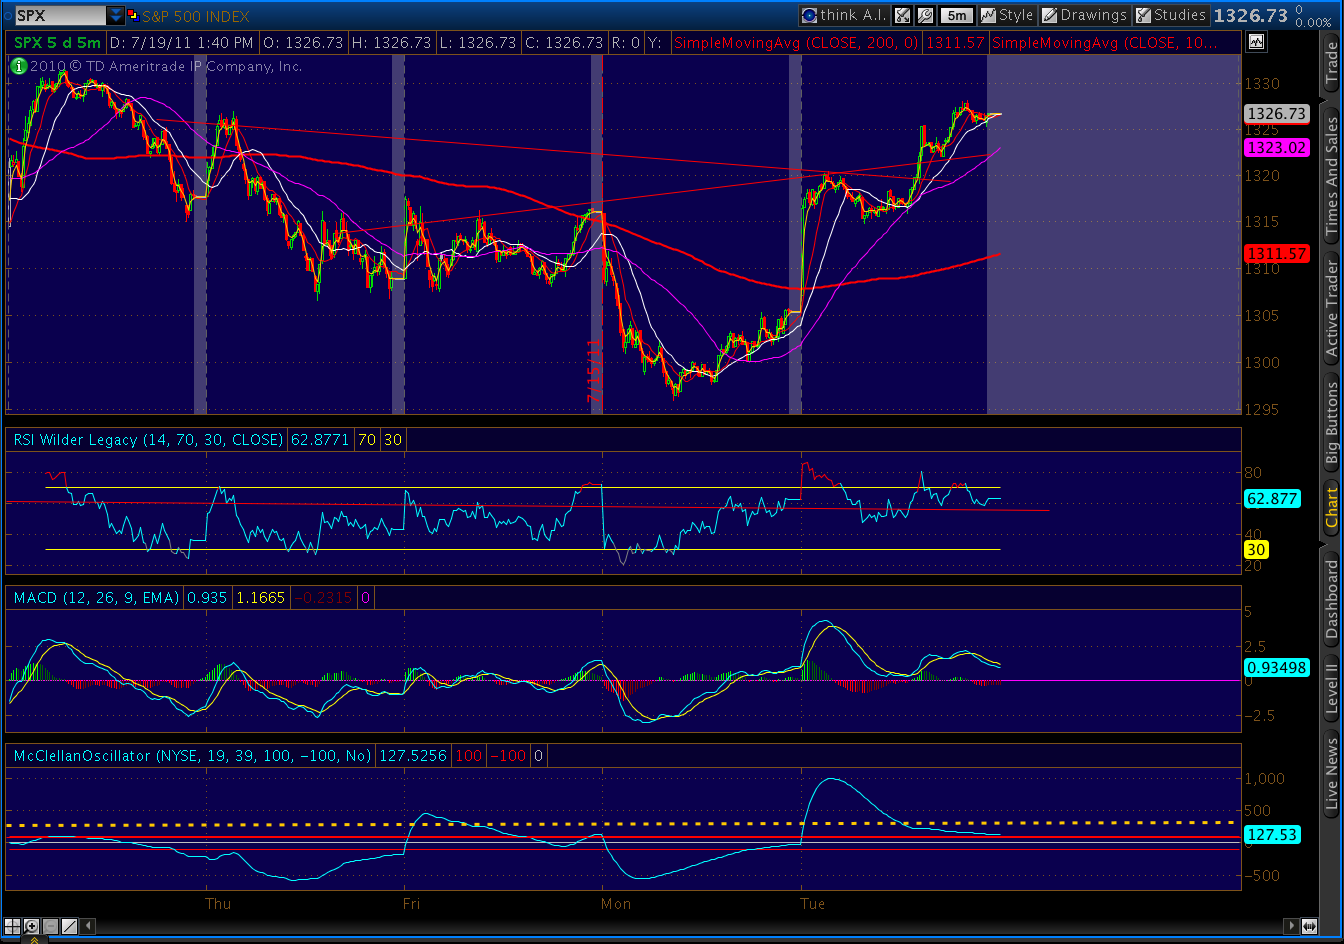
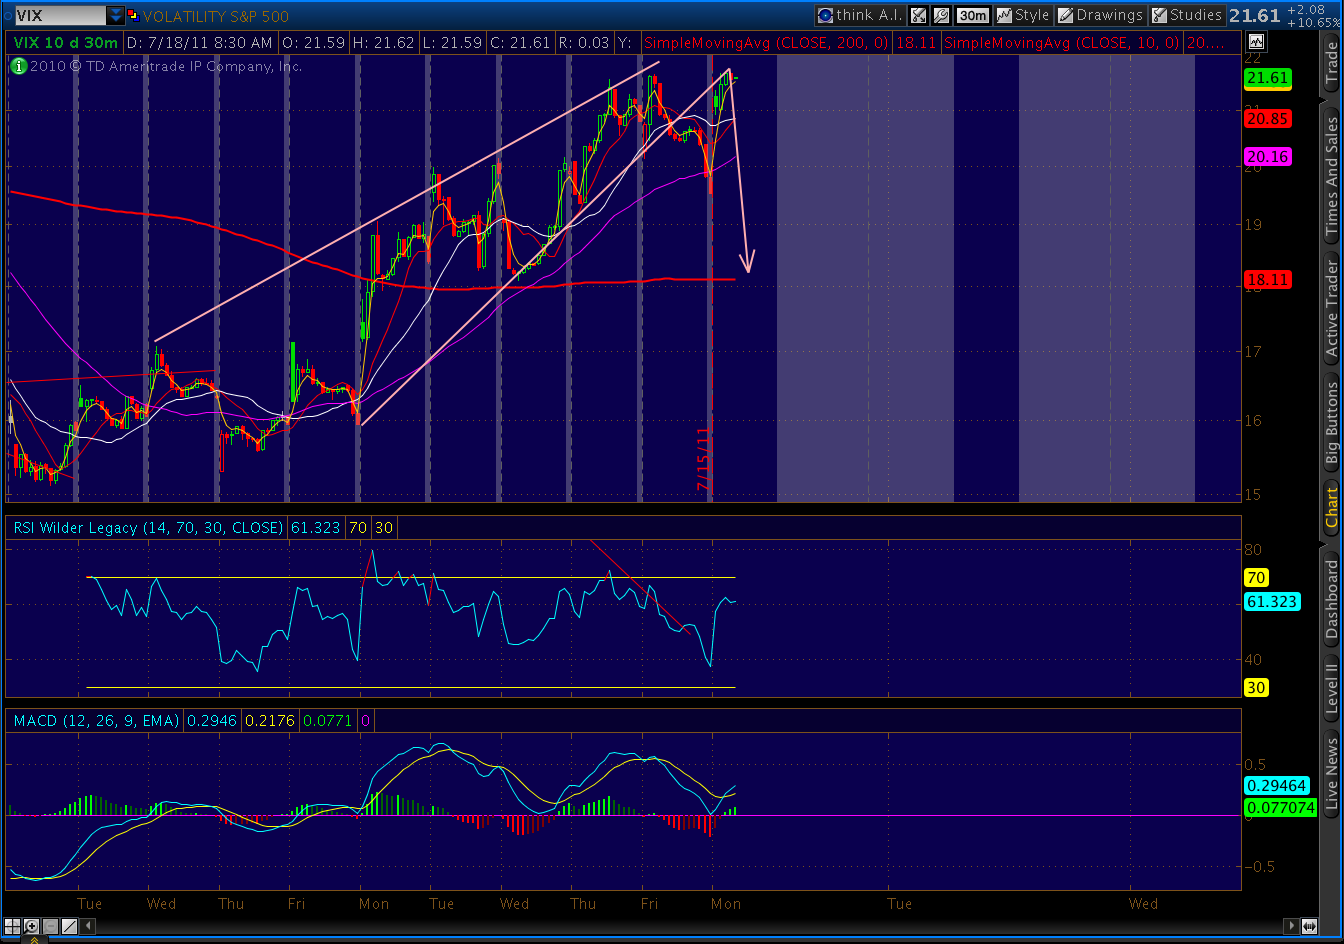
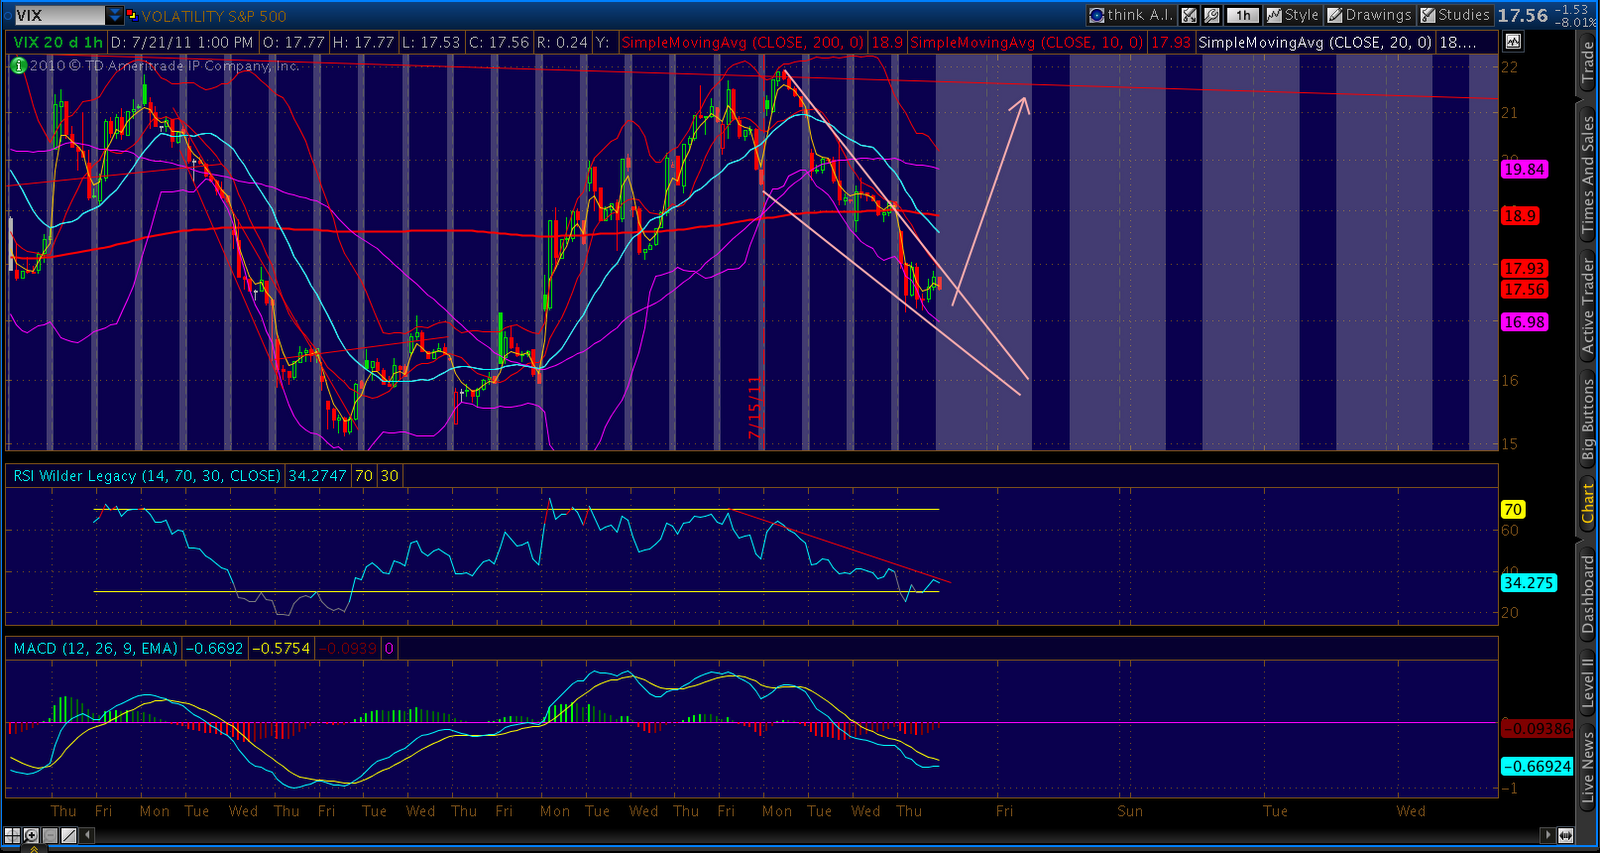
In addition to the divergence between RSI and MACD and SPX for most of the day, VIX set up a bullish falling wedge that should break upwards in the morning.
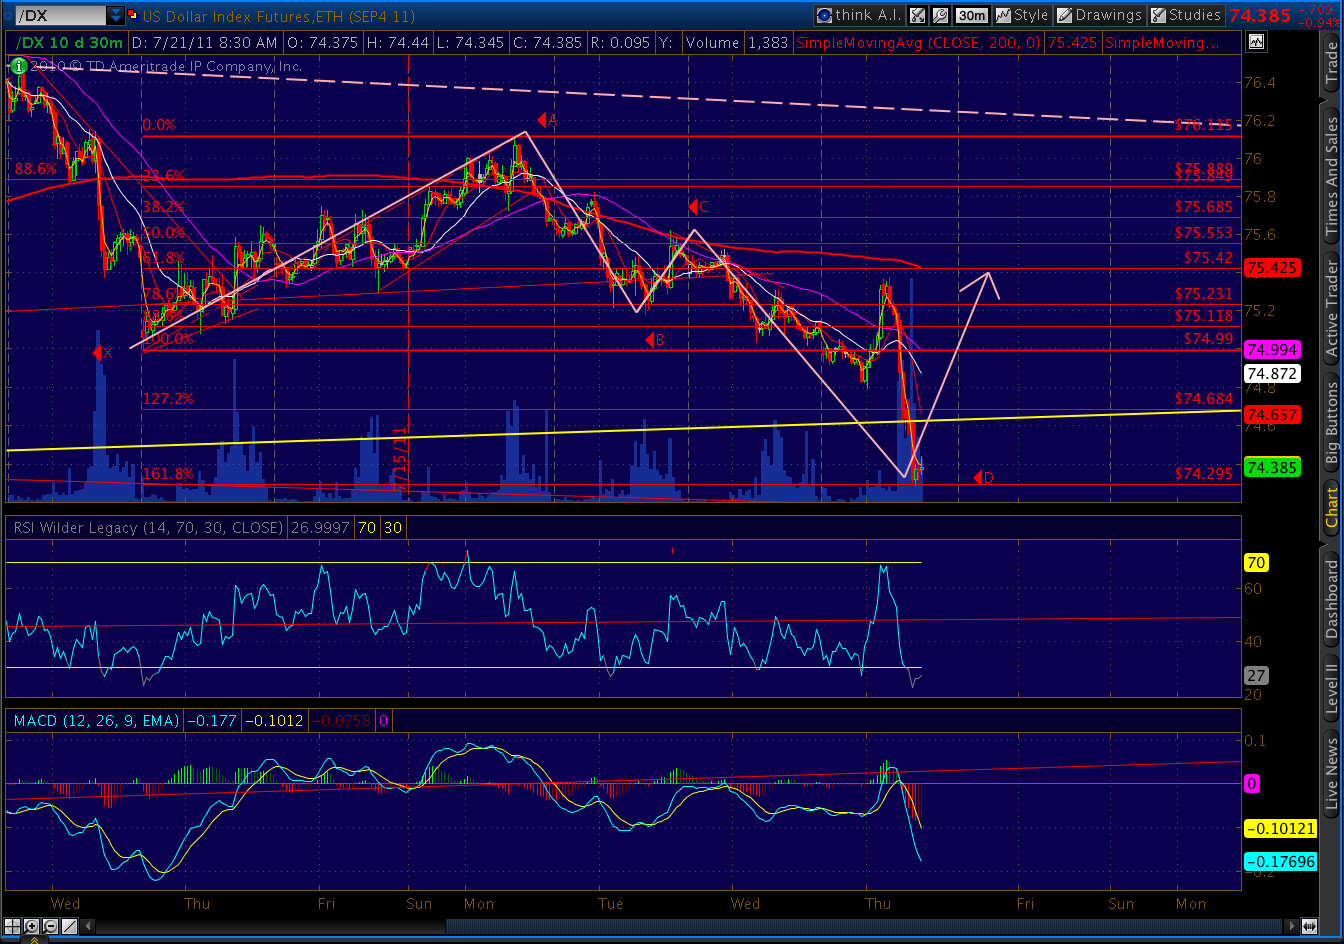
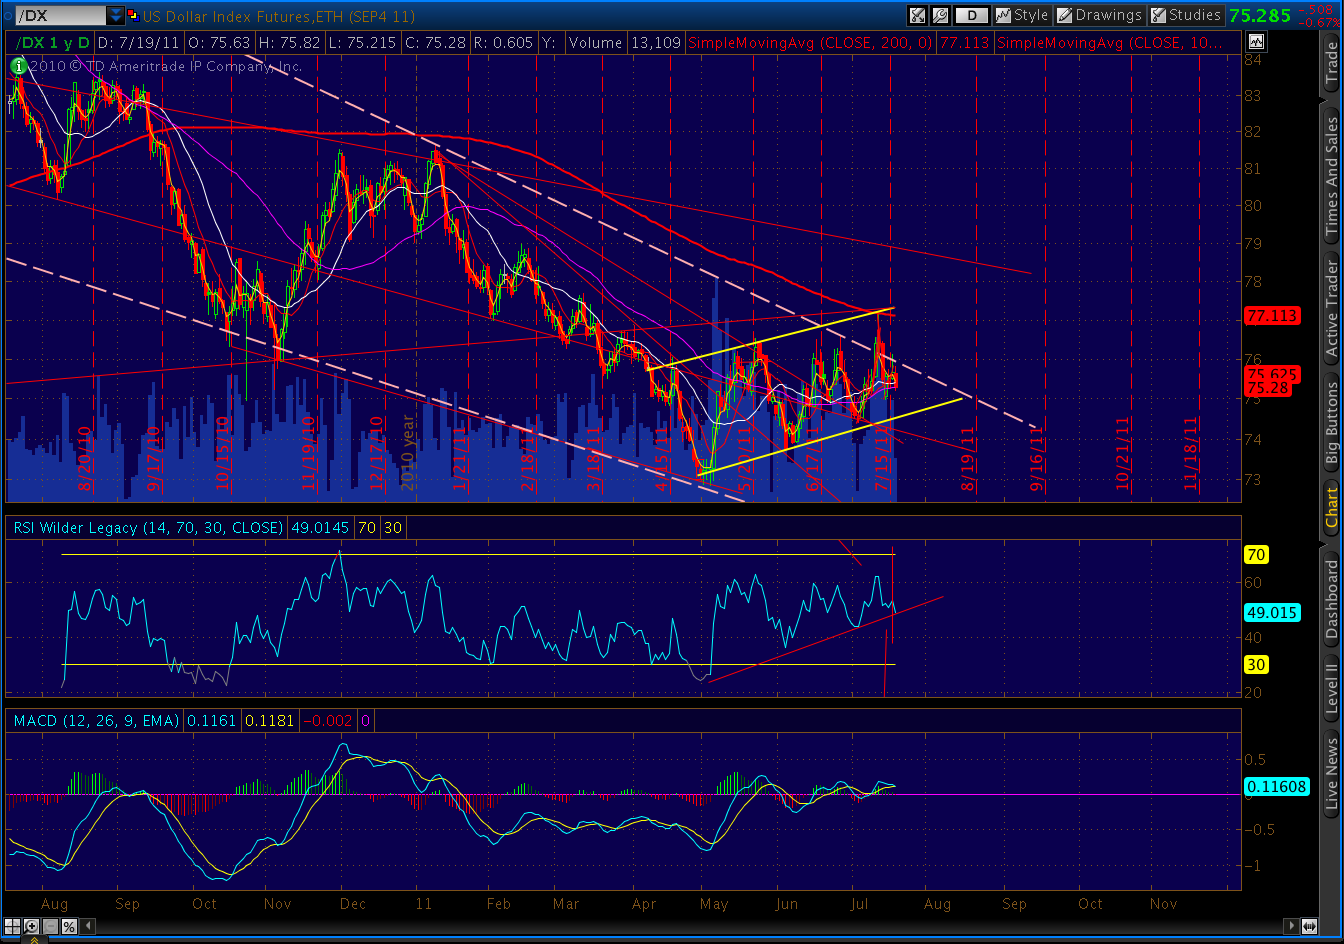
And, the dollar completed a bullish Butterfly Pattern that should reverse today’s slide.

I’ll try to post again before tomorrow’s opening. In the meantime, stay calm. Use stops. And, keep the faith.