And, in recognition of the various nationalities who’ve checked in here lately…
My apologies to the Canadians. Couldn’t find a proper translation…
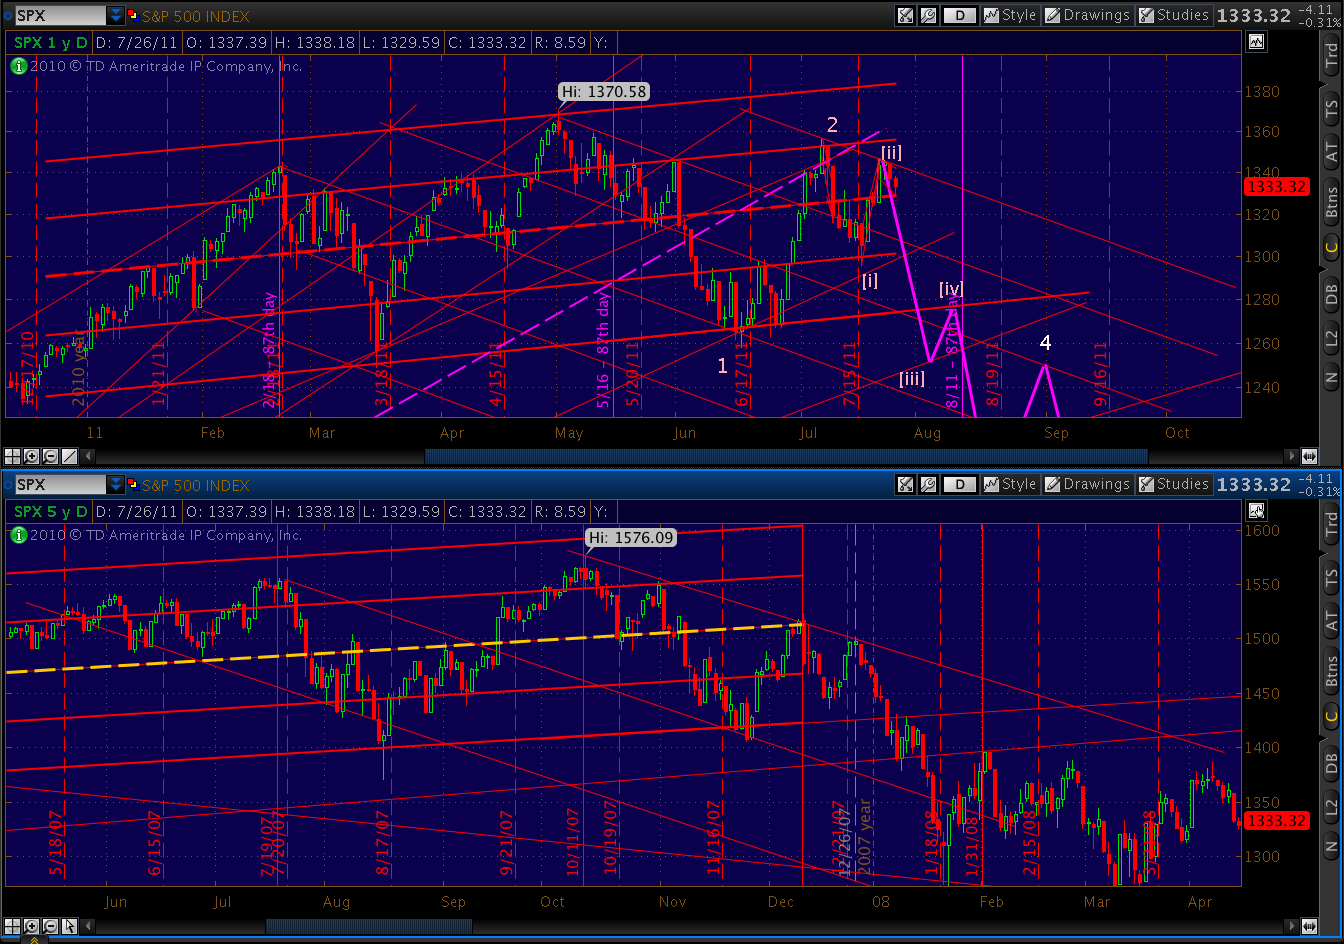
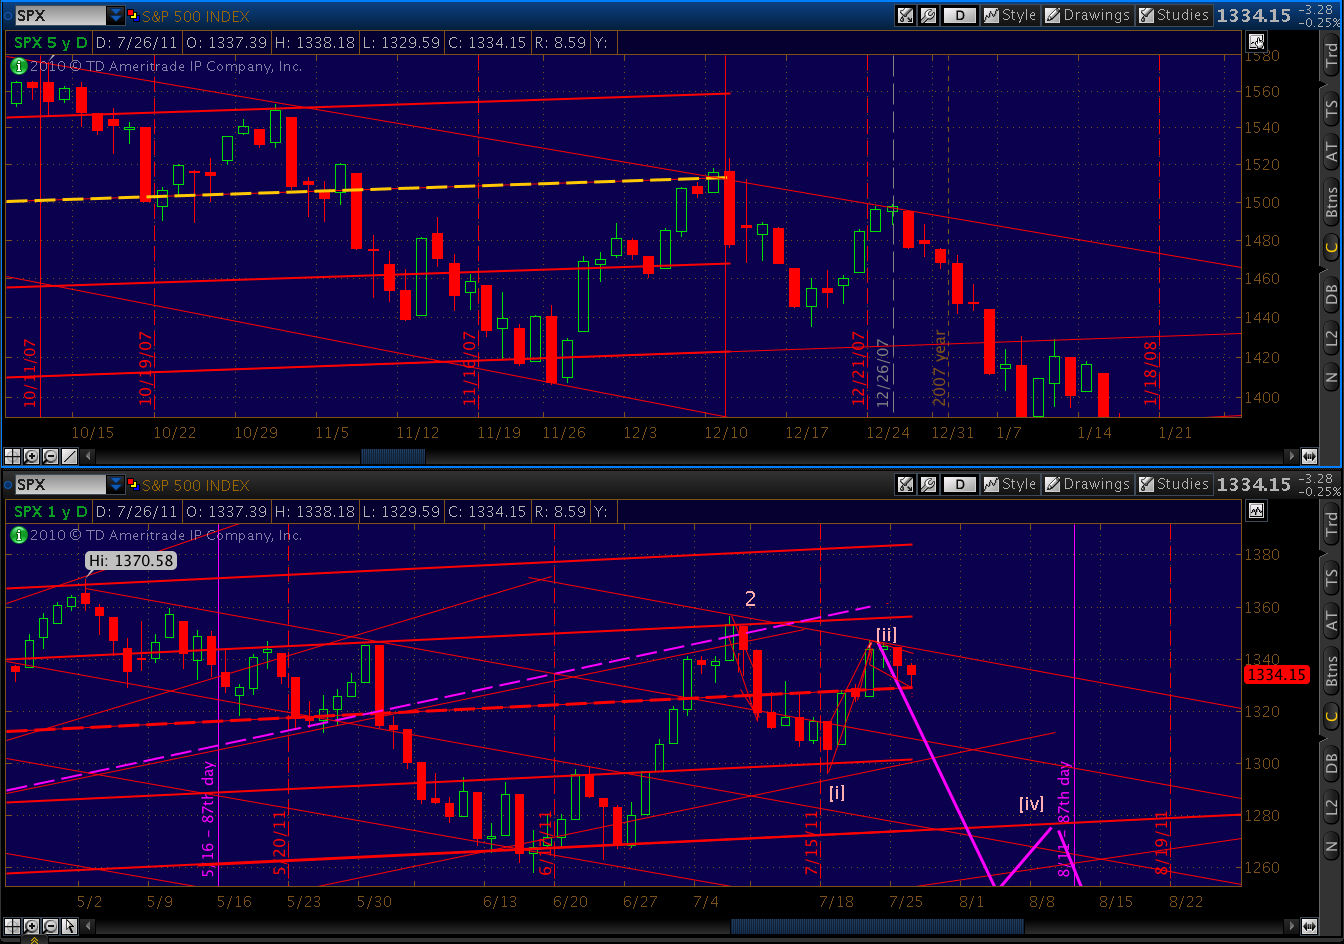
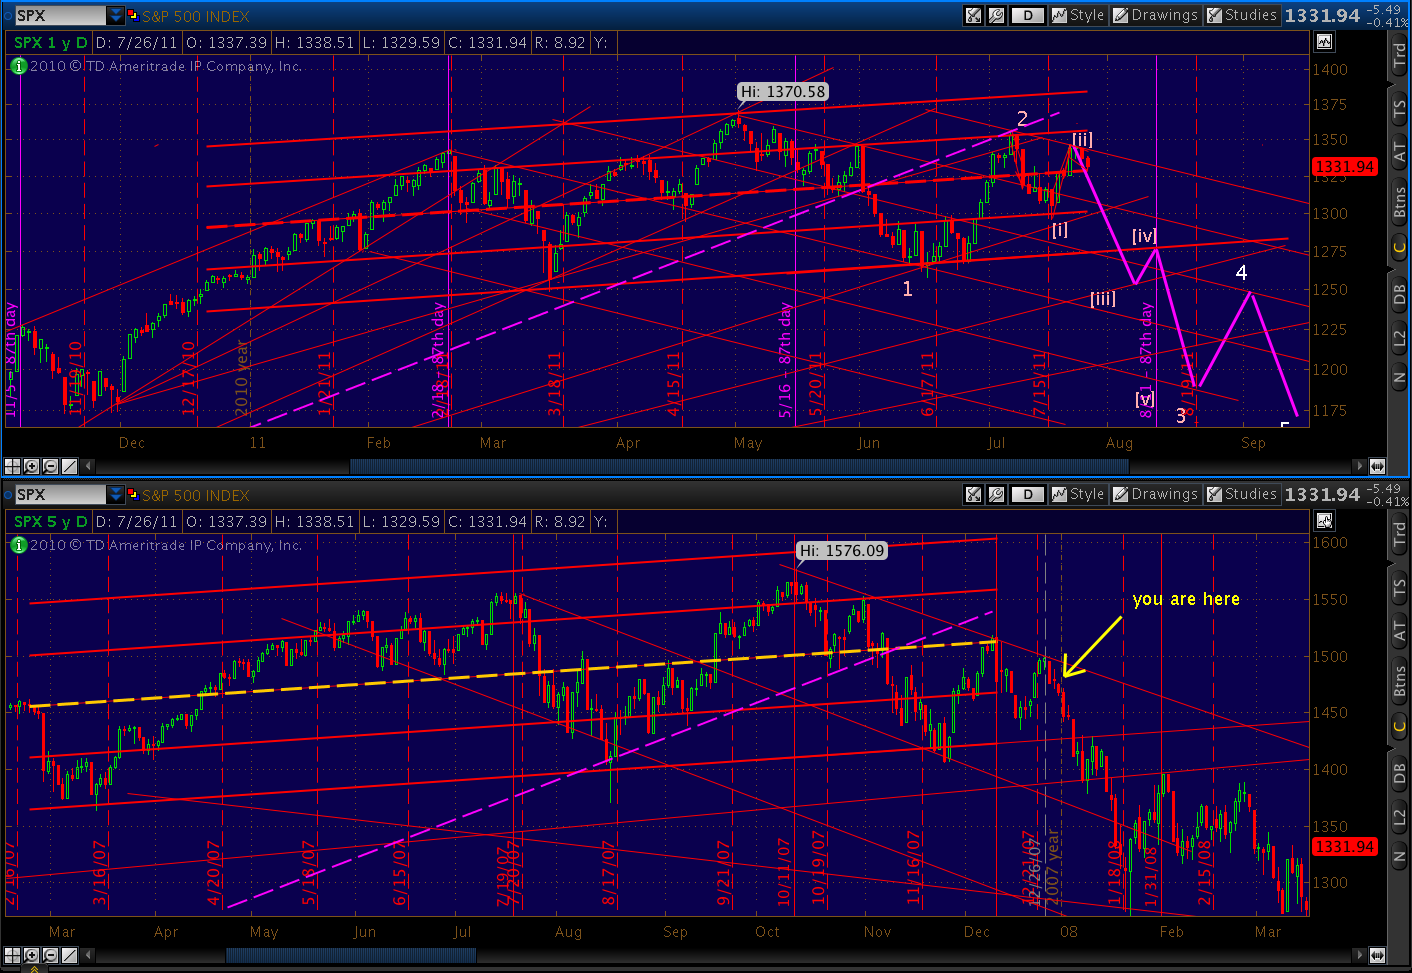
Those who have been following this blog for any length of time know why I’m wishing you a Happy New Year in July. Under the 2011 is 2007 theory, tomorrow is the equivalent of December 31, 2007 and the market is about to fall apart big time.
It’s been almost three months since the parallels first occurred to me. Although the timetable has no doubt been thrown completely off by Congress’ apparent inability to do their phoney-baloney jobs, the pattern has held up remarkably well.
The only obvious discrepancies have been the shape of the 3/16 – 4/15 advance and the last rally’s advance to the regression channel’s 1-standard deviation line instead of its midline. Otherwise, moves have occasionally arrived slightly faster or slower, but they’ve arrived as expected.
I was worried that a stick-save-debt-ceiling-resolution-rally-to-the-moon would ruin everything. But, in that sense, Congress has been very accommodating. They’ve bungled this mess so badly that any deal currently on the table is sure to disappoint everyone but those on the right side of CDS.
Toss in steadily declining economic indicators that — to these cynical eyes at least– spell a resumption/intensification of the recession, and there is little on the horizon to save the bullish case.
Other indicators I’m currently watching:
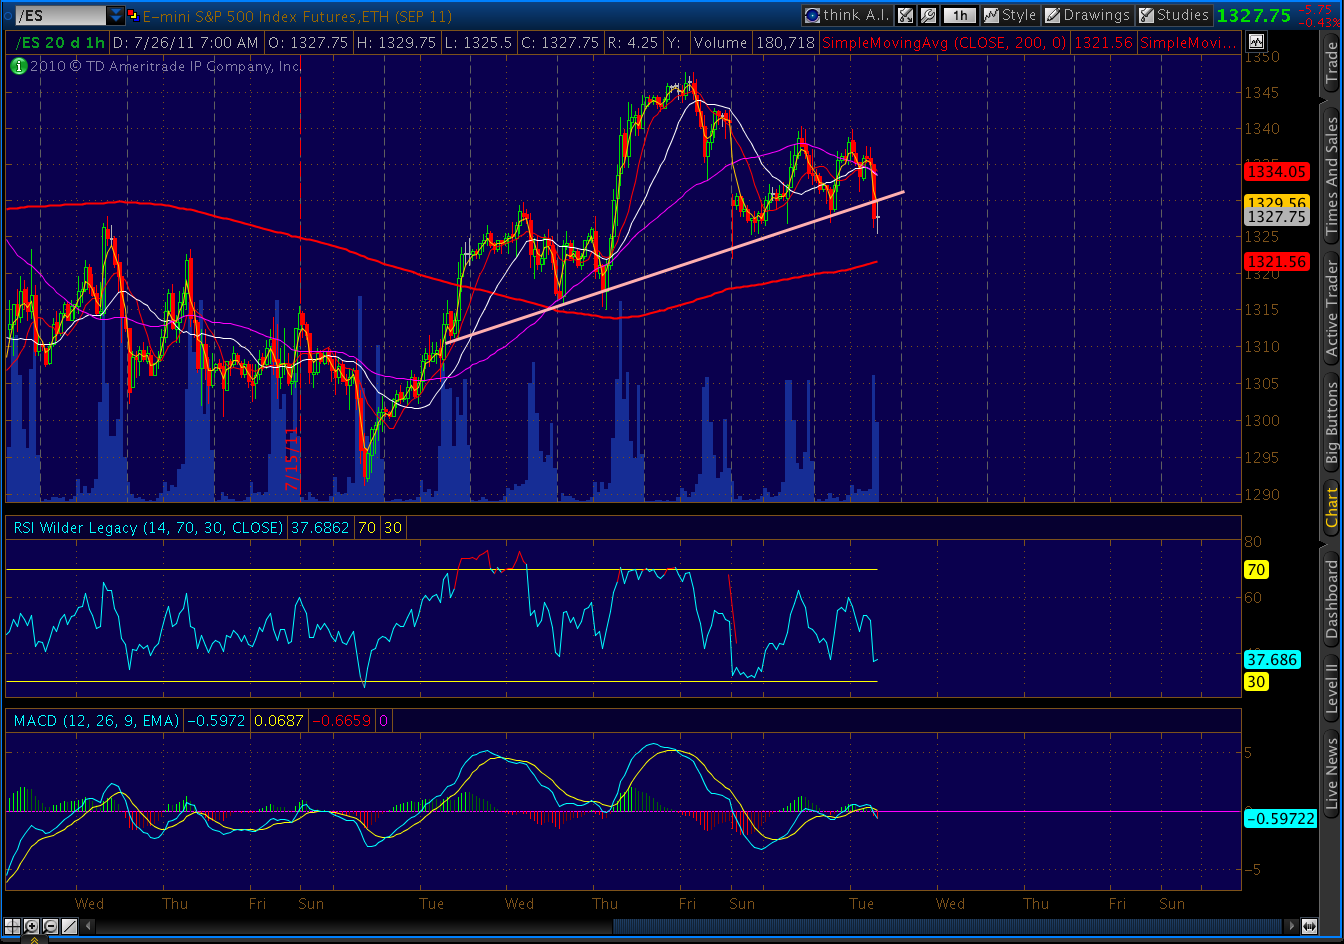
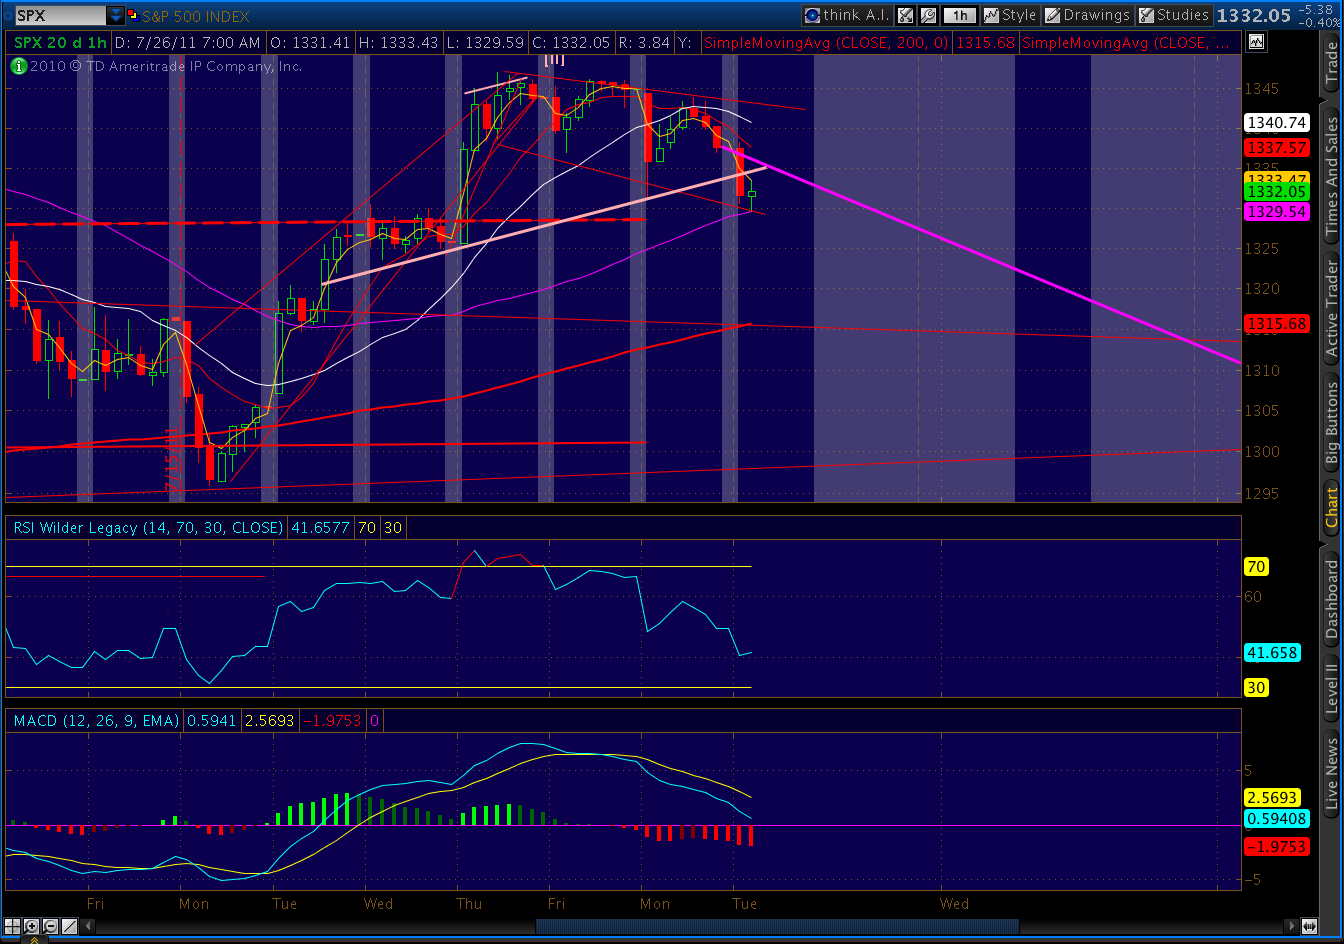
- a H&S; pattern on SPX over the past week — points to 1313 on cash market and 1303 on ES
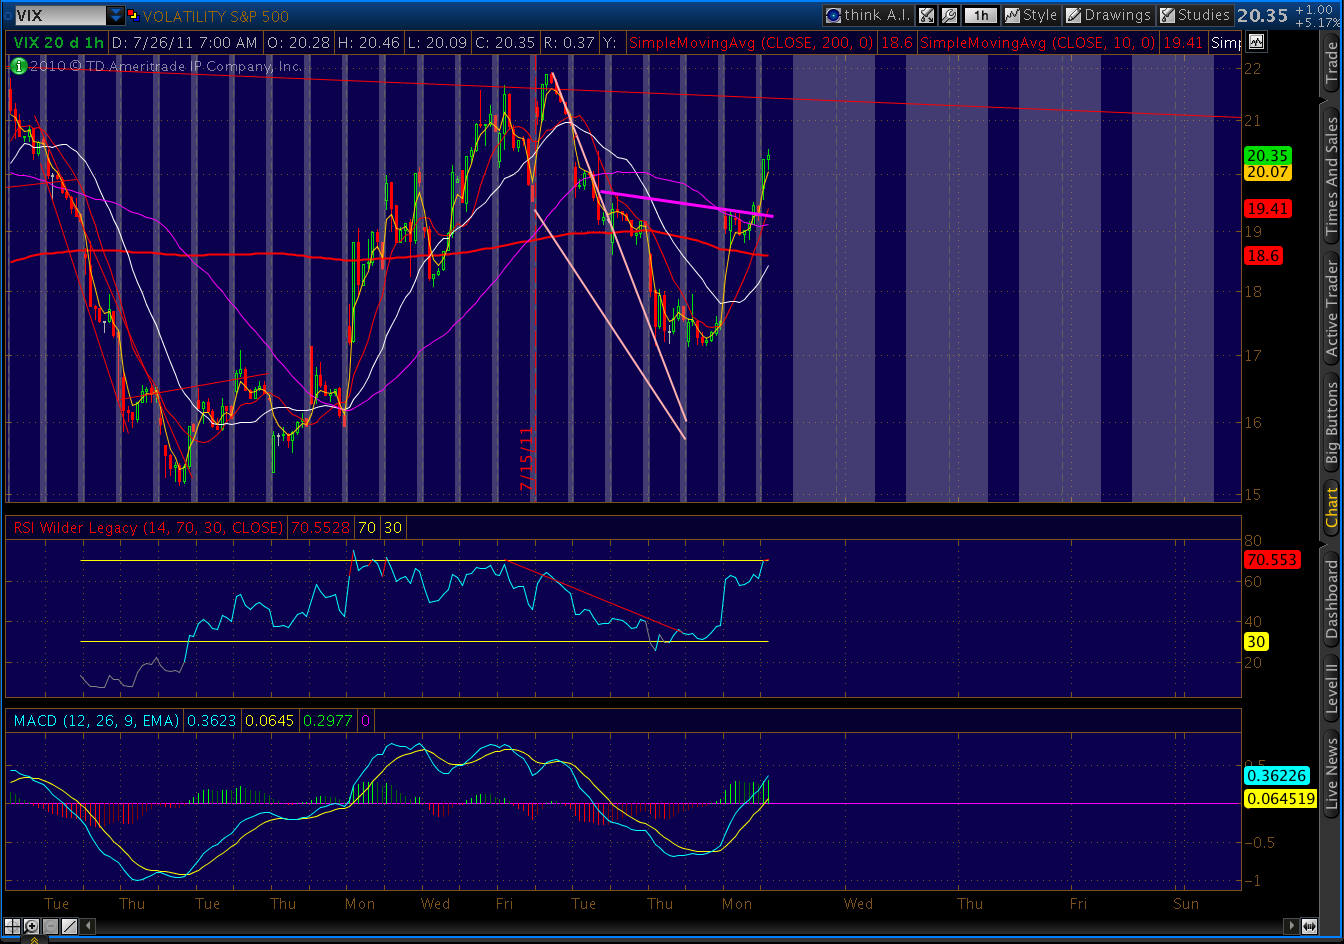
- an IHS pattern on VIX that indicates a value of 21+
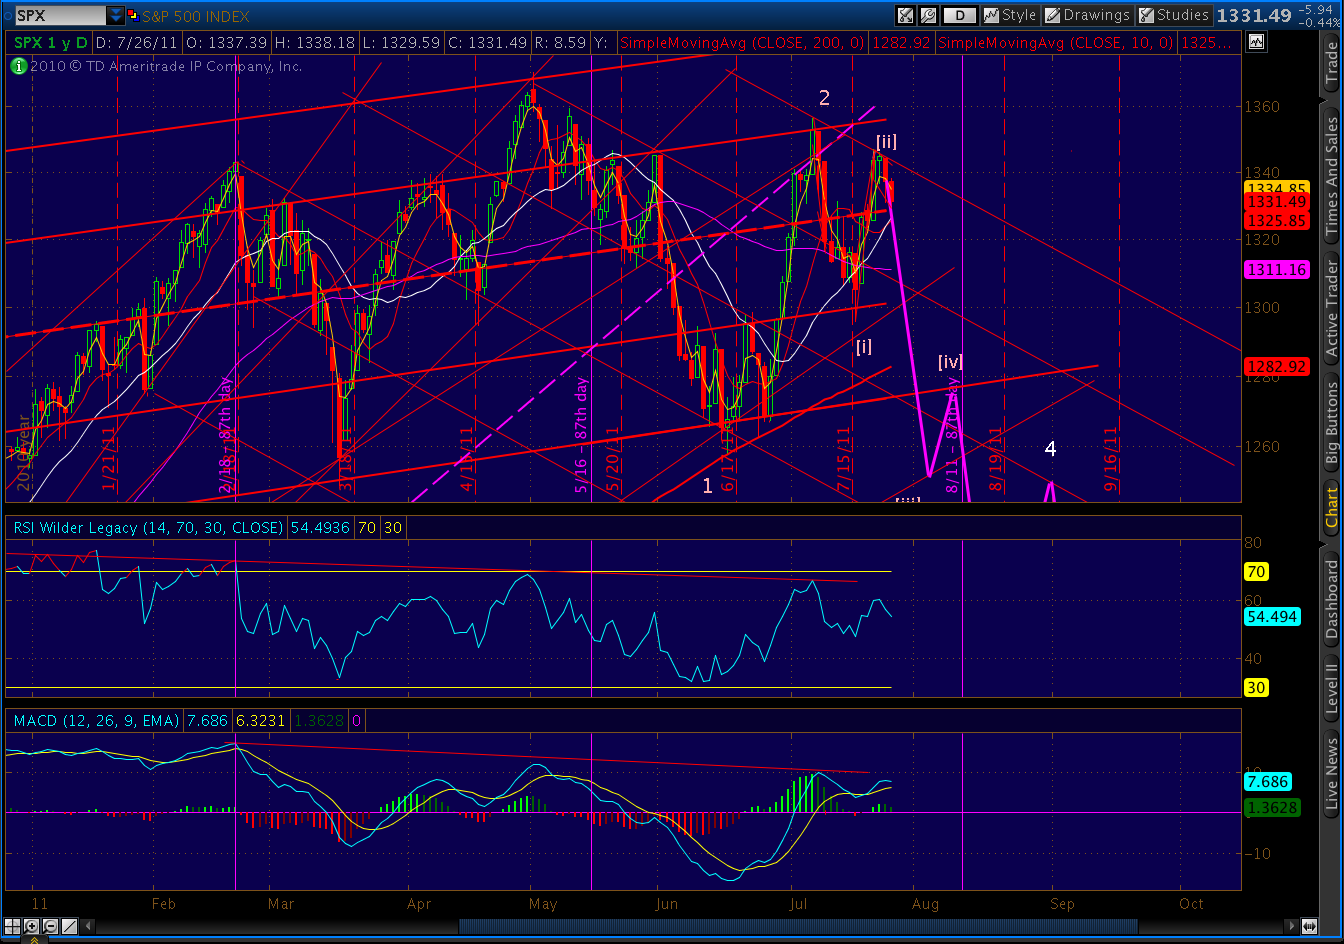
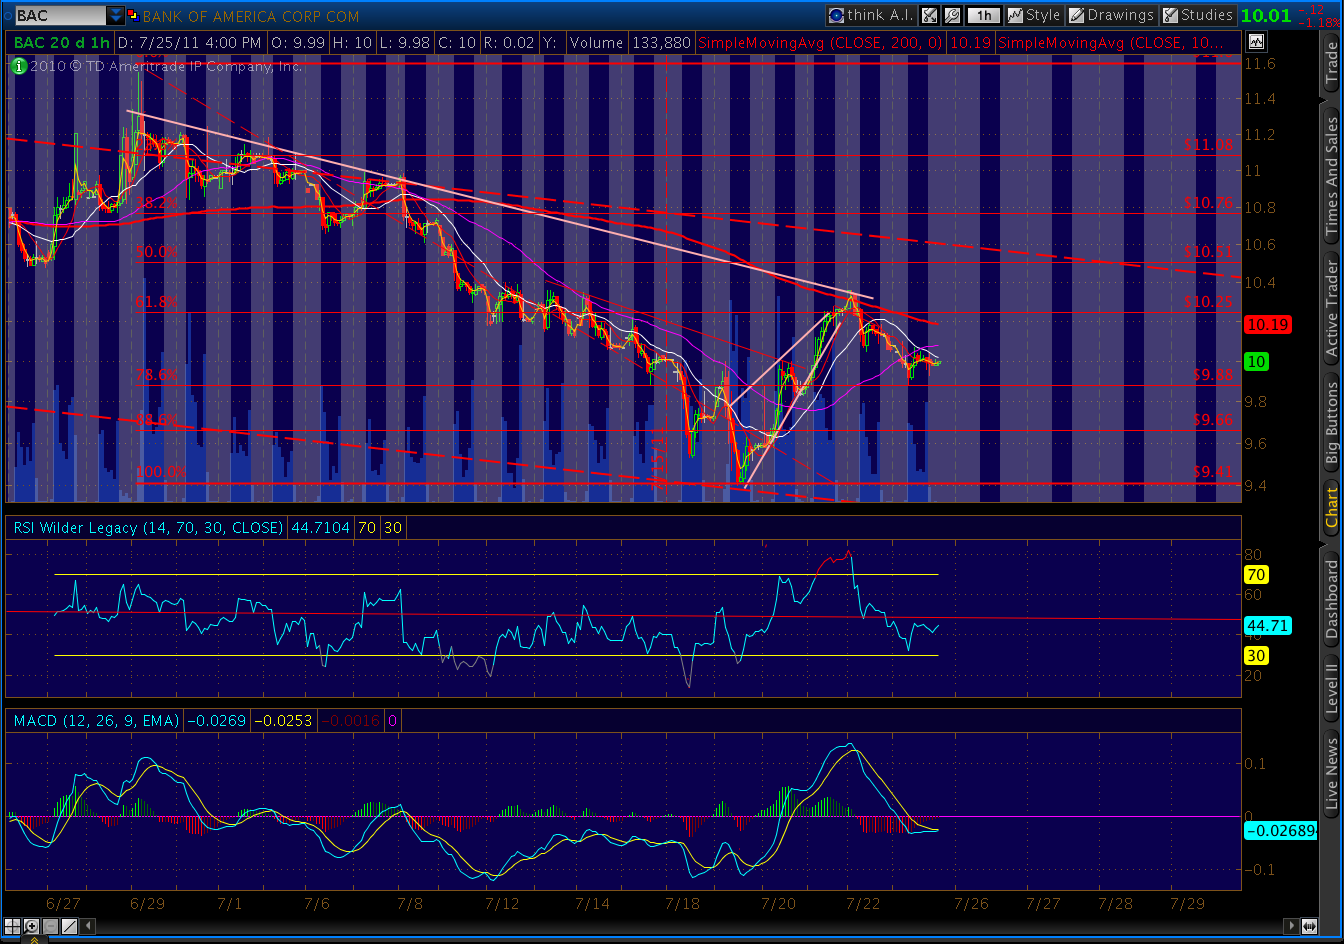
- the histogram, RSI and MACD on the daily charts have all turned negative
- breadth indicators are mostly negative
- VIX trading above its moving averages
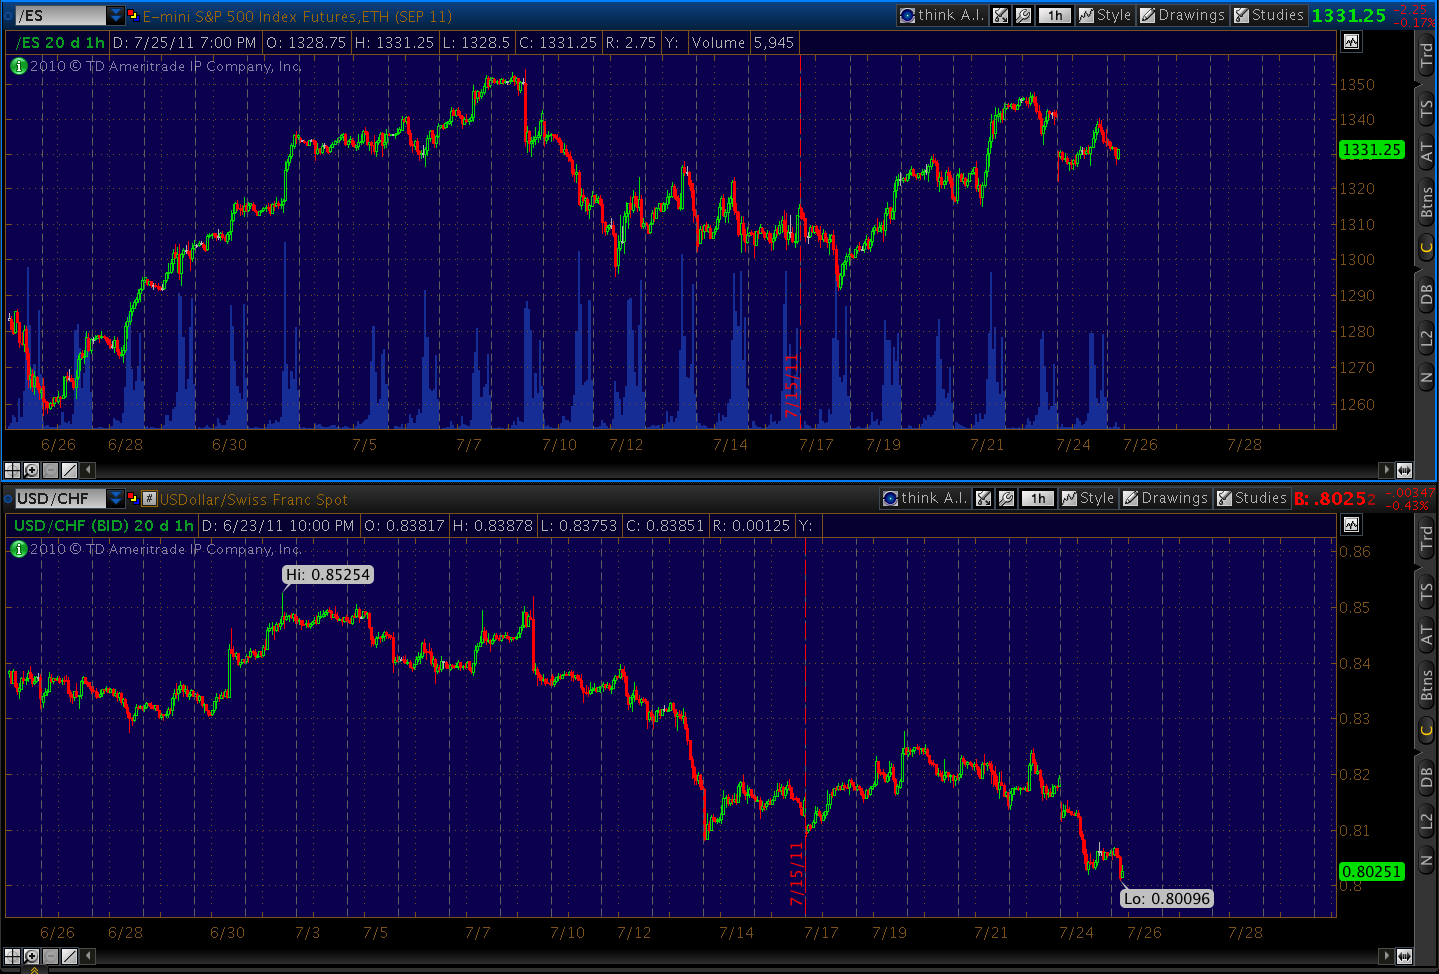
- EUR completion of a bearish bat pattern relative to USD, dollar bottoming relative?
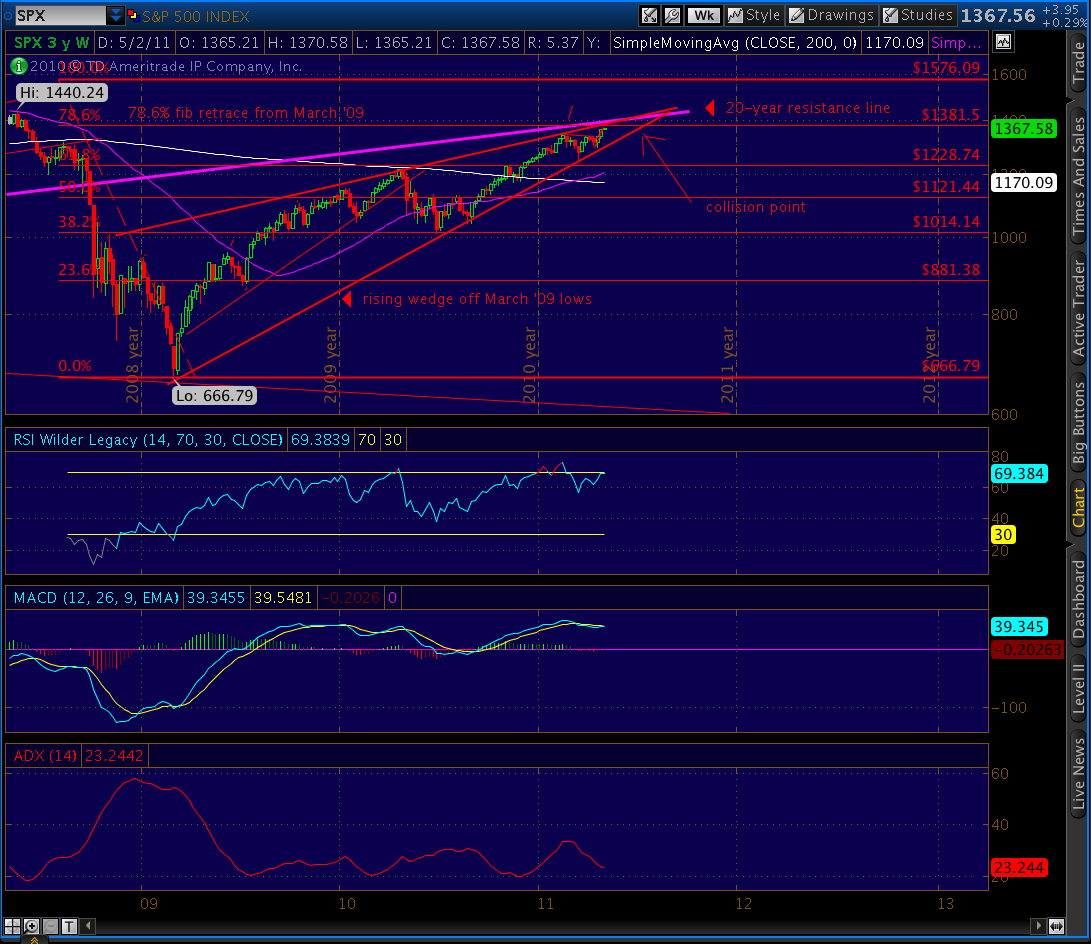
- divergence on weekly charts across multiple equities indices
As usual, I’ll post on specific patterns and indicators as I see them intra-day. There’s also a great deal of economic news coming out this week, and I’ll opine as I see fit.