Posts

  • Charts I’m Watching: November 29, 2011

    UPDATE:  4:00 PM

    Well, that was exciting.  Not!  Everything mentioned at 1:05 is still the case and, at this rate, will be the case for weeks to come.  I believe it was just too much to ask the market to maintain the strength of this morning’s rally in the face of the negative economic news, the American Airlines BK, conflicting soundbites from Fed members and Euro-gnomes, and incendiary iPhones.

    VIX continued to slip, having yesterday completed its backtest of its triangle.

    To me, DX continues to look like it’s backtesting the rising wedge it fell from yesterday.  Although, EUR/USD appears to be back in its falling wedge.  Hmmm….  Possibly just a divergence, a distortion the normal relationship between these two.

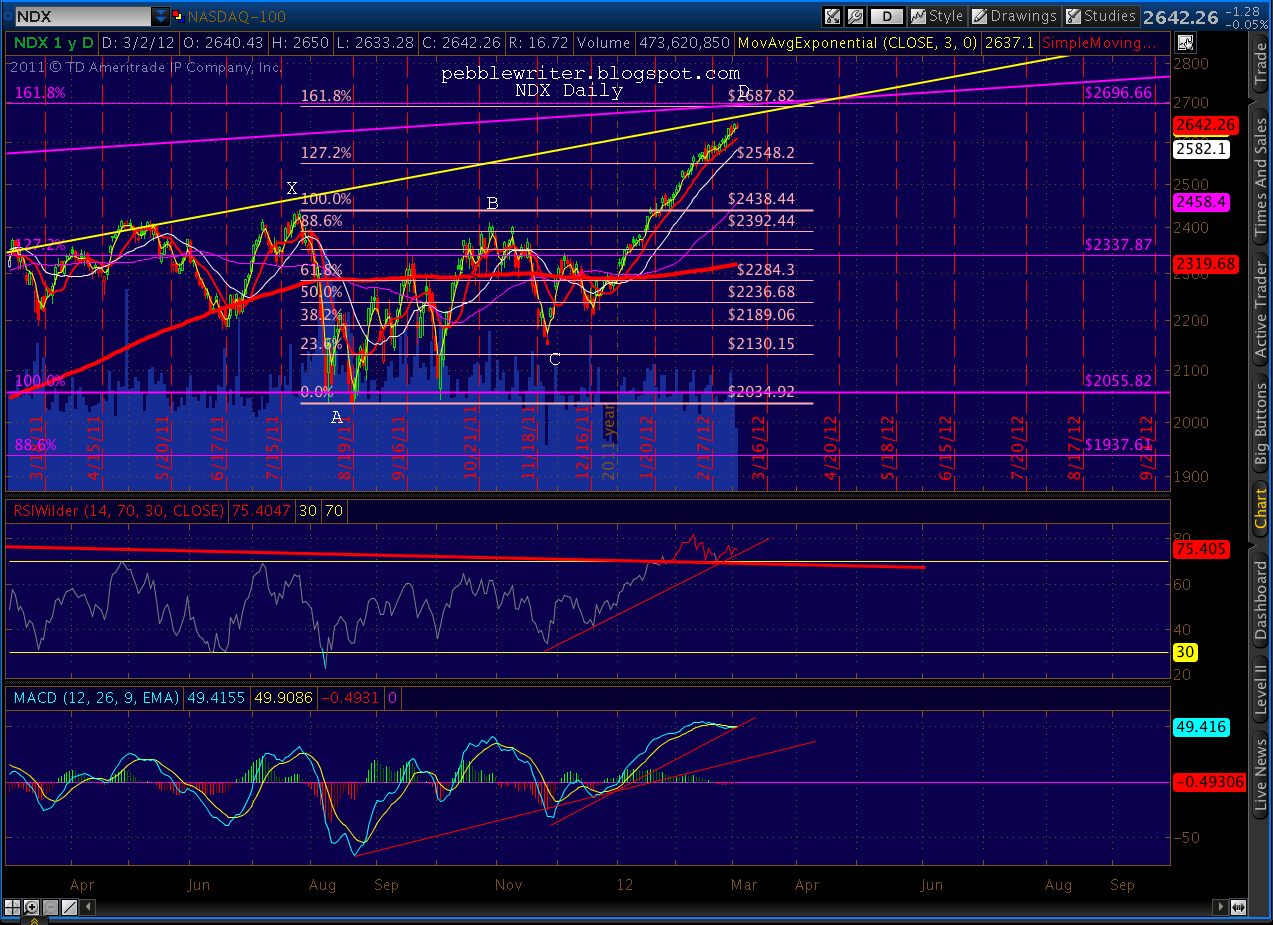
    Last, a quick peek at NDX shows it’s working on its own IHS pattern.  Six points to the upside would complete, and possibly add another 3%/75 points of payoff.

    UPDATE:  1:05 PM

    Backtesting the neckline here…

    …and, note the RSI trendline — should offer support for the next leg up.

    ORIGINAL POST:

    The Inverse H&S; I mentioned yesterday just completed.  The upside is 40 points or so, making it 1238.

    There are a couple of obvious targets for the termination of this wave.

    Point A is 1215, the Nov 1 low that fits most of the EW counts I’ve seen.  Point B would create EW “problems” but fits from the standpoint of the channels that have guided much of the past nine months as well as a TL off the recent highs.

    If we count the 1292 high as A of wave 2 instead of the completion of wave 2, it opens up lots of higher possibilities which I have discussed at length over the past week or two.  We’ll revisit these if/when they come into play, but the highest point I can see making a lot of sense is the 1307-1313 range.

    Remember, anything above 1292 would merely be completing a wave 2 — not a bull market resumption.  The trend is still down, and I see nothing on the horizon to change that.

    Note that Friday’s low completed a .618 Fib retrace of the 1074 – 1292 run, meaning it’s a very likely candidate for a Point B in a Gartley pattern.  A typical Gartley would put in a Point C somewhere between here and 1292 (points A or B from the top chart would do nicely) then drop to the .786 Fib level at 1121 before reversing again.  We’ll keep an eye on it.

  • Charts I’m Watching: November 28, 2011

    UPDATE:  1:30 PM

    Rally showing great breadth, could go quite a ways before erasing the recent oversold technicals.   Spit-balling here, but the potential inverse H&S; pattern setting up could be good for 40 points or so.  It would intersect with a TL off the 1292 top as well as one of our channel lines and the .618 Fib retracement of the 1292 to 1158 decline.  We’ll call the target 1241 for now.

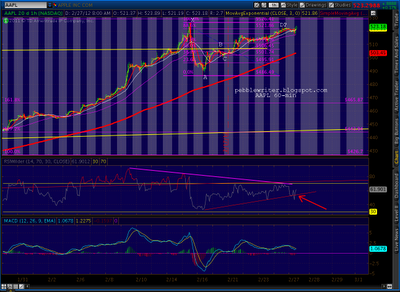
    The bullish Bat pattern we’ve been watching on AAPL is playing out nicely.

    UPDATE:  1:10 PM

    VIX, well off its lows of the day, appears to be backtesting the triangle it’s been in for about a month.  Looking back to August, VIX has established a sloppy downward sloping channel of sorts.  The bottom of the channel might act as a magnet if this rally were to gain steam.

    ORIGINAL POST:  9:45 AM

    Interesting stopping point for this morning’s bounce.

    Popular opinion (and my gut) has it that 1292 was the wave 2 top. However, we’re keeping an eye on the 2011 v 2008 comparison.  Day 150 (since the May 2 1370 top) is Friday, December 2.  While prices have obviously diverged from the 2008 pattern, this past Friday’s low (day 145) matches up to a reversal on day 144 in 2008.  Might day 150 still be significant? 

    More later.

  • Charts I’m Watching: November 23, 2011

    UPDATE:  11:30 AM

    The futures held the 1.618 line of 1167 until about 20 minutes ago, while SPX’s opening sliced through its 1.618 at 1177 like a hot knife through butter.  Now at 1164, is the rebound idea dead?

    EUR and DX are both pushing the bounds of their respective wedges (and Gartley’s).  If stocks are to rebound, we need a reversal right here, right now.   There aren’t any good harmonic supports at these prices, but there are a fan line and trend line worth taking a look at.

    Note the regression channel in the 2007-8 time frame.  It perfectly captures the highs and lows of that top.  I constructed some trend lines with the exact same slope and laid them over the 2011 top, connecting important highs and lows over the past year.   The slope is important, because it lends credence to the notion that these lines are legitimate, rather than the product of my bias.

    The two lines have thus formed a channel, the centerline of which is drawn as the dashed line.  It’s worth noting that this centerline did a number on the Mar 16 decline, but was exceeded by the wild swings we saw in August and September.

    Today’s plunge has paused right at the centerline, which might be significant.  It has also reached a fan line drawn off the Mar 09 lows through the Aug 9 low.  Either or both of these lines could act to arrest a further decline, but there’s no reason they have to.

    In short, the case for a rebound is hanging by its fingernails.  If either of these lines fail, there’s not a lot of support until 1115 (horizontal), and then 1100 (fan line off the Oct 4 low and also the .886 Fib.)  Keep an eye also on the positive divergence on the 5, 15, 30 and 60 min charts.

    ORIGINAL POST:  1:05 AM

    Just completed a perfectly-formed bullish Crab pattern on the futures at the 1.618 extension of 1167.25.

    Yesterday, SPX came within 4 points of completing its own Crab (1181 v 1177.)  So, it could be considered to have completed (96% of optimal AD.)

    On the other hand, SPX closed at 1188 today.  If the current decline in the futures market (-13) were to hold overnight, that would result in a more precise Crab pattern completion in the 1177 area — a gap down that immediately reverses if the pattern were to play out.

    If the SPX Bat pattern plays out, the most common potential targets (depending on which Point D is valid) are:


      .618 — 1239
    1.272 — 1305
    1.618 — 1340

    As mentioned yesterday, EUR/USD is very deep into a falling wedge and DX is very deep into a rising wedge.  AUD/USD is also very deep into a falling wedge.  Combined with the above patterns, conditions are ripe for a reversal of the past week’s weakness.

    Does that mean the bear isn’t playing out yet?  Not at all.  In my opinion, there’s still at least a 50% chance that 1292 was the high and we’re on our way to huge losses.  However, the flip side of that 50/50 equation is the possibility that wave 2 isn’t quite done.

    It’s days are numbered, though.  If it’s going to happen, it has to be pretty much immediately.  So, be careful.  Needless to say, a 100+ point rally between now and December 5 would trap an awful lot of bears.

    Of course, if we get a garden variety .618 reversal up to 1239 or so, we’ll have a very nice spot at which to add to existing shorts.  Such a move, BTW, would tag a TL off the Oct 27 (1292) and Nov 8 (1277)  highs.

    **************

    Looking at the big picture, there is a possible road map taking shape on the daily chart.

    The only problem is that this Harmonic pattern is neither fish nor fowl.  It reverses at the .786, which would indicate a Butterfly pattern.  That would also imply a completion at the 1.272 at 1433 or the 1.618 at 1530.  I don’t consider either of those targets as even remotely possible at this juncture.

    Bat patterns complete at the .886 Fibonacci, in this case 1324, which would also be in line with a trend line off the 1370 top through the Jul 7 high.  But, Bat pattern points B aren’t supposed to exceed .618 of the XA distance.  The .786 we see here should disqualify the pattern.

    Another way of looking at it is the place Point X at the 1370 May 2 high, which results in a Point B at a little higher than the .618 Fib — making it a Gartley that completes at a .786 Fib — in this case 1307.

    Of course, there needn’t be a harmonic pattern at play in order to identify a reversal target.  Wave 2’s often retrace to the .618, .786 or .886 Fib levels.  While the .618 ship has sailed, .786 and .886 in the 1307 – 1324 range are valid targets.

    It’s also worth noting that the original Gartley pattern, first introduced by H.M. Gartley’s Profits in the Stock Market (1935), made no reference to specific Fibonacci levels.  They’ve been added over the years by practitioners.  In the meantime, patterns that don’t quite fit the mold, but which are based on common Fibonacci levels, can and do play out all the time.  We’ll eventually find out what’s going on here, but for now we’ll just have to wait and wonder.

  • Charts I’m Watching: November 22, 2011

    UPDATE:  3:50 PM

    An updated look at the regression channel since the top…

    Looks like the midline should provide a good turning point, although a similar spot in 2008 fell quickly to that declining market.  Re 2008, next Friday is 2011’s 150th trading day since the May top.  This proved to be the ultimate turning point in 2008.

    Could we have a sharp rally in the next seven trading days?

    ORIGINAL POST:

    Market trying to make up its mind…

    VIX channel evolving into a triangle.

    SPX:  came within 4 of the 1177 Butterfly target, probably close enough to indicate the next move is up, but the near term is still a bit muddled.  I’m still mostly straddled here, with near-term bullish positions and longer-term bearish.  The RSI TL’s point to a breakout one way or the other before today’s close.

    If the Butterfly does play out, the reversal at the 1.618 extension (1177) instead of the 1.272 means the .618 AD retracement target is 1138 instead of 1146 we talked about the other day.

    The EUR falling wedge we were watching has the look of having broken out, but the move isn’t very convincing yet.  We got a backtest, but the initial subsequent rise hasn’t impressed me.

    It would be too easy to slide the upper bound of the wedge up an smidge, and consider the whole thing to have not broken out at all — YET.  Either way you look at it, I see a wedge that’s due to break out.

    Similarly, DX has established a nice rising wedge that reaches its apex on Friday, meaning it should break to the downside before then.

    In sum, this feels like a consolidation, with bears trying to work up the courage for another push down — but just not able to shake the feeling that they’ll get trapped yet again.  And, bulls, wondering if Hopium might have finally exhausted itself in the avalanche of negative news.

    But, we are clearly due for at least a decent rebound in the short run, possibly something more, before the next leg down.  And, for diehard bulls, there is still room for a larger C wave up before we consider wave 2 “done.”

  • Charts I’m Watching: November 21, 2011

    UPDATE:  11:50 AM

    Watching the falling wedge set up on EUR/USD:

    The Butterfly I’ve been watching overshot the 1.272 extension, but the decline seems to be running out of steam.  We’ll see if the 1.618 extension at 1177 has any better luck.  That would also mark the 2.24 extension for the Crab pattern.

    We’re also seeing divergence on the 5 and 15-min charts.  I took a stab at a few OTM calls for what could be a nice snap back.

    ORIGINAL POST:  9:15 AM

    If the cash market opens where the futures currently are, we’ll complete both the Butterfly and Crab patterns I pointed out last week.  If they play out, look for a strong rebound over the next several days.

    To be clear, I would view such a move as leg C in a corrective 2nd wave, not the resumption of the bull market.  In fact, even though these patterns are clear and incontrovertible, there’s a pretty good chance that they produce a hiccup rather than a full-fledged reversal.

    Any reversal should run its course within the next two weeks — most likely by December 2-5.

    The Butterfly (in red) finishes at 1198.52 (the 1.272).  The smaller bullish Crab pattern (in purple) completes at its 1.618 at 1201.71.  

    Potential Targets:

    Butterfly:     .618 – 1246 
                       1.272 – 1298                 
                       1.618 – 1325

    Crab:           .618 – 1242
                      1.272 – 1284
                      1.618 – 1307

  • November 18, 2011: The Line in the Sand

    UPDATE:  12:05 PM

    The market seems to be in full OPEX mode, with every attempt at a breakout — up or down — quickly aborted.  At this moment, it’s pushing toward the downside, which is a good reason to revisit the harmonic picture.

    A bullish Butterfly pattern (in red) that began Nov 1 finishes at 1198.52 (the 1.272).  While, a smaller bullish Crab pattern (in purple) that began Nov 9 finishes at its 1.618 at 1201.71. 

    There is also horizontal support around 1200, not to mention obvious round number support.  While yesterday’s 1209 low might be close enough to consider these patterns completed, I would normally look for a more precise tag before playing the rebound.   Given that this is OPEX Friday, and MM’s are under water after yesterday’s plunge, I won’t be surprised if we see a ramp job kick in if we get any closer to 1200.

    If they play out, initial (.618) targets for a rebound would be 1246 and 1242 respectively.  Common extension targets for the Butterfly would include the 1.272 at 1298 and the 1.618 at 1325.  Higher targets for the crab would include the 1.272 at 1284 and the 1.618 at 1307  — the same value as the 78.6 Fibonacci retracement of the 1370 to 1074 plunge.

    Also note that current prices would make a very good Point B (about .382) for a much larger harmonic pattern with Point X at 1074 and A at 1292.  A leg up to 1242-1246 would make for a nice Point C.

    ORIGINAL POST:  4:30 AM

    Ages ago, on November 9, I expressed my frustration at being unable to more definitively discern the market’s next move.  From that post:

    My favorite two scenarios are that: (1) wave 2 is over and we’re on our way down; or, (2) Tuesday’s high at 1278 (and a .786 Fib level off 1292) is a Point B that’s part of a larger Butterfly pattern.  The downturn I’m expecting Wednesday will lead to a higher low (Point C) between 1215-1238 that reverses for a final rise to 1307-1313 around December 5 (day 150 from the analog.)

    I went on to cover my ass explain:

    The key is where Point C lands.  It could go as low as A, but shouldn’t be any lower (with rare exception.)  In fact, 1215 is my defacto line in the sand to determine whether we have one last leg up or not.
    Well, do you ever get the feeling that the universe is messing with you?  We got the “downturn I’m expecting Wednesday,” a 30-pt plunge that put bubbles in this bear’s champagne.  We reversed there, establishing a potential Point C smack dab in the middle of the range I envisioned.  
    It was earlier than I expected, but otherwise okay.  Now we could head back up toward what I presumed would be 1307 on December 5.  Then, along came Unicredit’s $10 billion loss, Fitch’s stating of the obvious, and increased media scrutiny of the Euromess and the Supercommittee superflop.
    Where does that leave us?
    Do you ever get the feeling the Universe is messing with you?  Do you ever wonder if there’s a secret government installation, buried deep under the tundra somewhere, full of ex-Goldman guys whose sole purpose it is to read all the blogs out there and rig the market to inflict the maximum amount of frustration and self-doubt?  Do you ever sit alone in the dark at 4:30 am, asking rhetorical questions?
    (if you answered yes to two or more, you too might have a future in blogging.)
    There are all kinds of reasons this turd of a market should turn down right here, right now — without apologies, without looking back.  The arguments are clearly laid out in all the financial newspapers and websites.  Heck, you’ve been hearing them from me for months.

    But, then there’s the fact that we couldn’t push convincingly through 1215 yesterday.  I know, we hit 1209 intraday, but we closed at 1216.  Coincidence?  Maybe, but it’s also possible that the triangle I’ve been harping about was one of the 46% that break downward, establishing a decent Point B in a larger A-B-C leg that’s heading for 1307-1313 on December 5.

    For now, I’m going to consider that “line in the sand” as bothered, but not broken.  At the very least, we’re due for a bounce off of 1215.  Whether it’s an OPEX-infused backtest or a larger leg up is still up in the air, in my opinion.

    We have positive divergence on the short-term charts; VIX is forming a falling wedge; and, surprisingly (not), a new rumor about some marvelous financial engineering that will save the Euro, once and for all (it won’t.)

    And, finally, my gratuitous attempt to blind you with science…  The 2008 v 2011 analog I’ve been reporting on since last May says wave 2 isn’t over until day 150 — about 10 sessions from now.

    All I’m saying, folks, is this is belt and suspender territory.  I’m short as can be, but I bought a nice little insurance policy yesterday that leaves me effectively straddling the market in the short run.  I may leave some profits on the table, but just in case Friday isn’t the big downdraft so many others are predicting, I’ll sleep better going into the weekend.

    Good luck to all.

  • Charts I’m Watching: November 17, 2011

    Finally, a nice crack in the market.  We’re currently testing the 1215 area I’ve referred to as the line in the sand.  A break here greatly helps the bearish case, but I’m remaining cautious until we move decisively through these levels. 

    The chart below shows negative divergence on the 5-minute RSI.

    Note also a potential Butterfly pattern that reverses just below 1200, and the .382 Fibonacci from the 1074 to 1292 move at 1209.43.

  • Charts I’m Watching: November 15, 2011

    UPDATE:  1:15 PM

    Here’s a little better view of the alternatives I see for the next move.  Note the triangle apex is about December 5, which matches the 2011/2008 analog precisely.

    Note also that the past two OPEX closing prices have been roughly in a straight line with this month’s 1260.  Also, 1257.58 is the .618 Fibonacci retracement of drop from 1370 on May 2 to 1074 on Oct 4.  In other words, it’s quite likely we’ll close Friday within spitting distance of 1260.  After that, all bets are off.

    As to the alternatives, here’s how I see them stacking up.

    The Butterfly pattern that’s been forming could complete at 1313.67 (the 1.272), although they occasionally extend to the 1.618, which would be 1340.  I consider 1340 unlikely, as it would involve the market breaking through a very important trend line coming off the May 2 highs (the dashed, purple line.)

    Also important is 1307, which marks the .786 Fibonacci retracement of the above-mentioned move.  Since 1307 and 1313 are so close to one another, I would consider that range a reasonable target for the upside, if it occurs.

    Another pattern supporting the upside scenario is a channel that’s formed off the October bottom.  The midline points to the 1307-1313 range sometime around December 7-13.

    The big question remains whether a higher high is in the cards or not.  After doing a lot more research, I am only slightly less confident than the 50/50 I’ve been over the past week or two.

    Take a look at the RSI’s major trend lines, seen as a triangle on the daily chart below.  The TL’s (solid purple) converge on around December 5.   A major increase in stock prices would probably entail a break above the upper trend line — something that’s been very difficult to accomplish going back as far as January 2011.

    Each previous occurrence of converging trend lines on the RSI daily chart set up a significant downturn.  The downturns, which occurred when the lower RSI trend line was broken, are marked with a yellow asterisk.  Follow the yellow vertical time lines upward to see the associated SPX price action.

    As mentioned above, the most recent lower trend line (purple, since Aug 9) is converging with the upper TL around December 5.   The market must break, one way or the other, out of the converging lines.  These similar past patterns suggest that move will be down, as do the ones from 2007-2008:

    BTW, it’s interesting that the last TL break on the right occurred on May 2, two weeks before the actual high of May 19.  Look closely and you’ll see that, on May 19, RSI was backtesting its trend line.  While the market moved 18 points higher, the RSI came in lower — in a classic example of negative divergence.  I won’t be surprised if the same happens in this market.

    UPDATE:  12:15 PM

    One of the my favorite of TOS’s limited charting capabilities is the regression channel.  You get to pick two points — the start and the finish — and it does all the rest for you.  It’s not only easy, it’s pretty bias-proof.  Other than gaming the start and finish lines, there’s no way to impose my directional bias on the results.

    Here’s what I’m studying this morning:

    In my opinion, we have at most three weeks during which to match up to 2008’s moves.  I’ve selected December 5 as the most likely day the bear market resumes — although it could happen anytime between now and then.   The only question, in my mind, is whether we turn down from these levels or whether we go back up and tag a slightly higher high — say, 1307-1313.

    Once we do turn down, it will be a much more powerful decline than we saw in August.  In fact, it should be at least as powerful as the decline we saw in the latter half of 2008.  Those with large equities portfolios should consult with their advisor asap about hedging them, or at least placing stops.

    ORIGINAL POST:  2:15 AM

    Whether you call it a flat or a triangle, the market is looking very much like a coiled snake.  The line we’re oscillating around is 1258, the neckline of the large H&S; that broke to the downside on August 1.

    More later.

  • Charts I’m Watching: November 14, 2011

    UPDATE:  10:00 AM

    And, this concludes the regime-change rally.  Did you catch UniCredit’s $10 billion quarterly loss?  The big Italian bank will shake up its investment banking and trading operations…presumably to avoid any future trading losses and investment impairments like it just suffered.  It will also go to the capital markets to meet its Basel III capital requirements, said raise to total…$10 billion.  It’s being billed as a strengthening maneuver, but given that it matches the recent quarterly loss, it looks more like plugging a recently discovered hole in the dike.

    Much, much more negative news and commentary regarding the Euro this weekend — commentary we’ve been writing in these pages for months.  Even the MSM is getting into the game, which means the downside could accelerate.  But, it also elevates the risk of being oversold from time to time, as spec money piles on top of longer term positions.

    SPX is down 10, but is looking choppy.  Friday’s Butterfly could pay off as low as 1242, but I’m still keeping an eye on the larger Bat that completes at 1284 (.886) or extends to a Butterfly at 1314 (1.272).

    Friday is OPEX, so look for strong resistance to any major moves until Monday.

    ORIGINAL POST:  12:15 AM

    Thanks to the regime change in Italy, the EURUSD has shot up a whopping .11%.  In other words, there is a well-deserved skepticism as to whether having a new driver at the wheel will make any difference to the Euro’s trajectory as it sails off the cliff (hint: it won’t.)

    The bump does, however, complete a bearish Bat pattern on EUR/USD.

    The next few weeks will be critical to the Euro, as it will either verify the steep, downward sloping channel I’ve drawn for EUR/USD or not.

    If this channel (which is the exact same slope as the two previous channels) holds, we’ll see the Euro drop to 1.16  or lower by March at the latest.

    The other impact of the bump in the Euro is the corresponding 6-8 pt bump in the eminis.   If this level holds into the cash market, it could complete the small Bat pattern we’ve been watching at its .886. at 1271.

    A reversal here wouldn’t necessarily mean a huge downdraft.  It would be perfectly in keeping with a triangle wave B that leaves open the possibility of a C wave to 1307-1313 over the next several weeks.  I still see a 50% chance of reaching those levels by December 5 and then reversing hard.