 A year ago today, the establishment was shocked by the election of a decidedly different kind of president. Countless articles have been written about the wisdom and effectiveness (or, lack thereof) of his policies, executive orders and tweets.
But, the fact remains that stocks have rallied sharply since November 8, 2016. The S&P 500 (SPX) is up 21.1%, while the Dow has gained 28.5% and the Nasdaq has piled on 30.3%.
Some fundamental developments have tilted bullish. But, what I wrote last March [see: Why the Trump Rally is a Fraud] is as true now as it was then.
I very seriously doubt that Trump, nor anyone for that matter, can sharply expand spending while slashing taxes without generating higher inflation and, thereby, higher interest rates.
Contrary to Trump’s insistence that he is responsible, the rally has largely been the result of an unprecedented level of central bank intervention and price management and a striking evolution in the way stocks trade. 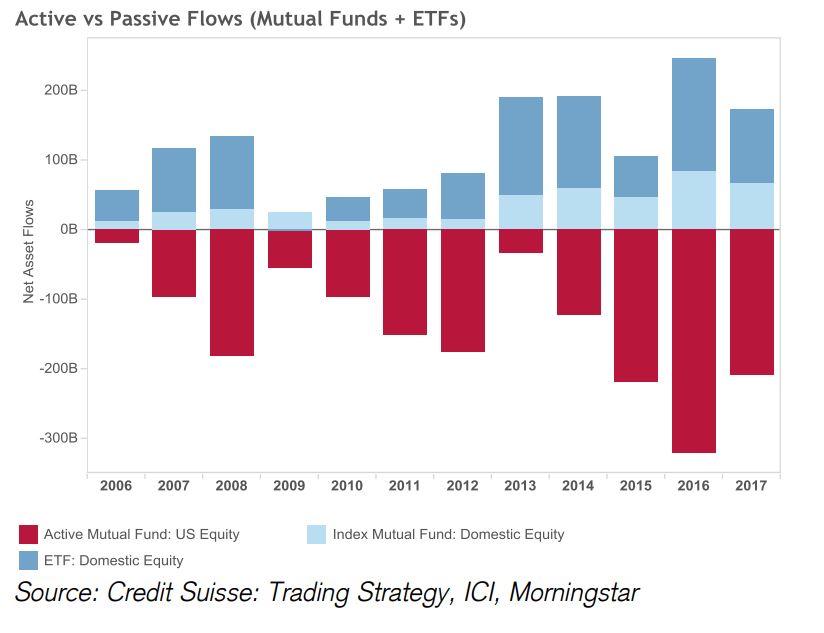 Passive investment strategies of all stripes (indexers, closet indexers, ETFs and other trend following/shadowing machine-based strategies) are now estimated to comprise over 80% of daily equity volume. As we’ve discussed many times, this creates a feedback loop that is especially sensitive to algorithm inputs.
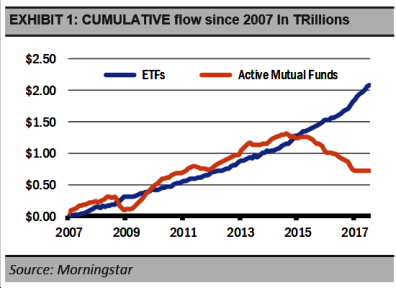 When active, fundamentally-driven managers ruled, news mattered. Earnings mattered. Geopolitical events mattered. These inputs were noodled on by thousands of analysts and portfolio managers around the world who would then decide how they should affect the price of equities.
Today, automated trading systems receive information electronically and, within a fraction of a second, buy or sell on that information. A determination has already been made (by the algorithmic model in use) as to whether a particular event is bullish or bearish. And, for the vast majority of the algos, a trade is placed without any additional human involvement.
What follows, then, is a cascading sequence of events as trend-following strategies, indexers and other passive strategies follow along. All that’s really needed to start a rally, then, is that initial input that causes the algos to buy in the first place.
It’s the perfect setup for central banks which: (1) needed something other than quantitative easing to drive equity prices, and (2) have unlimited access to funds at no cost (when interest rates go negative, they actually get paid to take in money.)
The three chief inputs I see having the most influence every day are VIX, USDJPY and CL. We’ve discussed them at great length over the past several years, but it’s worth reviewing them in this particular time frame.
USDJPY
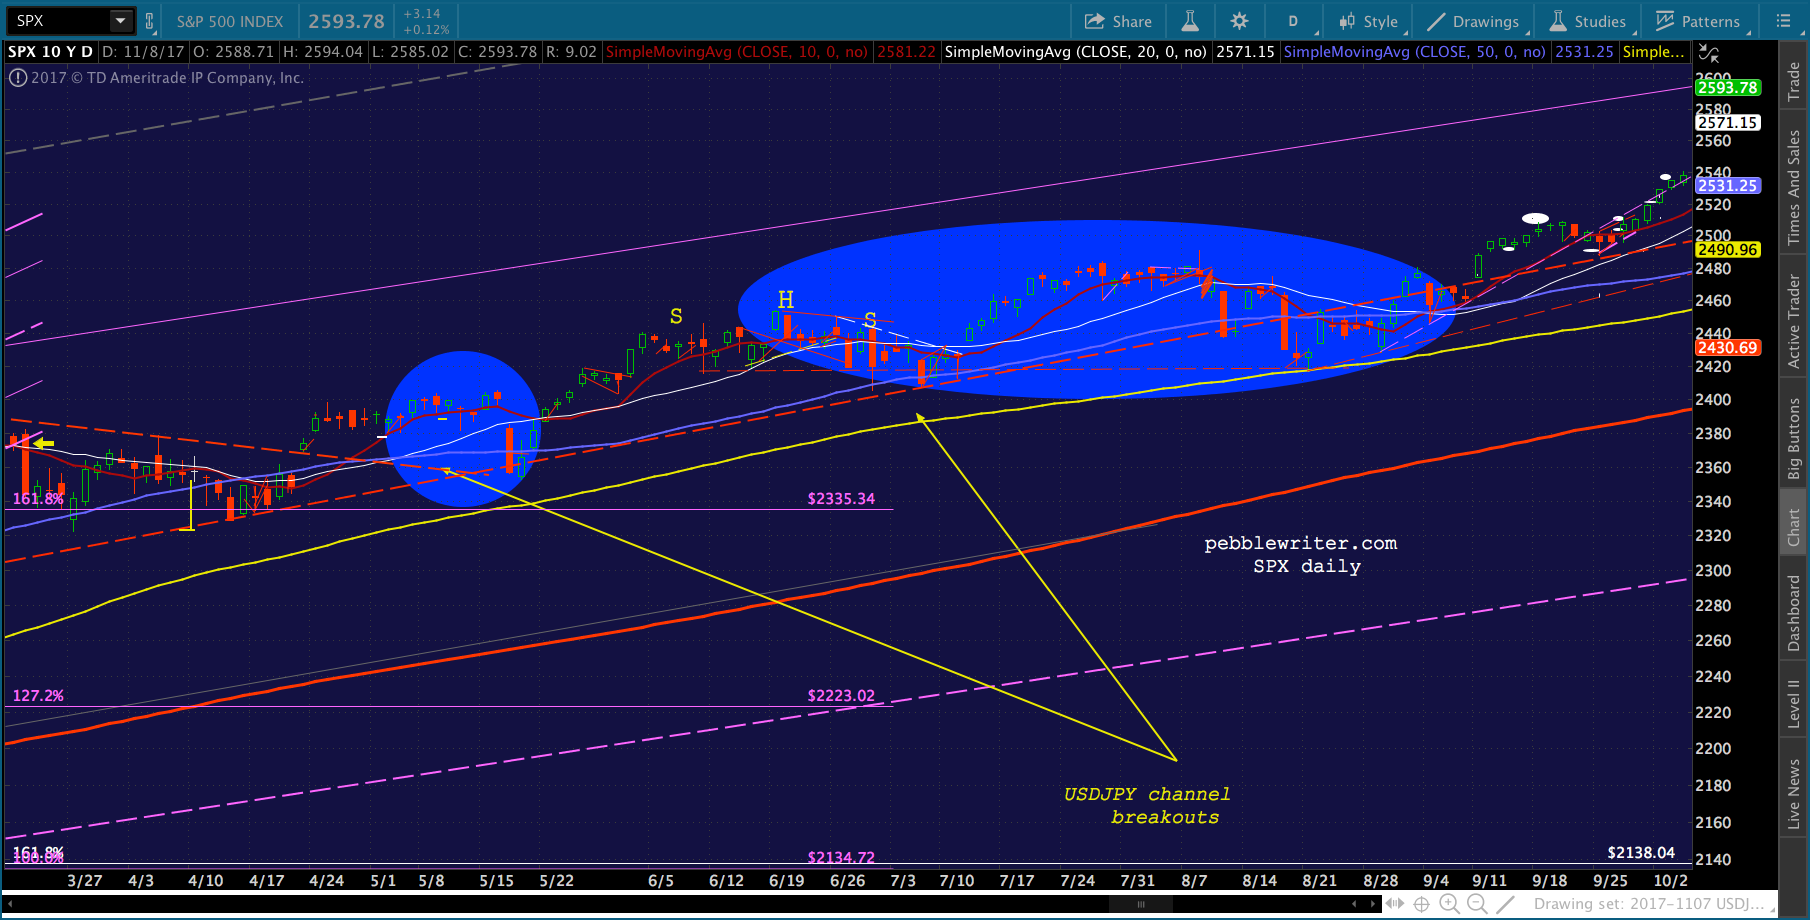
The USDJPY, part and parcel of the yen carry trade, basically saved the markets post-election. The pair soared 18% in only five weeks from its lows — experienced after it was apparent Trump had won the election and S&P 500 futures (ES) had sunk 4.5%.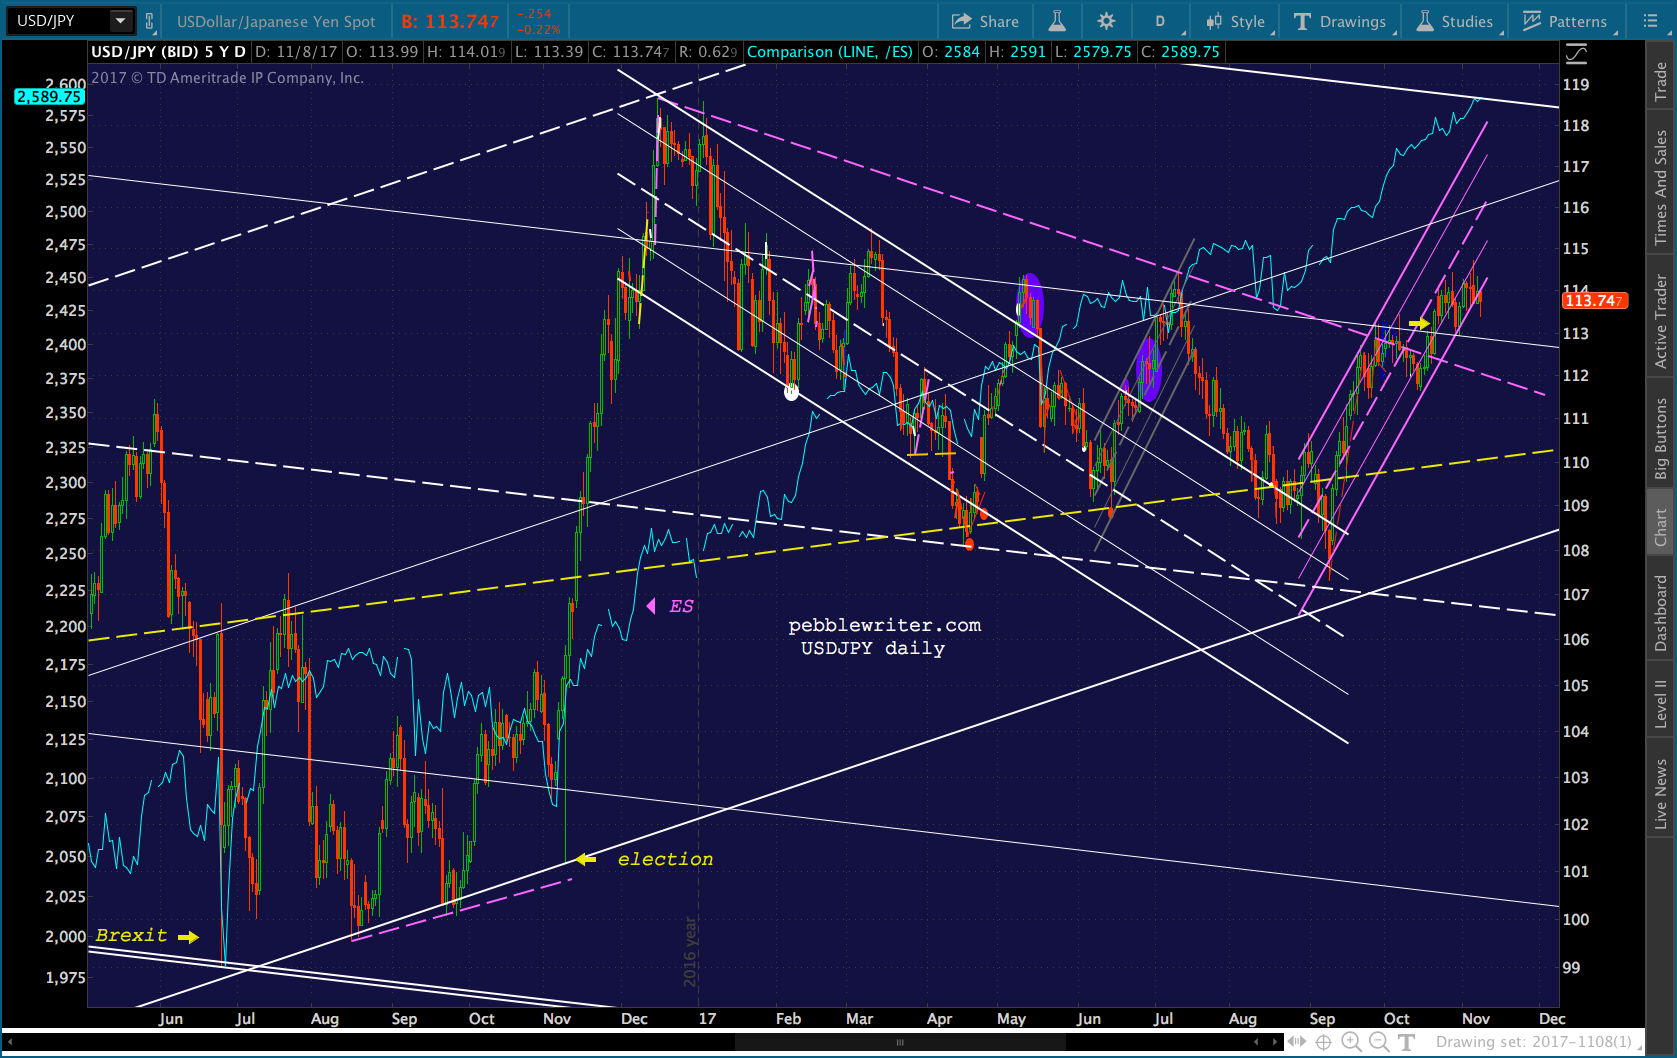 A few things should be obvious from this chart. First, USDJPY wasn’t just saving stocks from a 4.5% plunge. It was saving the S&P 500 from the deep plunge that surely awaited below the critical Fibonacci 1.618 extension at 2138.
Second, when USDJPY peaked on December 15, ES managed to continue rallying. We’ll discuss “how” in a moment. Third, the orderly descent from that peak — the well-formed channel shown in white — was interrupted by a brief, false breakout in May and another, longer one that lasted from June to September.
The initial breakout was instrumental in helping SPX remain above another 1.618 extension at 2335 and the second enabled it to remain above a rapidly-rising trend line (which it is still riding), an IH&S target at 2420, and the 100-day moving average.
The second breakout was also a head fake, as USDJPY’s “backtest” which followed occurred at lower prices. But, all the algos cared about was that USDJPY had broken out of a falling channel.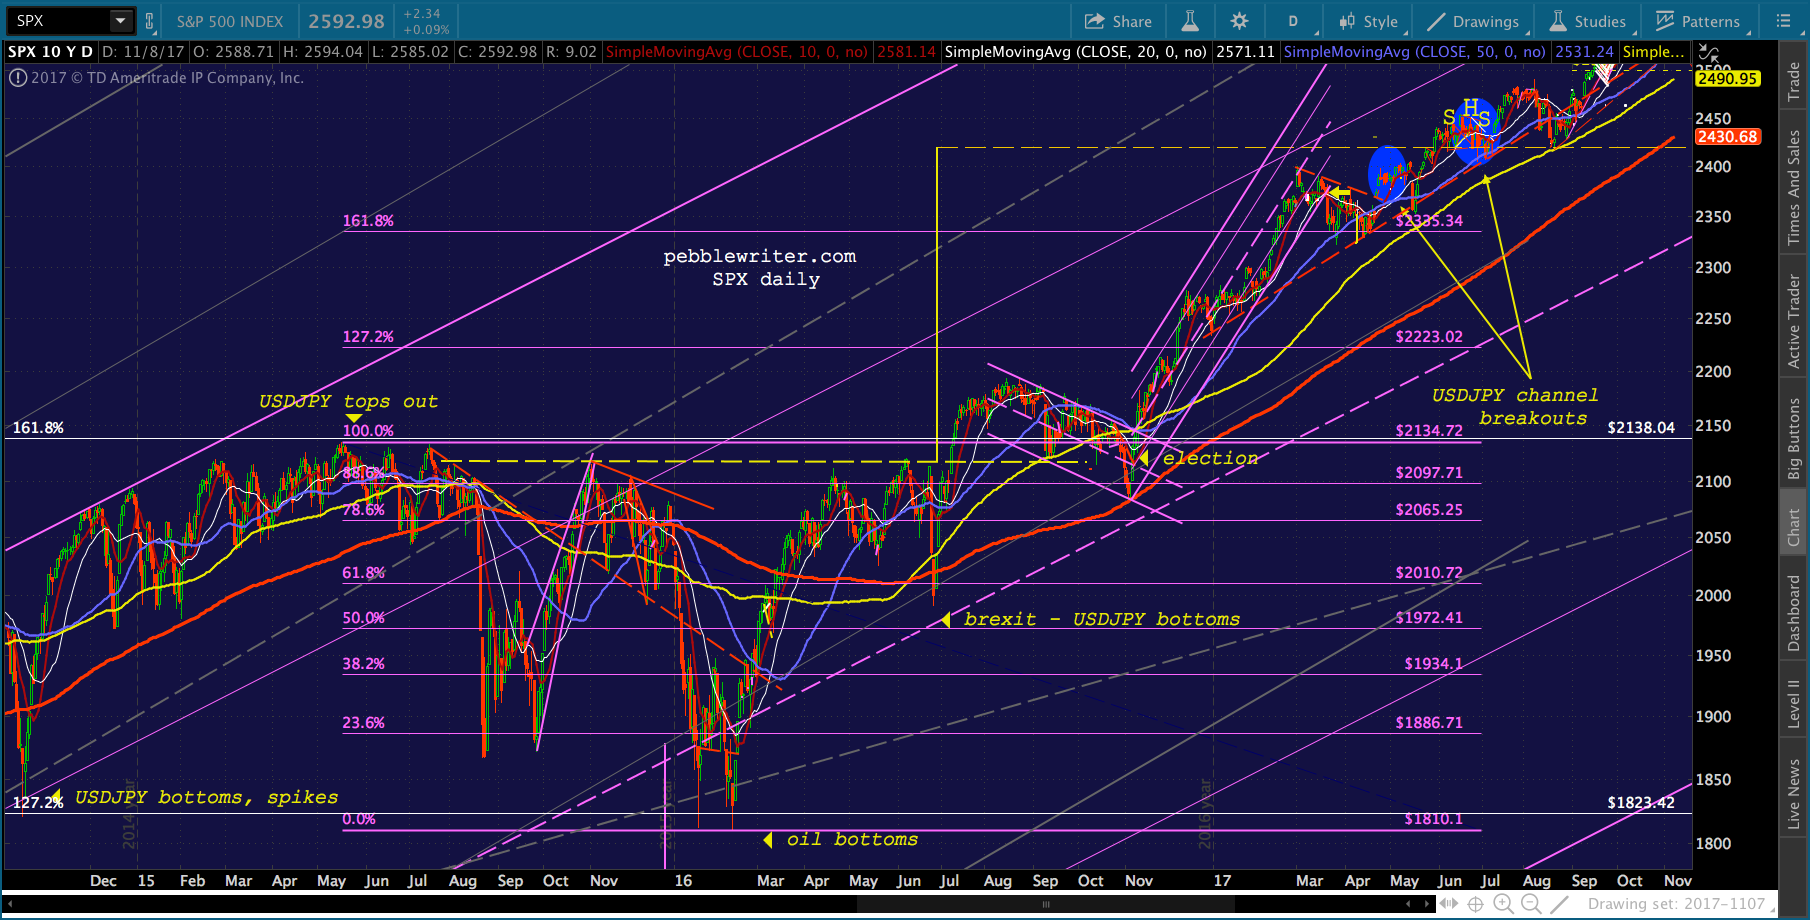 Here are the two periods in more detail.
 The last thing I’d point out with USDJPY is that there were obviously several periods during which it declined but stocks rose anyway. That’s where oil (CL) and VIX come in.
CL
Oil has been instrumental in igniting algos ever since Feb 2016 when it began doubling in order to save SPX from dipping below critical support at 1823. It was put to the test again after the November election, rallying 31% through year’s end to drive SPX back above 2138.
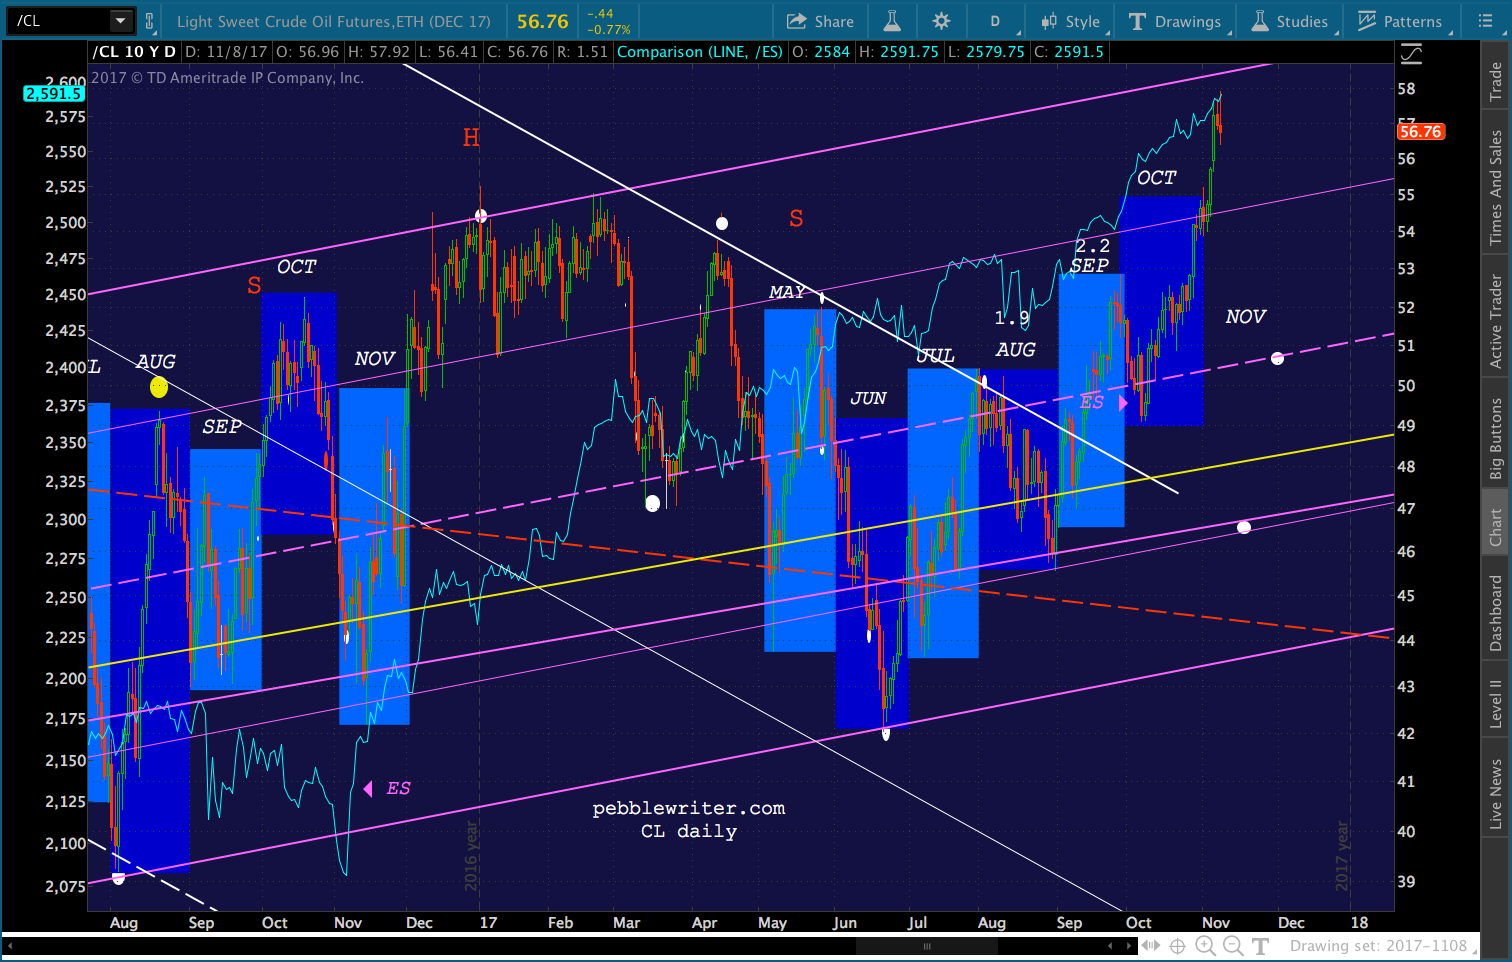 CL has obviously had its share of ups and downs. Unlike USDJPY, consumers take an immediate hit when it rallies. Central bankers cry crocodile tears that they can’t get inflation back over 2%. But, all they’d have to do is let CL appreciate back to 60+ and we’d have all the 2% + CPI we can handle.
We saw this in Feb 2017, when CPI hit 2.8% based largely on oil and gas doubling from Feb 2016. Remember: higher CPI = higher interest rates. And, no one can afford higher interest rates. Period.
So, central planners use CL in a rather clever manner: igniting rallies when USJDPY is faltering and allowing it to decline when USJDPY is spiking. This was especially apparent during April – July 2017 (the highlighted areas below.)
By contrast, when SPX needs to complete a backtest both are allowed to decline. And, when SPX has to overcome tough resistance, both rally at the same time.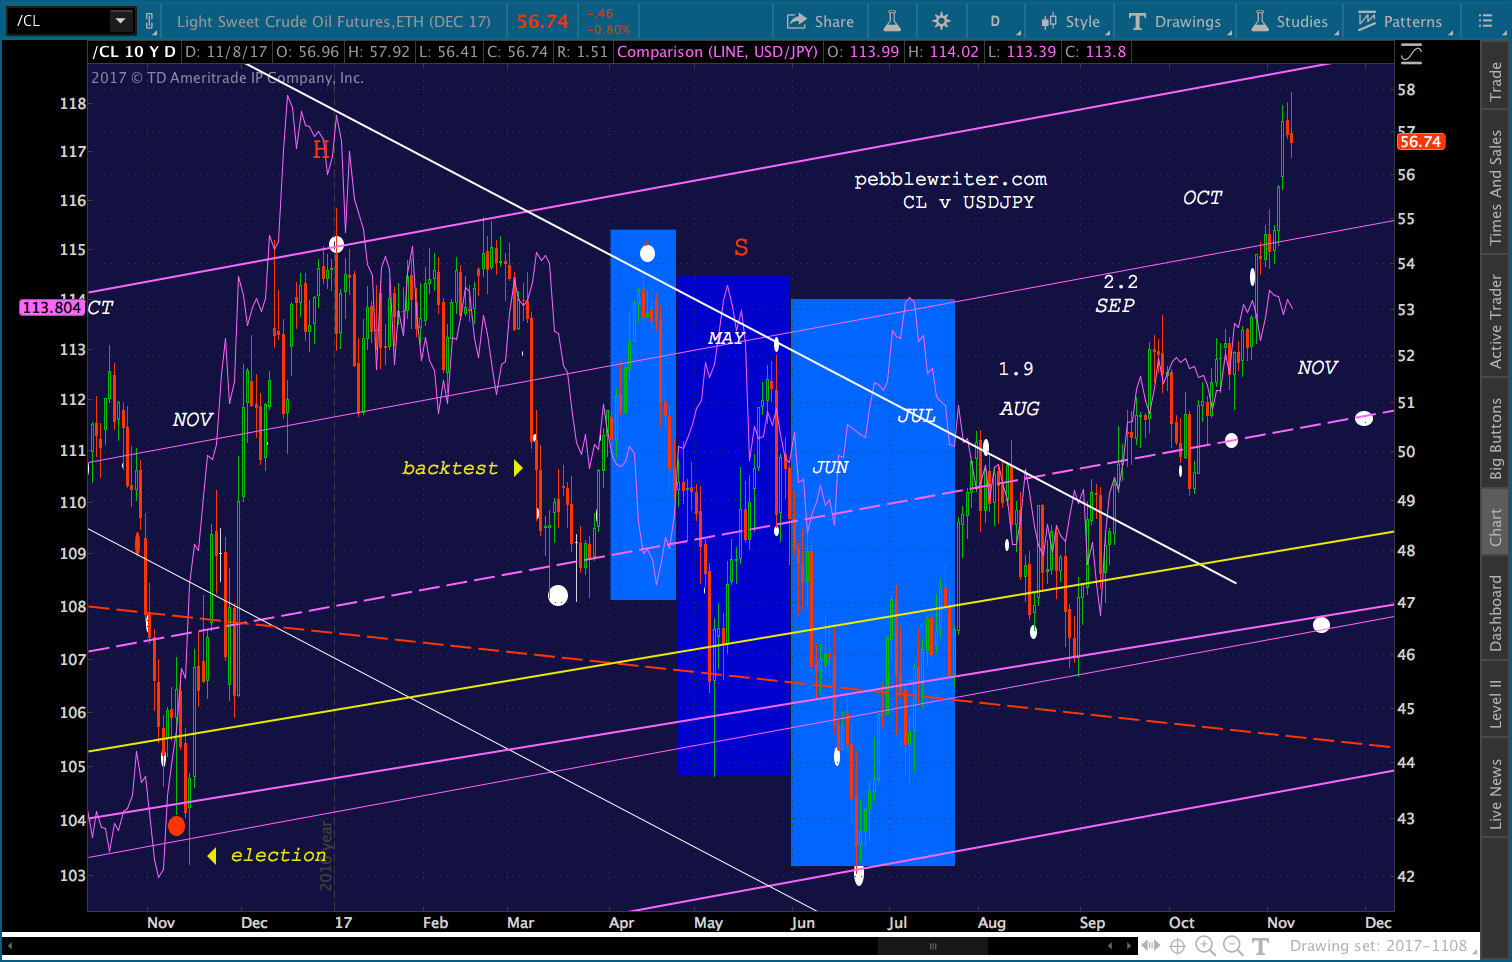 One could be forgiven for thinking USDJPY and CL would offset each other at times. That’s where VIX comes in.
VIX
For several years, VIX would occasionally tag (the yellow arrows) the bottom of a long-term channel shown below in yellow. It always happened at times of extreme complacency and, sure enough, SPX obliged by plunging after each tag.
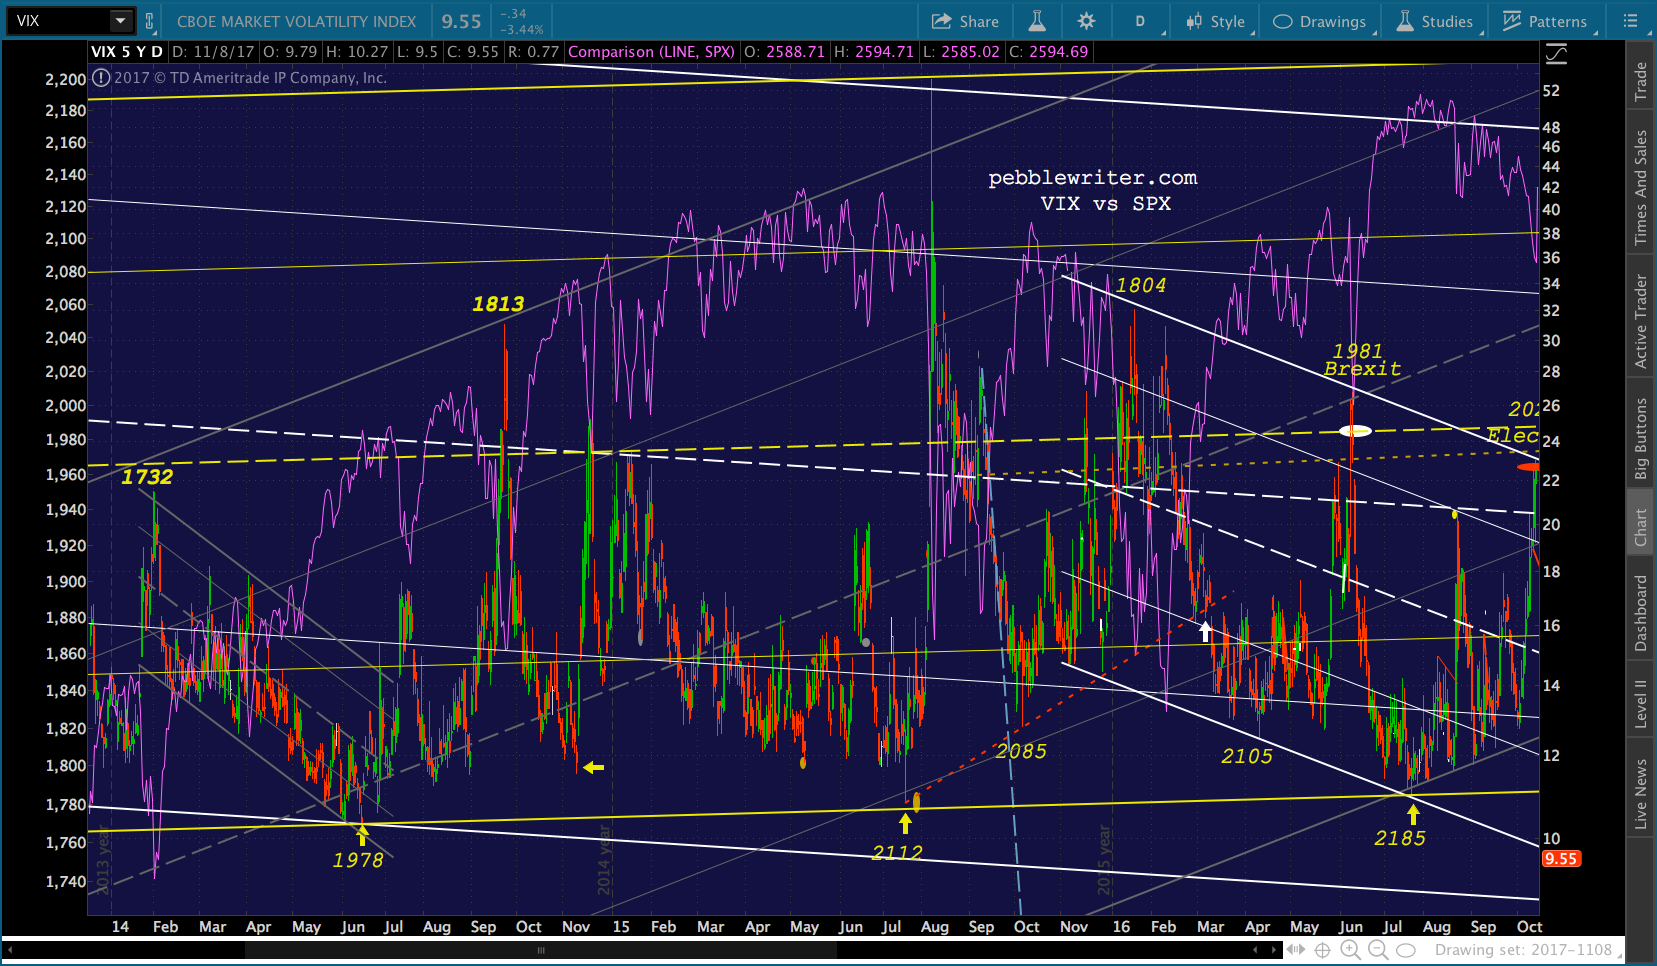 Leading up to the election, we can see a gradual rise in VIX — both higher highs and higher lows. The night of the election, when it became apparent that Trump was winning, VIX readied itself for one big spike that would break out of the falling channel.
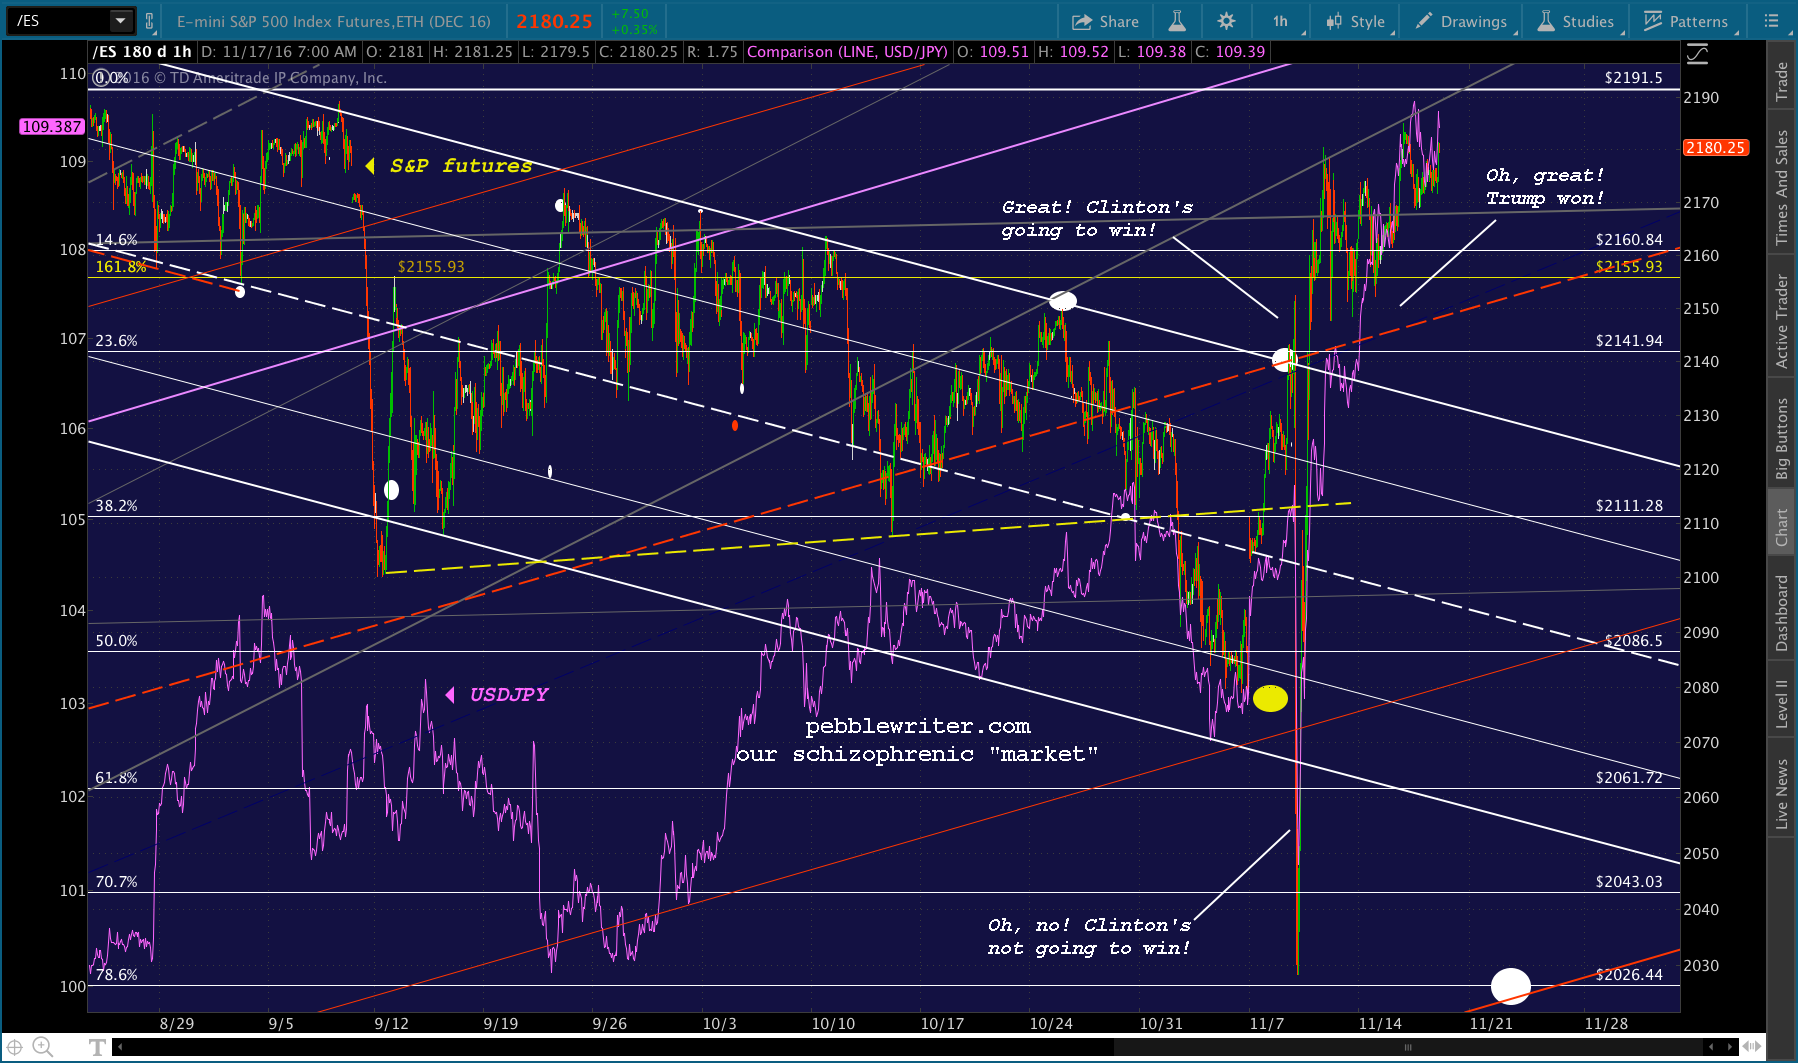
Then something very odd happened. Smack dab in the middle of ES’ 4.5% plunge, VIX started falling. I liken this to looking out the window and seeing a hurricane approaching, and then calling your insurance broker to cancel your flood insurance. No rational investor would ever do this!!!
Who would? Hmm, perhaps an entity with unlimited access to funds at no cost and in need of something other than quantitative easing to prop up equity prices…
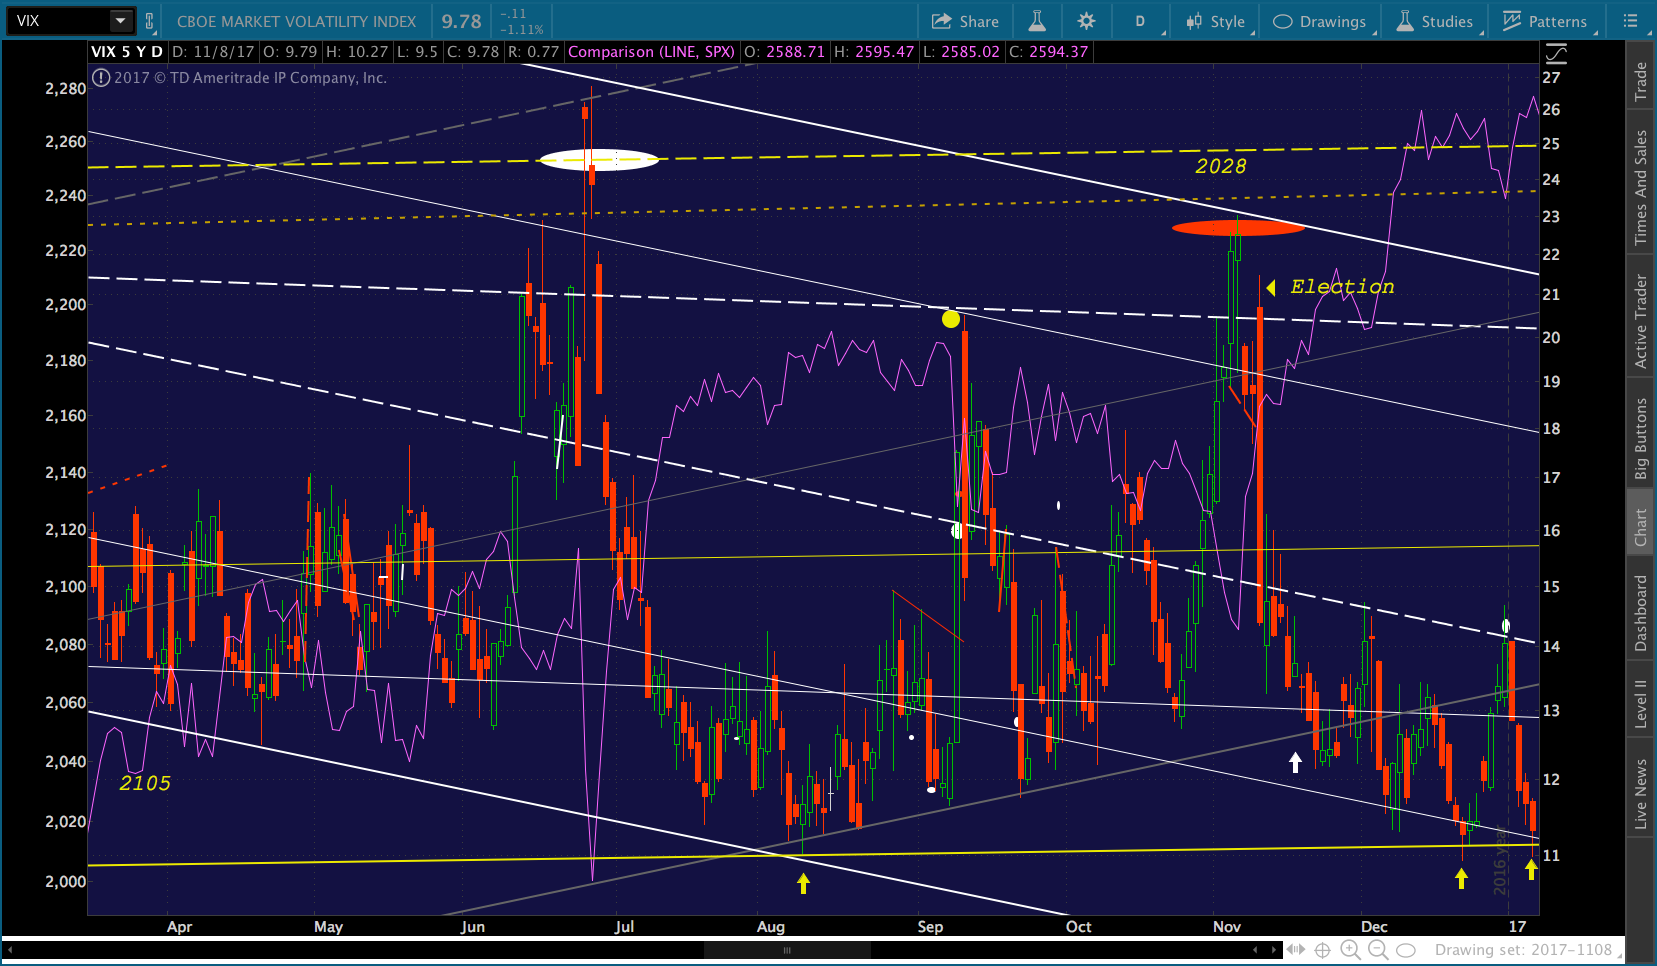 The above daily chart shows the reversal in trend. But, we can get a clearer picture of the futures action that night when we zoom in on a 60-min chart. This one, illustrating the reaction of both USDJPY and ES in Crunch Time a few days later, reminds us that it wasn’t just VIX. Remember, USDJPY and CL were also spiking at the time. So, the algos had their pick.
 Note that VIX broke down (white arrow) below trend in late November. Then, within days of USDJPY topping out and a mere four months since the last tag, it tumbled to tag the yellow channel bottom again. It worked so well that it did so again two weeks later.
What was once an annual occurrence had now happened three times in only five months. Low and declining volatility meant things were safe. This was unprecedented, but the algos ate it up.
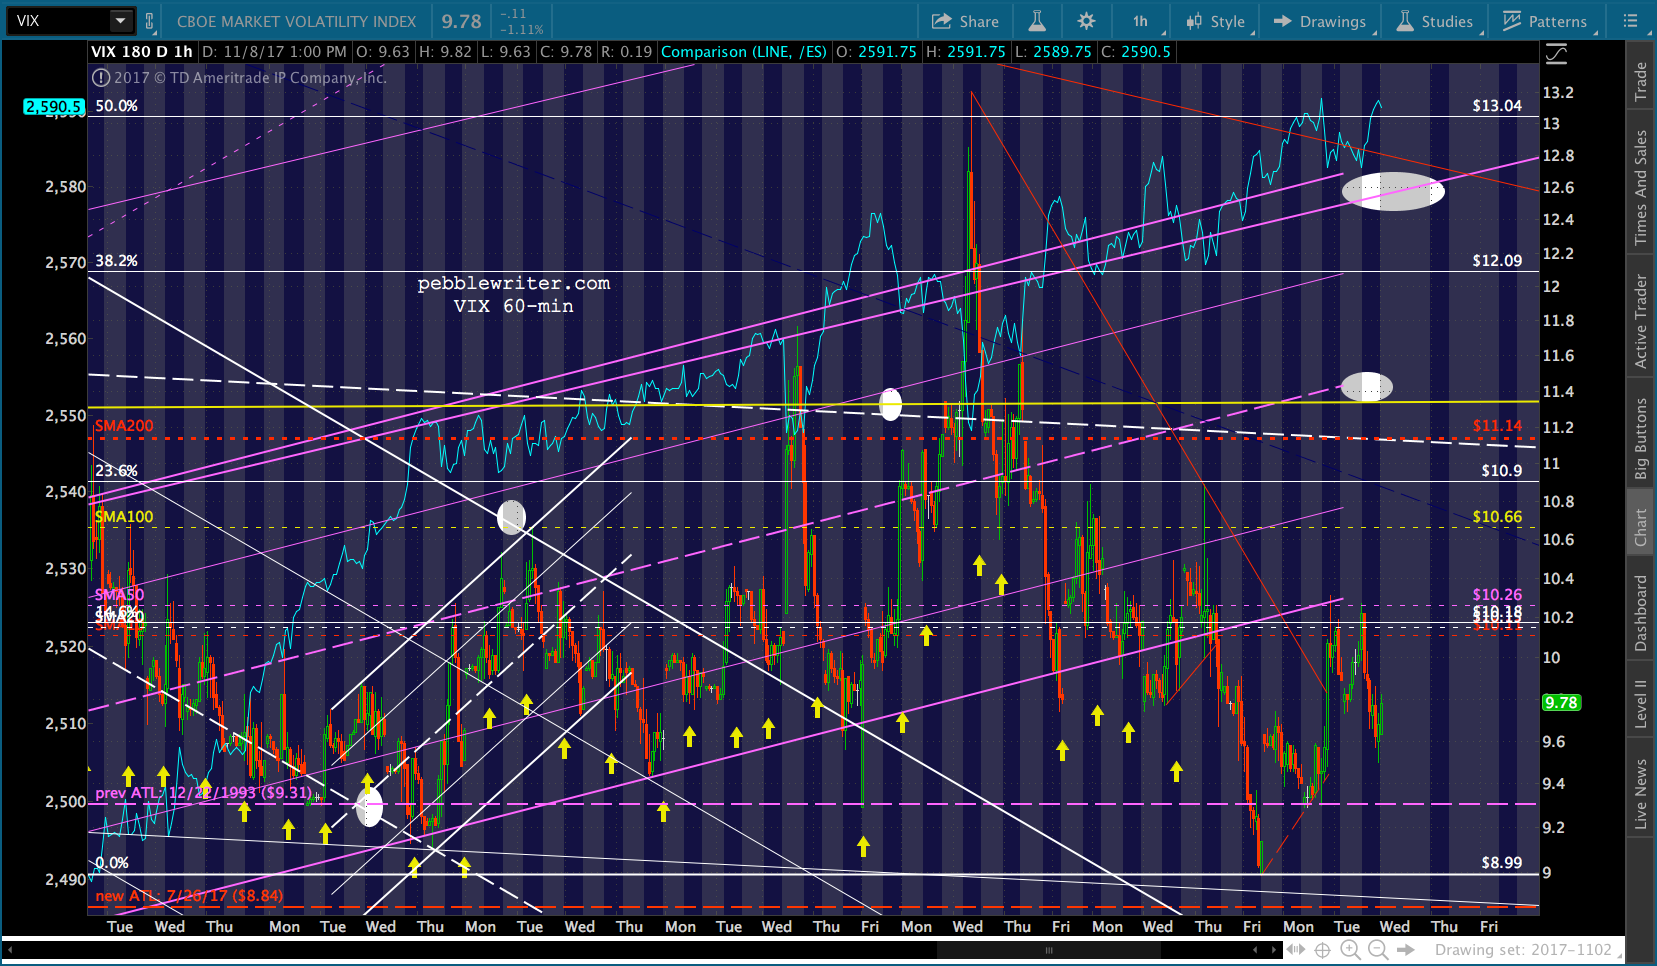
Of course, it was just getting started. VIX has since established new all-time lows and has fallen below the yellow channel bottom roughly 4 out of every 5 sessions.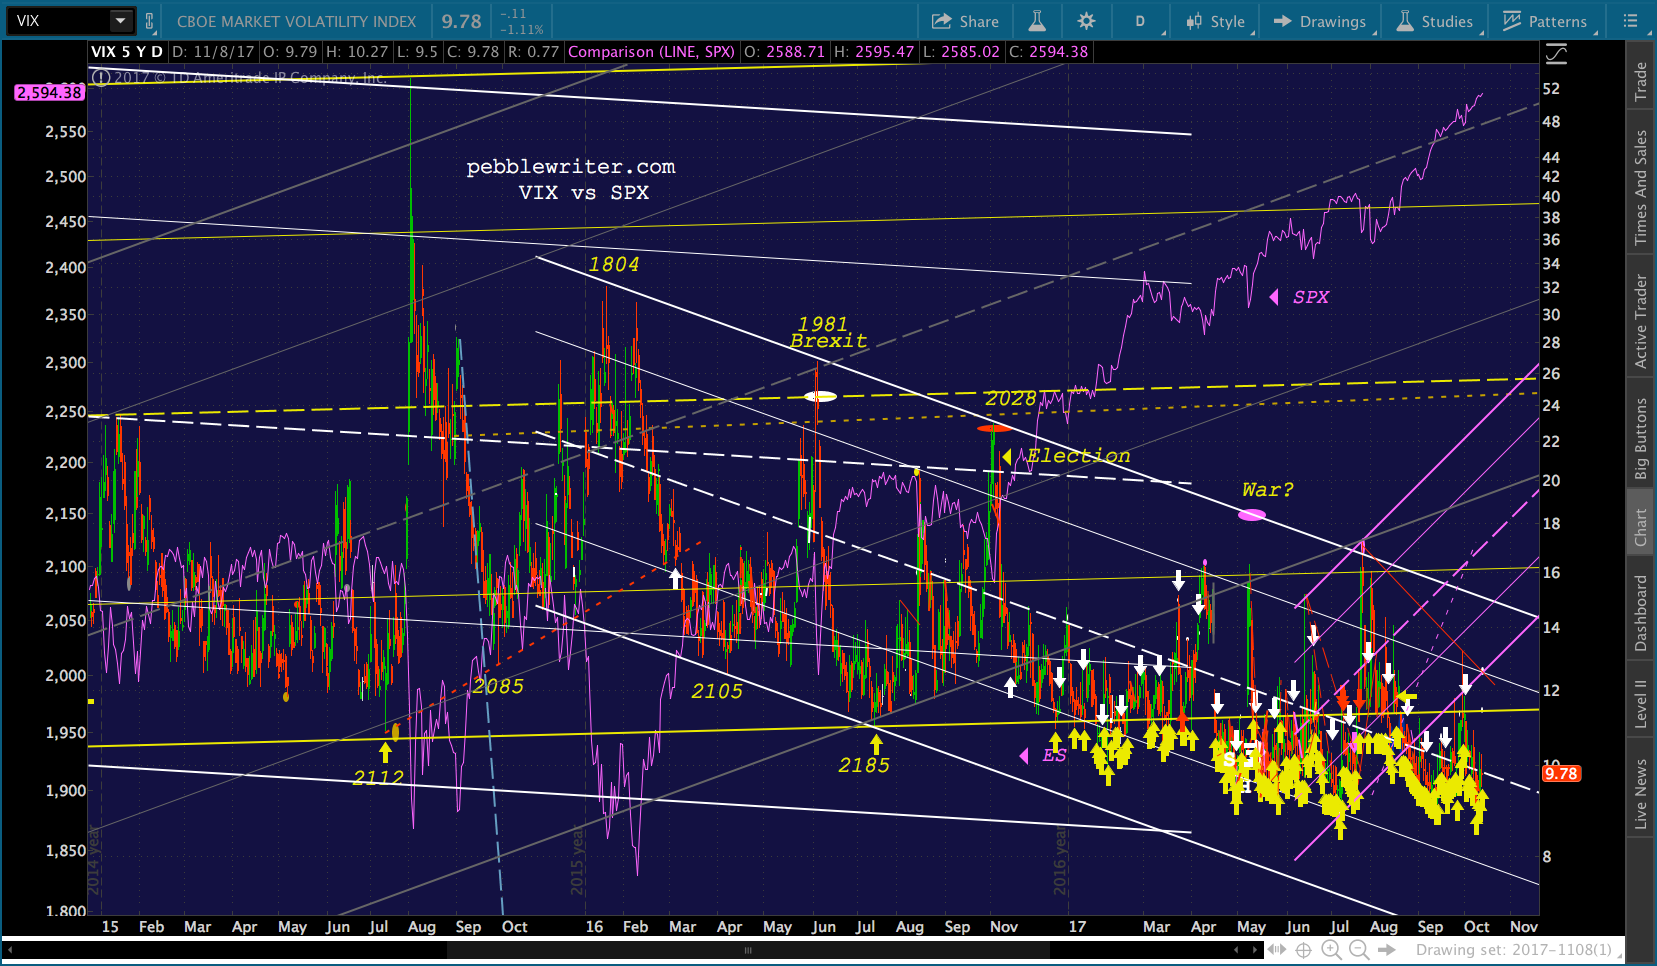 Obviously, VIX can’t go down forever; it would hit zero sooner or later. In order to remain effective, it tends to rise a little every night when low-volume futures are relatively easy to prop up…then cycle lower after the market opens the following session.
It also frequently establishes trend lines and channels whose sole reason for existence is to give VIX something to break down through. This usually happens at times when CL and/or USDJPY is unable to provide additional support.
 Conclusion
Combining all these tools (and others we haven’t even touched on), central banks have found an effective way to prop up stocks. It’s relatively cheap and easy. And, the vast majority of investors have no idea what the hell is going on. All they know is to “buy the f-ing dip.”
There are natural limits to CL’s and USDJPY’s advances, especially when they’re rallying at the same time (e.g. oil is up a whopping 76% in yen terms since Jan 2016.) But, we’ve seen how they can be alternated, with VIX smashing available to fill any gaps.
Bubbles have been reinflated, stocks are back in nosebleed territory, and there has never been a bigger cognitive dissonance — at least during my professional career. Can it last?
As long as algorithms rule and central banks have the reins, yes. With ZIRP and NIRP, debt levels can expand without repercussions. Emboldened, central bankers can push equity prices higher. The bubble can get bigger.
Yet, we know from experience that all bubbles eventually pop. Wars happen. Credit default swaps blow up. Presidents get impeached. If I were a central banker, I’d be thinking real hard about retiring to an island somewhere lest that happen on my watch. If I were Trump, I’d stop taking credit for a market that will eventually turn on him.
In the meantime, we’ll keep tracking the games central bankers play. Hopefully, by anticipating them, we can continue to earn outsized returns. If we’re real lucky, we might even be able to grab a chair before the next time the music stops.
GLTA.