At the time of our last update [see: Sep 7, 2017 Update], oil had reached our 49.75 upside target, selected because it marked: (a) a trend line dating back to June 2014, (b) the midline of a large, rising channel, and (c) CL’s 200-day moving average.  I called for a reversal, and apparently wasn’t alone in my thinking. CL plunged over 4% the following day — a nice start to the 13% drop I expected.
Needless to say, this was a problem for stocks, which had just flubbed an assault on the psychologically important 2500 (SPX) and faced resistance of its own. As has happened countless times before, oil futures bottomed out and spiked higher right as the market opened. SPX gapped open with an 18-pt gain and, thanks largely to CL’s recovery, never looked back.
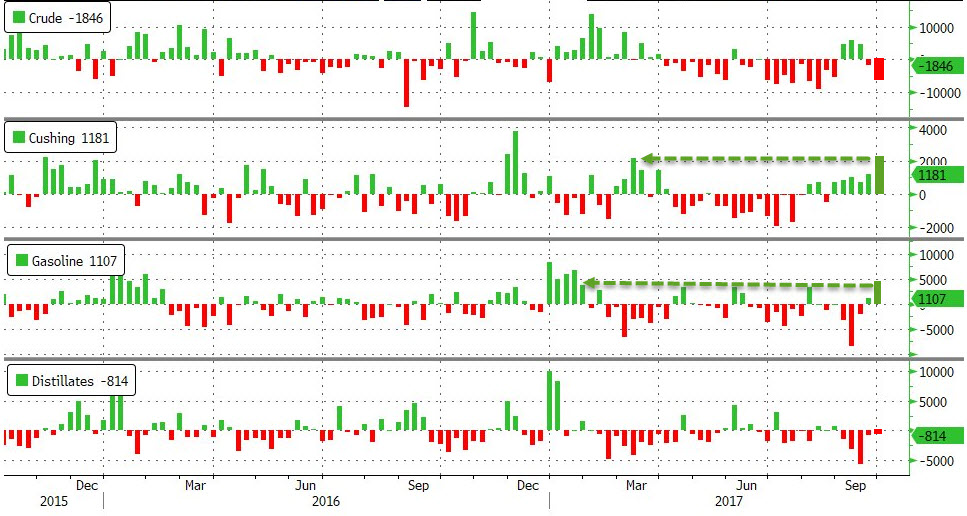
 The only problem with this scenario was inflation. Gas futures (RB) had closed August on a high note, the top of a channel dating back to Aug 2015. I had called for a reversal at 1.78, reasoning that inflation would spike higher unless RB fell sharply.
With stocks counting on CL’s continued ascent, and the Fed counting on RB tumbling, was there a scenario that could satisfy TPTB’s needs? There was, but it involved some last-minute theatrics and required the EIA to falsify its gas price data for the month.
continued for members…
Here’s the nationwide average price of regular gas as reported by GasBuddy. AAA’s data is identical. I don’t have the day-to-day data yet, but I look at this chart every day. Even an eyeball test shows the average price would be somewhere in the middle of the range of 2.57 – 2.67. We’ll call it 2.62. 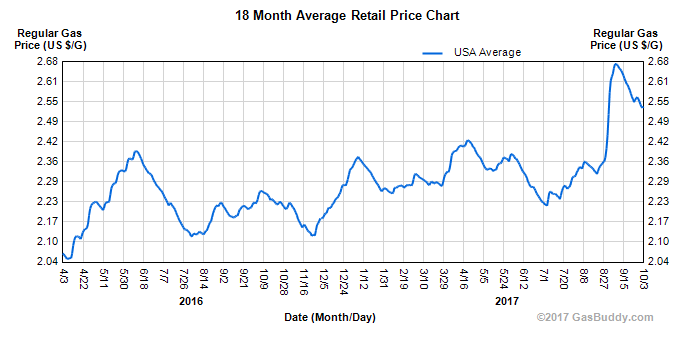 And, here’s the EIA’s data that will be fed into models for reporting, among other things, September’s CPI. The only day that average prices reached 2.57 during September was Friday, the 30th. Yet, that is the price that was chosen to represent the average during September.
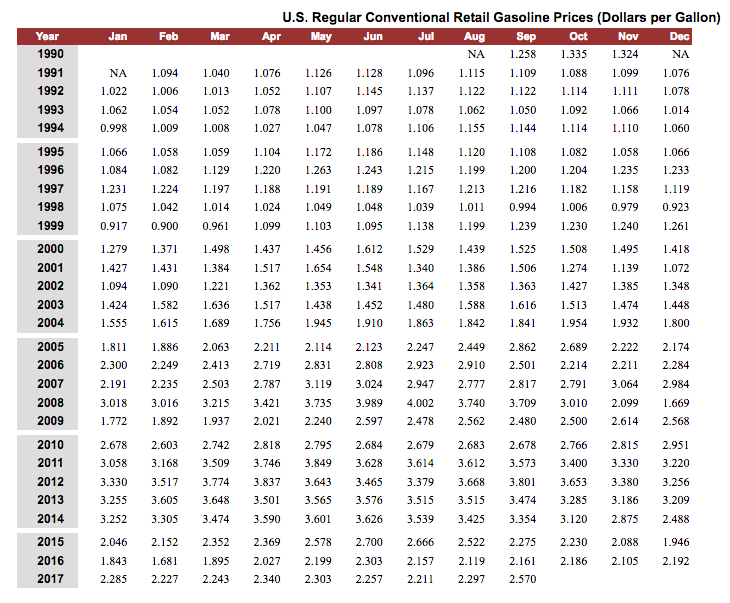 It doesn’t make a huge difference: an 18.9% increase from Sep 2016 versus the 21.2% which would have resulted from a 2.62 average price. But, obviously it made enough of a difference that they felt the need to falsify the data.
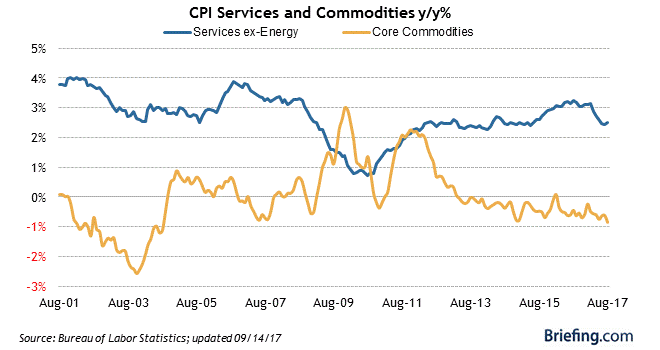
Whether it knocks down the reported CPI from 2.4 to 2.3% or 2.1% to 2.0%, we’ll have to wait and see when CPI is reported on Oct 13. Last month, CPI came in at 0.4% increase MoM and 1.9% YoY, which included a 6.3% increase in overall motor fuel cost. EIA had reported an 8.4% increase in gasoline prices.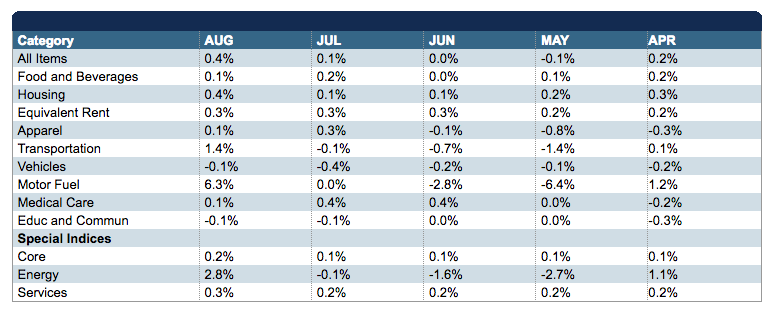 From the chart below, it seems pretty obvious they have a problem with core commodity prices, which are threatening to break below horizontal support near -1%.
 With a 19.4% YoY increase, September will be slightly higher than the data from March 2017, when EIA reported a 18% increase in gas prices and CPI came in at 2.4%. So, I’m calling for 2.2-2.4% YoY increase in CPI for Sep 2017.
As we discussed the other day, the late September drop and the abrupt stop at 1.54 might mean they’ve done their calculations and this is where they need it to be in order to achieve their target (high enough inflation so the dollar isn’t whacked, but low enough that it doesn’t cause a gold rally and higher interest rates.) I don’t know where this number is, but I’m guessing 2.2% would work. They can always pass it off as being caused by the hurricanes.
The other factor, of course, is that SPX and ES are up over 2500, but not by all that much. A drop by CL through support might create too much of a headwind for stocks.
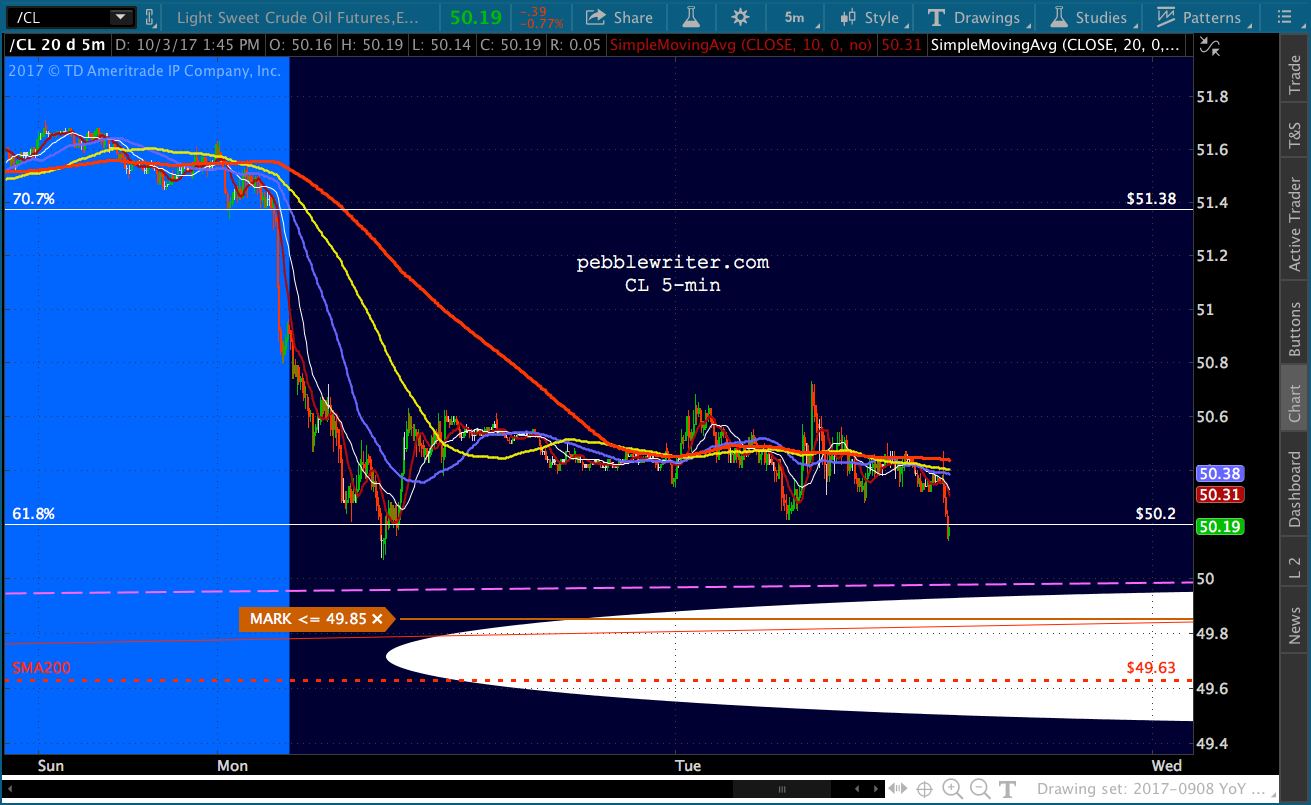
Just eyeballing it, it seems that RB around 1.45 for October would result in fairly flat YoY CPI. For CL, I’d say it’s set up to deliver pretty flat YoY prices at current prices. Throw in the fact that CL is sitting just above its SMA200 (50.07 vs 49.63) and I’d say there’s pretty decent support at these levels.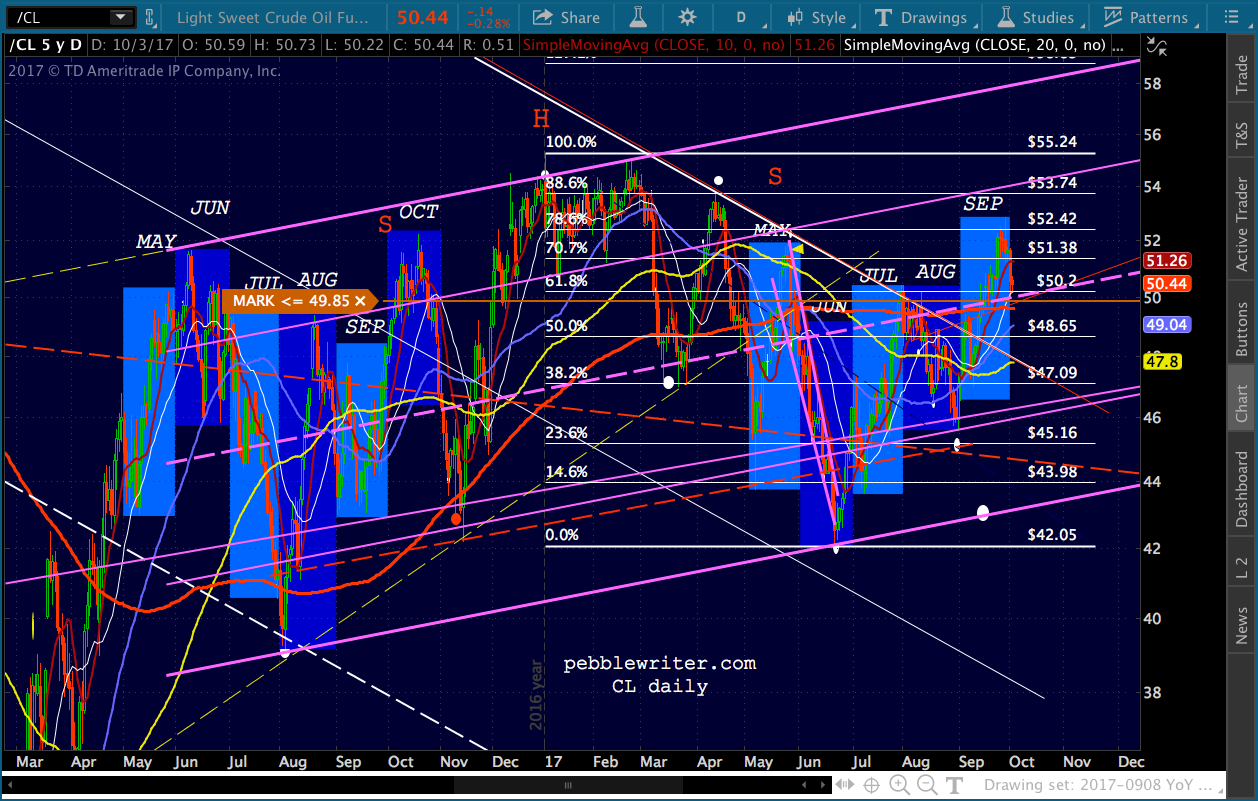 While the SMA200, Fib pattern and rising purple channel midline suggest a bump here, I don’t think the Fed wants to be stuck in a situation where they have to raise rates. I think they want to raise them, but not be forced to.
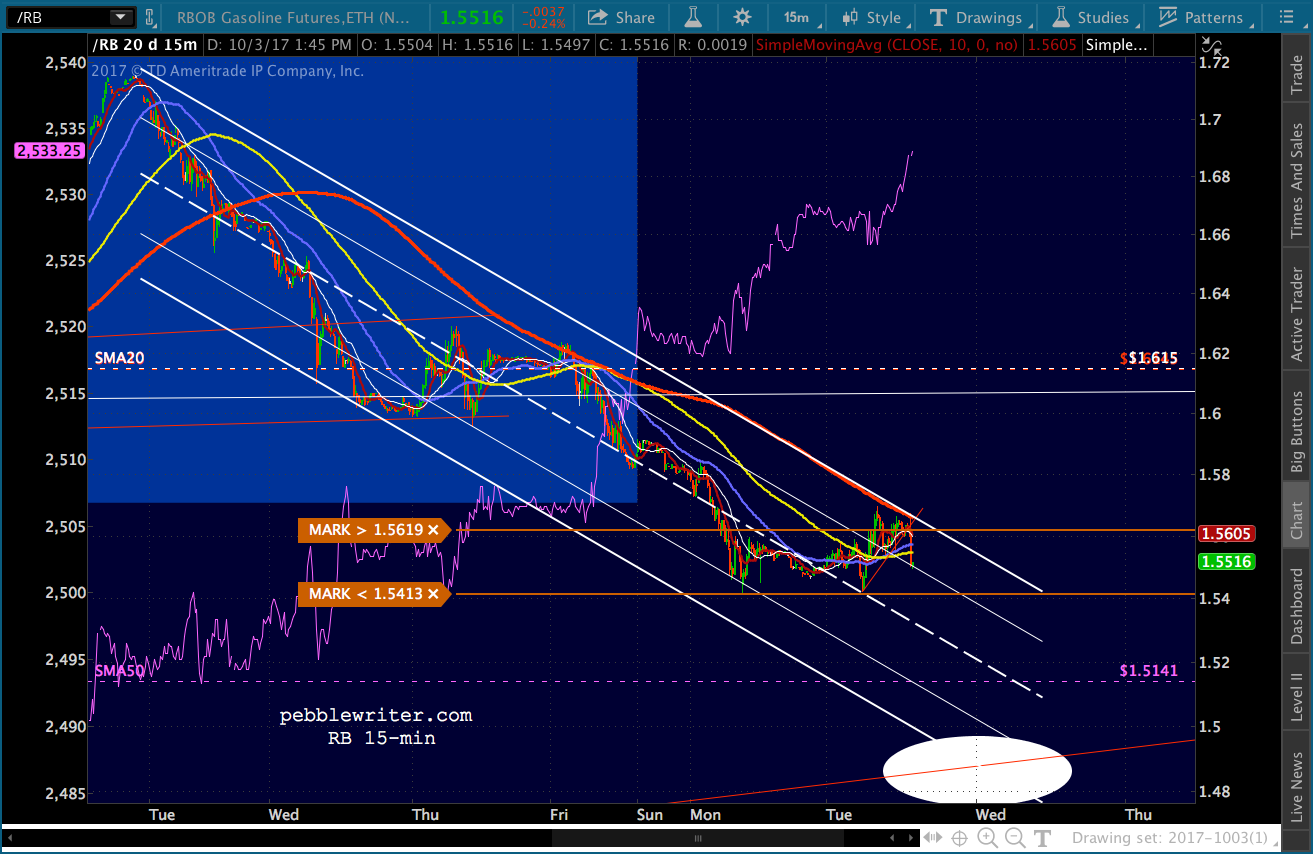
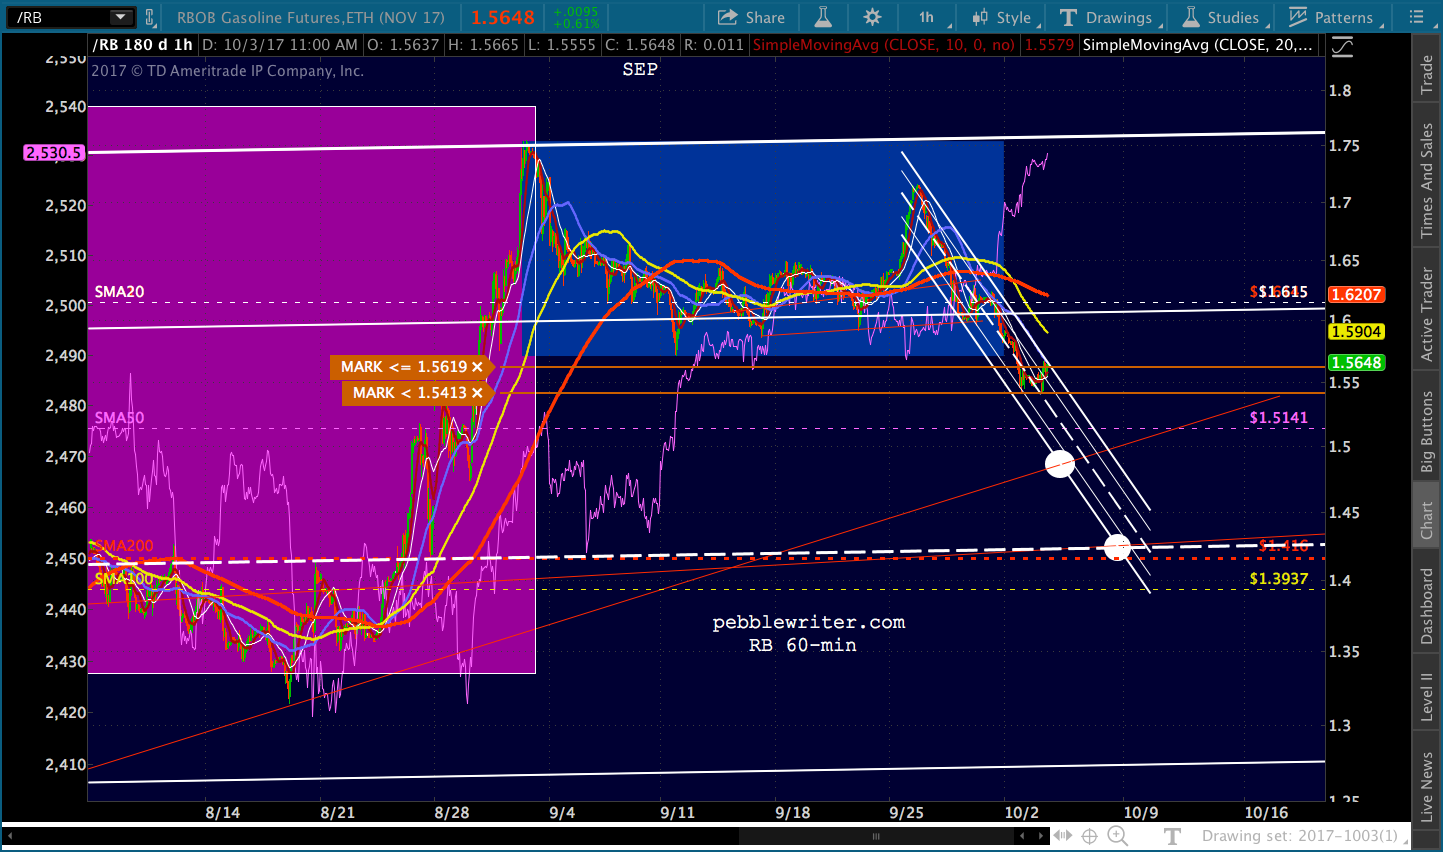
Therefore, I’d continue holding CL short for the SMA200 tag, but would only be truly comfortable being short if CL dropped through the SMA200 to backtest the broken triangle/TL at around 48 — which isn’t much of a reward.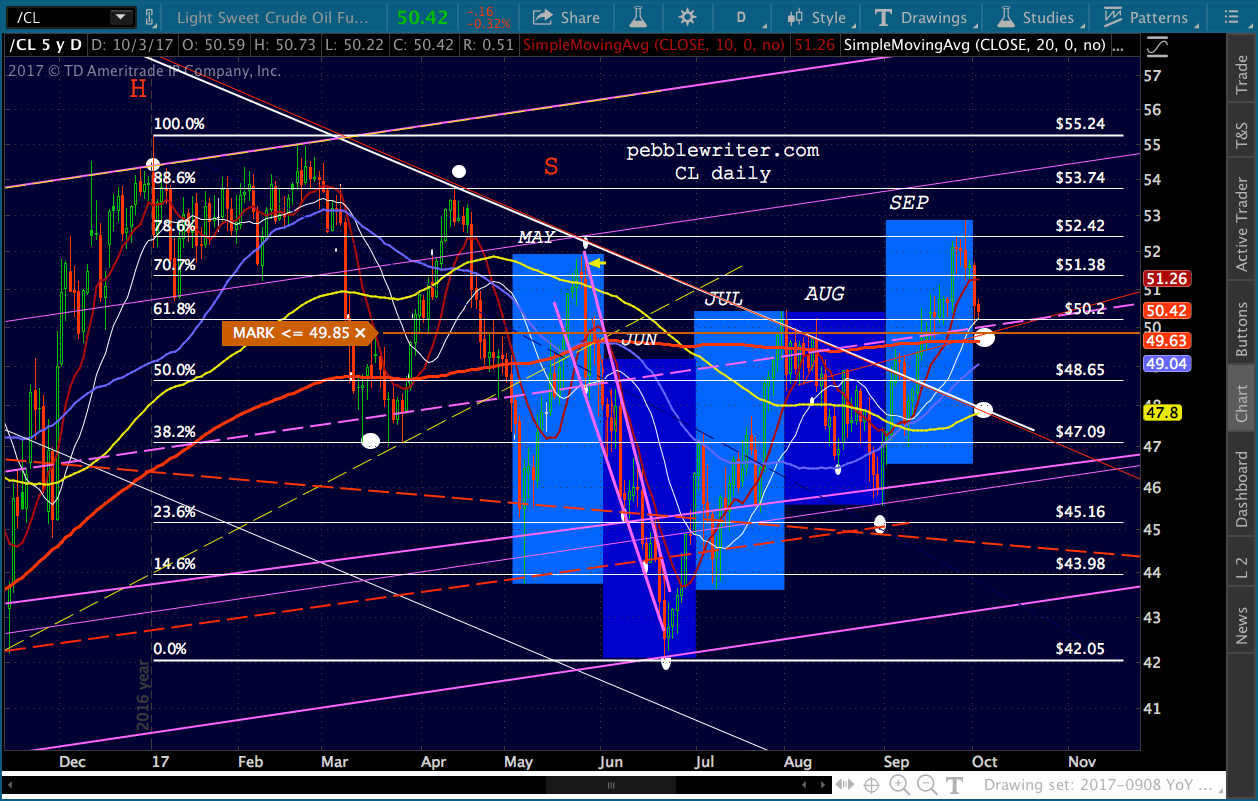 Re RB, I pointed out yesterday that it completed a measured move at 1.5468. It reached 1.5423 this morning, slightly lower, but then bounced nicely. I like the idea of a bounce here, but would want to re-short on any sustained drop through 1.54 for targets of 1.4826, followed by 1.416. If it is going lower, I’d look for the bounce to peter out around 1.5696.
Anything higher than that is going to start looking like a breakout — which I really don’t think is in the cards. Maybe a fake out or two, but I’m not looking for an actual breakout. If it does, though, we’ll know why and will play right along.
 For nimble traders, I’d want to be short on any drop through the red TL and long on any breakout past the white channel top.
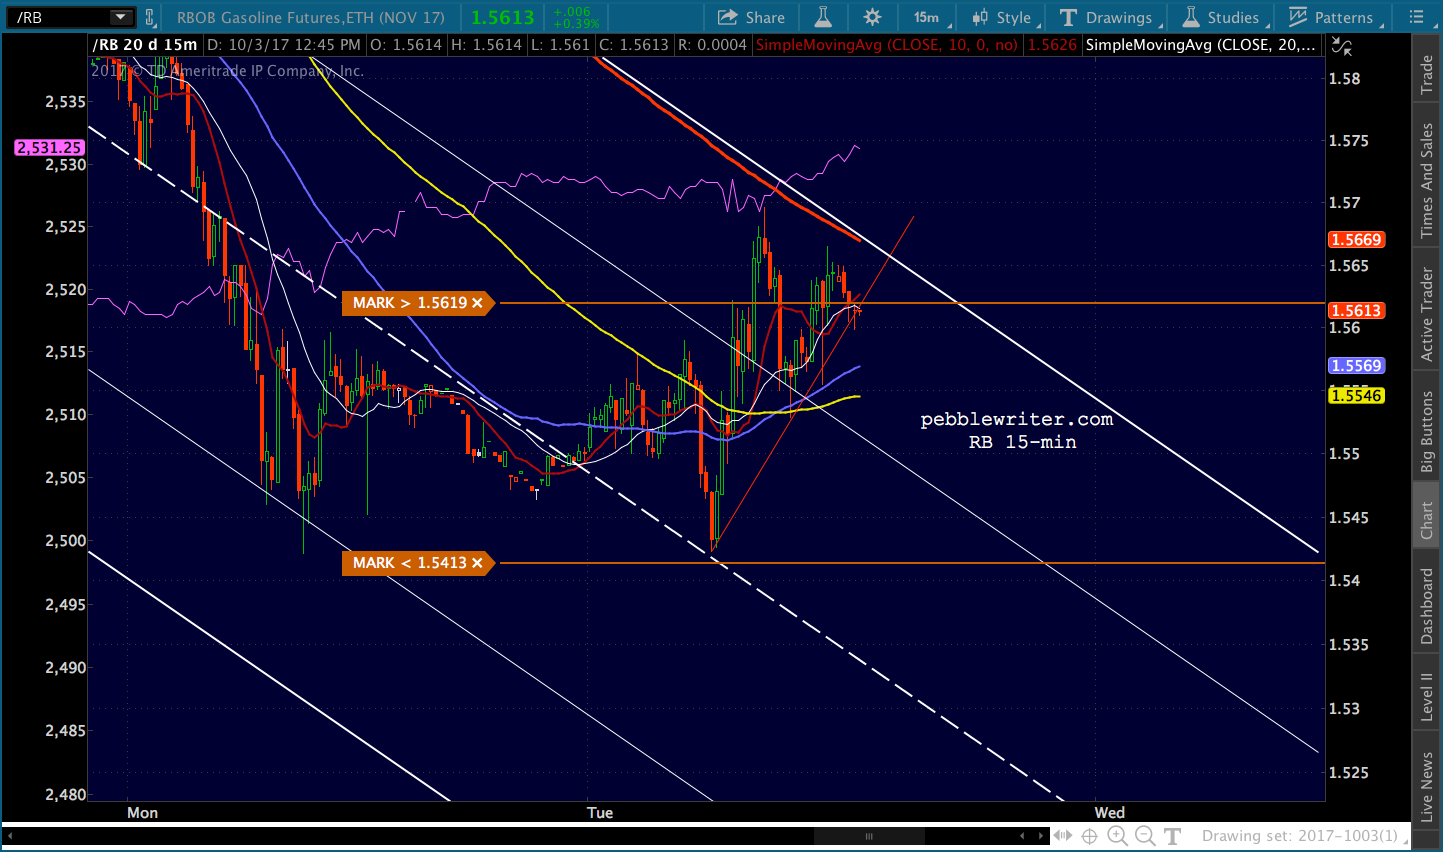
ES and SPX are very close to our next upside targets, meaning we might be ready for a small sell-off. This would give CL an opportunity to backtest the SMA200 and go sideways through the end of the year. RB could dip on down to 1.41 and bounce back into the 1.61 range as needed to influence CPI and stocks.
GLTA.
UPDATE: 4:50 PM
Per API…nice build in gasoline (+4.19MM v 1MM exp.) and Cushing (+2.048MM v 1.8MM exp.) Remember, the EIA will release their data at 10:30 ET tomorrow.