Posts

  • Update on Gold: May 1, 2018

    Gold has fallen 4.7% since our last top call [see: Apr 11 Update on Gold], coming close enough (as far as I’m concerned) to our 1300 target to take profits.

    I’d pull the plug or at least enter stops here at 1367…The most obvious support is at the rising white channel bottom and SMA100, currently around 1315.2-1318. If the channel breaks down again, the SMA200 will reach the purple channel line later this month, probably around 1300.

    Although this is getting monotonous, I’ll settle for a fairly predictable 4-5% move every few weeks. This brings our total for the year up to about 19.4%, not shabby considering that GC is essentially flat on the year.

     *  *  *

    Feb 8: Analog Details  “[Gold] has dropped 4.1% since reversing where expected in late Jan, and just reached fanline and double channel support [1321.] Could it finally be ready to tag 1377-1380?”  Bottomed that day, rallied to 1364 over the following week (+2.51%.)

    Feb 15: Where to, Next?  “GC might have run out of steam here [1360.] Cautious types might want to take profits, while the daredevils out there remain focused on 1380.” Topped out the following day at 1364 (+2.95%.)

    Feb 27: Powell’s French Toast   “Gold is getting clobbered…our analog suggests a Mar 1 turning point. The SMA100 should be around 1303 by then and would be a better bounce spot.”  Bottomed on Mar 1 at 1303.60 (+4.15%.)

    Mar 27: Algos to Markets – All Better  “GC, which tagged its 1362 resistance yet again, has retreated once more.  It still has a good shot at 1380, but only if/when DXY finally breaks down.” Reached 1369.40 today (+5.05%.)

     *  *  *

    When something’s range bound like GC has been, it raises the obvious question: when will it break out/down, and what will it take?

    continued for members(more…)

  • The Coast is Clear – For a Drop

    Almost three months ago, we saw most major indices and quite a few stocks backtest their 200-day moving averages.  One notable exception was the NASDAQ Composite.

    COMP came with 1.1%.  But, it ran out of time when, as expected, SPX, DJIA, RUT, etc. all bounced off their SMA200s.  It had another chance on Apr 2, but that opportunity was scuttled by Jim Bullard and Larry Kudlow’s dovish comments.  This time, it missed by 0.8%.

    Our thesis all along has been: (a) the broader indices wouldn’t advance until COMP had a chance to tag its SMA200; and (b) said dip would wait until the SMA200 reached recent lows.  The SM200 is now up to 6836.19, about 3.25% below yesterday’s close.

    With April out of the way, it seems the coast is finally clear for a backtest.  The only complication is that a 3.25% drop would put SPX way down at 2562 — a good 50 points below its SMA200.  So, either things are about to get pretty crazy in the broader indices or we’ll have to wait a little longer for a milder dip.

    There is a third alternative. With AAPL due to report after the bell, we could get a divergence between the two that allows a backtest that doesn’t clobber SPX quite so badly.  That would take some pretty fancy footwork.  But, there’s a logic to it, given that several of COMP’s leaders are trading below their SMA200s.

    Of course, the other event the market is worrying about is the outcome of the FOMC’s meeting.  They say Jay Powell is in the hawkish camp these days.  I guess we’ll find out.I’m sticking with our bearish outlook for now.

    continued for members(more…)

  • PCE Signals Stagflation

    Core PCE came in hot this morning, tagging 2% (1.9% core.)  Expenditures rose 0.4% MoM, beating income.Needless to say, this falls short of the reality experienced by most Americans, who have seen a 15-20% YoY increase in gasoline prices with the seasonal summer bump still ahead.

    Will the 10Y take its cues from problematic inflation and the Fed’s tightening schedule, or from  the fact that market leadership seems to be rolling over?continued for members

    (more…)

  • Bonds: A Buying Opportunity

    In our last update, [see: Update on Bonds – Jan 28, 2018] we noted that 10Y price (121’265) was closing in on the bottom of a shallow, falling channel as yields were approaching what most pundits seemed to consider a line in the sand.  We saw things differently.

    The closest [line in the sand] would correspond with the bottom of the shallow falling white channel – currently around 121’015 on ZN.  In a perfect world, this might correspond with the rising red channel midline for TNX — about where the .382 Fib is at 28.56.But, ZN’s white channel is likely to break down, meaning support is way down at the rising yellow channel bottom.  If it waits until October, it would intersect with the .500 Fib at 119’180.

    If it happens sooner, ideally late April, it would drop through the .500 Fib and intersect with a falling wedge at around 118’300 – thus enabling TNX to reach 30.


    As it turned out, TNX overshot 28.56 and slightly exceeded 30, reaching 30.35 on Wednesday as ZN reached 118’310.

    Amid the cries of alarm, I remain convinced that rates will moderate from here and that prices have most likely bottomed.  I never thought I would say it, but the 10Y is probably a smart buy at 3% — at least in the near-term.As is so often the case, there are some important caveats.

    continued for members

    First, remember there are two potential channels to consider.  The yellow one is a lousy fit in many ways.  But, the white one isn’t much better.  Sure, its midline fits better, but the top doesn’t, and neither does the bottom (with Fibs, at least.)As we discussed earlier this morning, DXY has reached the top of its large falling channel, EURUSD has bottomed on a rising channel, TNX has reversed off a slight overshoot and GC has bottomed on a rising channel.  If we get the bounce I expect, I’d look for ZN to test the white channel bottom at 120’280, followed by the falling wedge top around 124’050.  I would also keep an eye on it around the .500 Fib at 119’180 and the .382 at 123’100.

    If it drops through 118’300, then it’s likely headed for the white channel – currently around 117’100ish.Rarely do all the stars align like this.  So, it raises my confidence level quite a bit.  It also suggests a substantial sell-off in equities over the next couple of weeks.

    Beware that very long-term weekly channels like the yellow one are subject to slightly placement errors.  So, we could be early.  Also, be aware that a drop through the yellow channel bottom to the white bottom or lower would be bullish for equities, and not so great for long bond positions.  As always, use stops judiciously.

    And, the biggest risk of all: the Fed loses control and rates break out.  I usually chart in log scale, but the arithmatic chart for TNX illustrates just how critical current levels on the 10Y are.

    Stay tuned.


    (more…)

  • That Nagging Feeling

    Sometimes, markets can’t seem to get out of their own way.  They manage to make modest new highs, but on poor breadth or without breaking through resistance.  Like many investors, this sets my spidey senses to tingling.

    Most of the time, the markets grind higher anyway.  But, once in a while, the warning signs were right on the money.  That’s where we are today.

    Thanks to FB’s meaningless stock buyback plan expansion announced Wednesday, the stock popped back above its H&S neckline and even its SMA200 (by 22 cents, go figure.) SPX was obliged to surpass its own IH&S neckline — bullish, by any measure.  But, it stopped just short of its SMA10.

    AMZN, which dutifully bounced at our most docile downside target on Wednesday, had a clear path lower.  But, after hours, it announced bang-up earnings — which sent the stock to new all-time highs overnight.  Bullish, right?

    So, how come S&P futures are flat as can be, and failed to push through their SMA10?  At this rate, FB won’t even break out of its falling channel.

    Occam’s Razor says that when presented with two explanations for something puzzling, the simpler one is usually right.  Translated to investing, since 2009 at least: when presented with faltering markets, buy the effin’ dip.

    But, Occam died in 1347, a couple of years before algorithmic trading took over the financial markets.  Pebble’s Precept says that markets sometimes move in a way that will screw over the most people (admittedly, it’s somewhat cynical…)

    What gives?  Is there a reason to be nervous?

    continued for members(more…)

  • More Than One Way to Skin a Cat

    SPX and ES came within 2 points of their SMA200s on the opening yesterday.  They were on their way for another try (the yellow arrow) at 10:30 when EIA’s crude inventory report was released.

    It was a surprise build, meaning there was more oil sloshing around than folks expected.  According to fundamental analysts who pay attention to things like supply and demand, this should have sent prices tumbling.The tumble lasted all of 15 minutes, at which point WTI popped back above its SMA10, where it struggled to remain the rest of the day.

    Stocks aborted the SMA200 run, and spent the remainder of the day in recovery mode.  In the low-volume after-hours, ES managed to claw its way back to the H&S neckline it fell beneath on Tuesday — a backtest.Backtests are funny things.  In a fair and orderly market, they are normally the kiss of death — the last ditch, but failed effort of a stock to regain solid footing.  Traders know this, and so do corporate executives tasked with maximizing shareholder value (and incentive comp.)

    Take Facebook, for instance.  This former investor darling has been under the gun, lately.  It plunged below its SMA200 in March, completing a H&S Pattern that targeted 140.  But, it announced better than expected earnings yesterday.

    Unfortunately, this didn’t move the needle.  The stock bounced around UNCH to +1% for the first 30 seconds or so.  Moments after CNBC’s Julia Boorstin uttered the words “an additional share repurchase program of $9 billion,” however, the stock was off to the races.  See if you can spot the turnaround.  Naturally, the overnight ramp (already making some purchases?) carried the stock up past its own neckline.  Crisis averted…situation normal…nothing to see here…please move along.

    Surely it’s a coincidence that the company’s last buyback program was announced in November 2016 — in the wake of a drop through its SMA200.Whether or not you own FB shares, this is important stuff.  As we pointed out on Mar 19 [see: Facebook Flops] every time FB drops through its SMA200 (the solid red line), the S&P 500 takes a nosedive.  When it recovers, SPX recovers.  Easy peasy.As the 60-min chart above shows, FB is about to test its SMA200 at 173.84.  How’s that for holding the fate of the financial markets in your hands?

    This raises all sorts of interesting questions.  If the announcement of a meaningless buyback plan (they had only utilized $2 billion of their $6 billion plan from 2016!) can signal not only an individual stock but $30 trillion in stocks to rally, what does this say about market integrity?

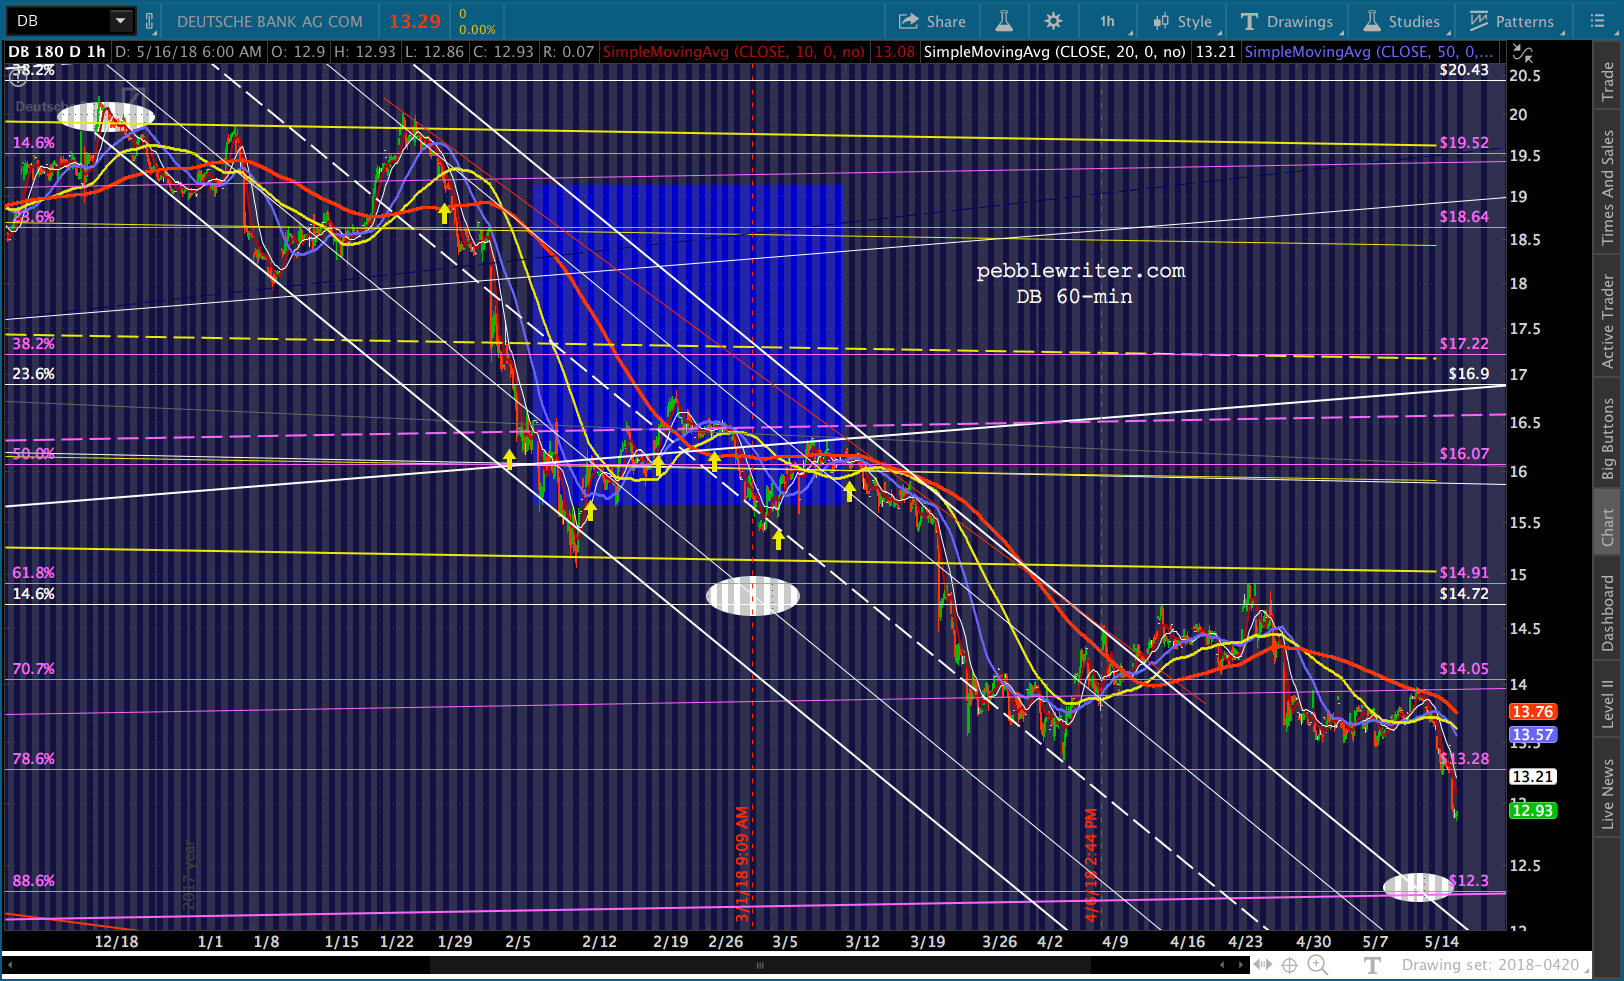
    It says pretty much the same thing as a foundationless rally in oil, spike in USDJPY, or collapse in VIX — all of which send stocks higher on a regular basis, thank you very much. But, that’s a whole ‘nother rant.Let’s get back to buybacks and another example that’s near and dear to our hearts: Deutsche Bank.  We started following the stock in Sep 2016 at the request of a hedge fund client [see: Deutsche Bank: Will it Survive?]

    We nailed the bottom, the end of the subsequent 87% bounce, and a few interim swings along the way.  Most recently, on Feb 7 [see: What is Deutsche Bank Trying to Tell Us?], we concluded it was susceptible to further weakness.

    We hadn’t paid attention to DB’s buybacks, as the tea leaves had already been easy enough to read.  But, the Facebook experience made us curious, so we looked.

    Unlike Facebook, DB discloses each individual transaction (the yellow arrows, below) in its financial statements.  There is obviously a strong correlation between buybacks and important support levels — particularly when the stock had fallen or was in danger of falling below its SMA200 or a channel or trend line of support.

    In reality, there wasn’t one single transaction that wasn’t related to the need to prop up the stock or push it above important resistance.The point isn’t that stock buybacks are “bad” per se.  If you’re the Bundesbank, the ECB, or even an employee or major shareholder who is wondering if/when DB’s $40 trillion derivatives portfolio is going to blow up, you are probably fully in support of such activities.

    But, if you purchased the stock because it recently broke out of a falling channel that saw it shed a third of its value since December, you might care to know that it probably wasn’t due to fundamentals.

    On a similar note, those buying the overnight ramp job might want to keep an eye on CL and RB, which are almost certain to test their SMA10s again today.  This brings us (finally!) to today’s charts.

    continued for members(more…)

  • But Wait…There’s More!

    Yesterday got us most of the way to our next downside targets.  If our monkey bones are to be believed, though, we have a little further to fall before tagging the 200-day moving averages.

    And, that’s when things could get really interesting.  The bulls would like nothing more than a clean and jerk at SPX 2608 and DJIA 23660 — a mere 1% below yesterday’s close.  But, COMP is still 2.7% away from its SMA200 at 6819.

    So, either we’re in for another few days of floundering — while COMP’s SMA200 gradually works its way higher, to a level that doesn’t punish SPX.  Or, we could see investors panic when SPX drops through its important support.  And, we all know what that looks like.

    Our targets haven’t changed one bit since last week.  So, grab some popcorn and enjoy the show.  The good part should come around 10:30, when EIA inventory data is released.

    continued for members(more…)

  • BoJ: The Waiting Game

    That master of incredulity stretching himself, Haruhiko Kuroda, insists that Japan will reach 2% CPI sometime in the next five years.

    That was all the yen carry trade algos needed to hear.  USJDPY reached our initial upside target with ease, and is threatening to keep going.

    The futures, which have really struggled to climb on top of the SMA10, took the opportunity to pile on 15 quick point, which is likely to shrink to 7 by the time the opening bell rings.

    I highlighted the after-hours trading to make it perfectly clear where most of the upside has come from lately, and this latest “breakout” in particular.  With the help of USDJPY, CL and VIX, it’s just not that difficult to ramp the futures higher.

    The real test comes when the volume ratchets up, and the meager few carbon-based investors remaining have an opportunity to assess things.  Lately, they have called BS on the overnight ramp jobs — but have been unable to follow through.

    It almost came together yesterday, but VIX’s 10% plunge from its overnight highs and CL’s reversal from its breakdown (the red trendline below) combined with USDJPY’s spike to salvage the H&S necklines yet another day.Will today be the day?

    continued for members(more…)

  • Is the Market About to be De-FAANGed?

    Bottom line, they’re all looking pretty vulnerable at this point…

    AMZN shows negative divergence and a bearish RSI channel.Ditto for NFLX.
    AAPL is due to drop through its SMA200 — never a very bullish development for any stock.

    And, FB has yet to make it back above its neckline — or, any support, really.  If the SMA10 goes…shareholders could be Zucked.

    And, while not officially part of the acronym, TSLA has certainly enjoyed its share of animal spirits.  Despite Elon sleeping on the floor, the stock hasn’t been able to remain above its H&S neckline.If/when the leadership goes, things could get pretty ugly.

    Stay tuned.

     *  *  *

    P.S. Added to the list on Apr 24…


  • Degree of Difficulty

    Markets face a difficult task, today: keep the rally alive while interest rates and inflation are making investors very, very nervous.

    The interest rate breakout continues, with TNX reaching 29.75 moments ago.  It was enough to get DXY back up to its neckline again — the 5th backtest so far.   Anything higher, though, would be a problem. And, it was almost enough to get ZN to our early downside target. The question over the past several months was how to get ZN and DXY down to support — whether in one fell swoop or drawn out for months — without equities falling apart.

    With USDJPY closing in on overhead resistance and EURUSD finding support at its triangle bottom, it’s going to be tricky for stocks to hold these levels, especially if CL and RB take a dive.

    AMZN is showing negative divergence with a bearish falling channel in its RSI.And, AAPL is very likely to drop through its 200SMA.Will the bulls pin it on FAANG?  Probably.  FB and NFLX also look vulnerable, here — lending credence to our COMP theory.

    continued for members(more…)