

As expected, the oil and gas breakout has pushed CPI to levels not seen since Dec 2011.
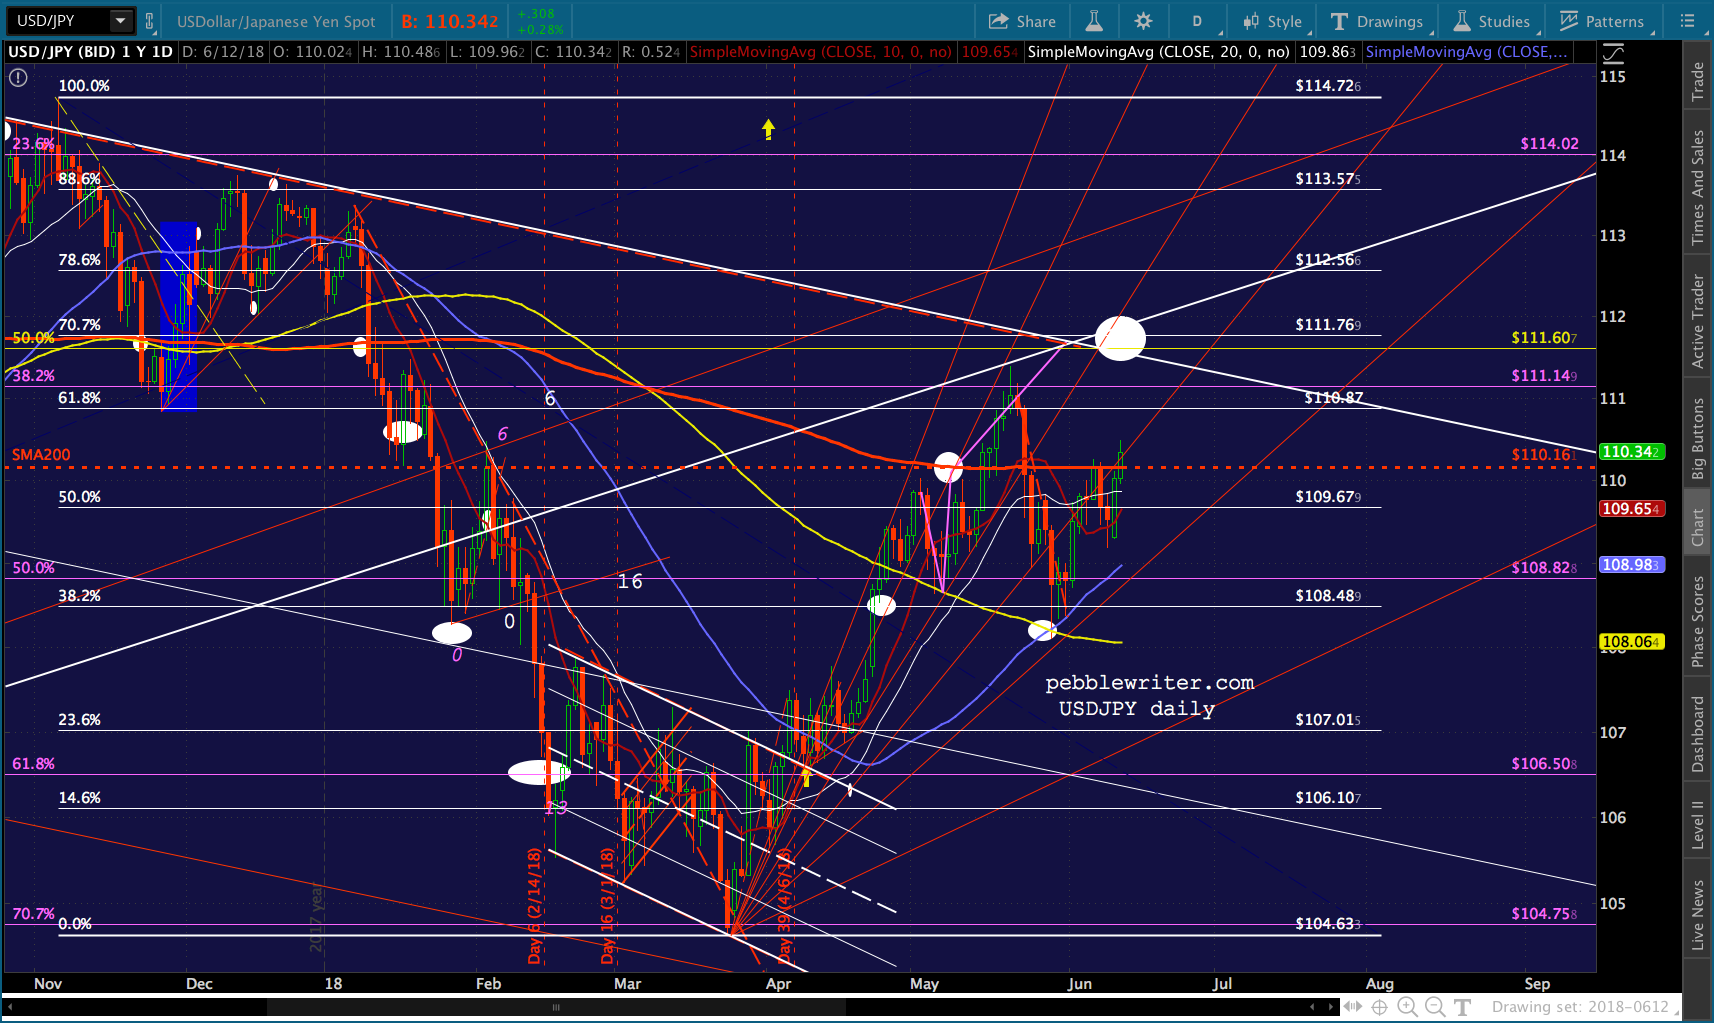
 So far, equities are taking the news in stride – with VIX and USDJPY well-positioned to help prop up futures – to a point.
 But, inflation at these levels has huge implications for oil and gas prices, the bond market, and equities.
It’s now been 57 days since the 10s2s tagged the trend line connecting its previous lows (and stocks’ previous highs.) At 2.96%, the 10Y is higher than during any FOMC meeting since June 21-22, 2011 — a few weeks before the US debt downgrade.
At the time, CPI was 3.63% and WTI was $94. By Oct 4, 2011 SPX had plunged 17%, WTI had plunged 19%, and 10-year yields had collapsed 80% to to 1.72%.
CPI dropped below 3% in December and has remained below it ever since — despite a doubling of central bank balance sheets, $7 trillion in additional US gov’t debt, and the so-called “robust recovery.”
We’ll revisit some of the charts which first illustrated the problem in the post Oil & Gas, Inflation and Interest Rates: A Delicate Balance or Goal Seeking? The most important comparison to 2011, IMO, illustrates that interest expense is once again exploding as inflation drives rates higher — but, this time with $21 trillion instead of $14 trillion in debt.

continued for members…
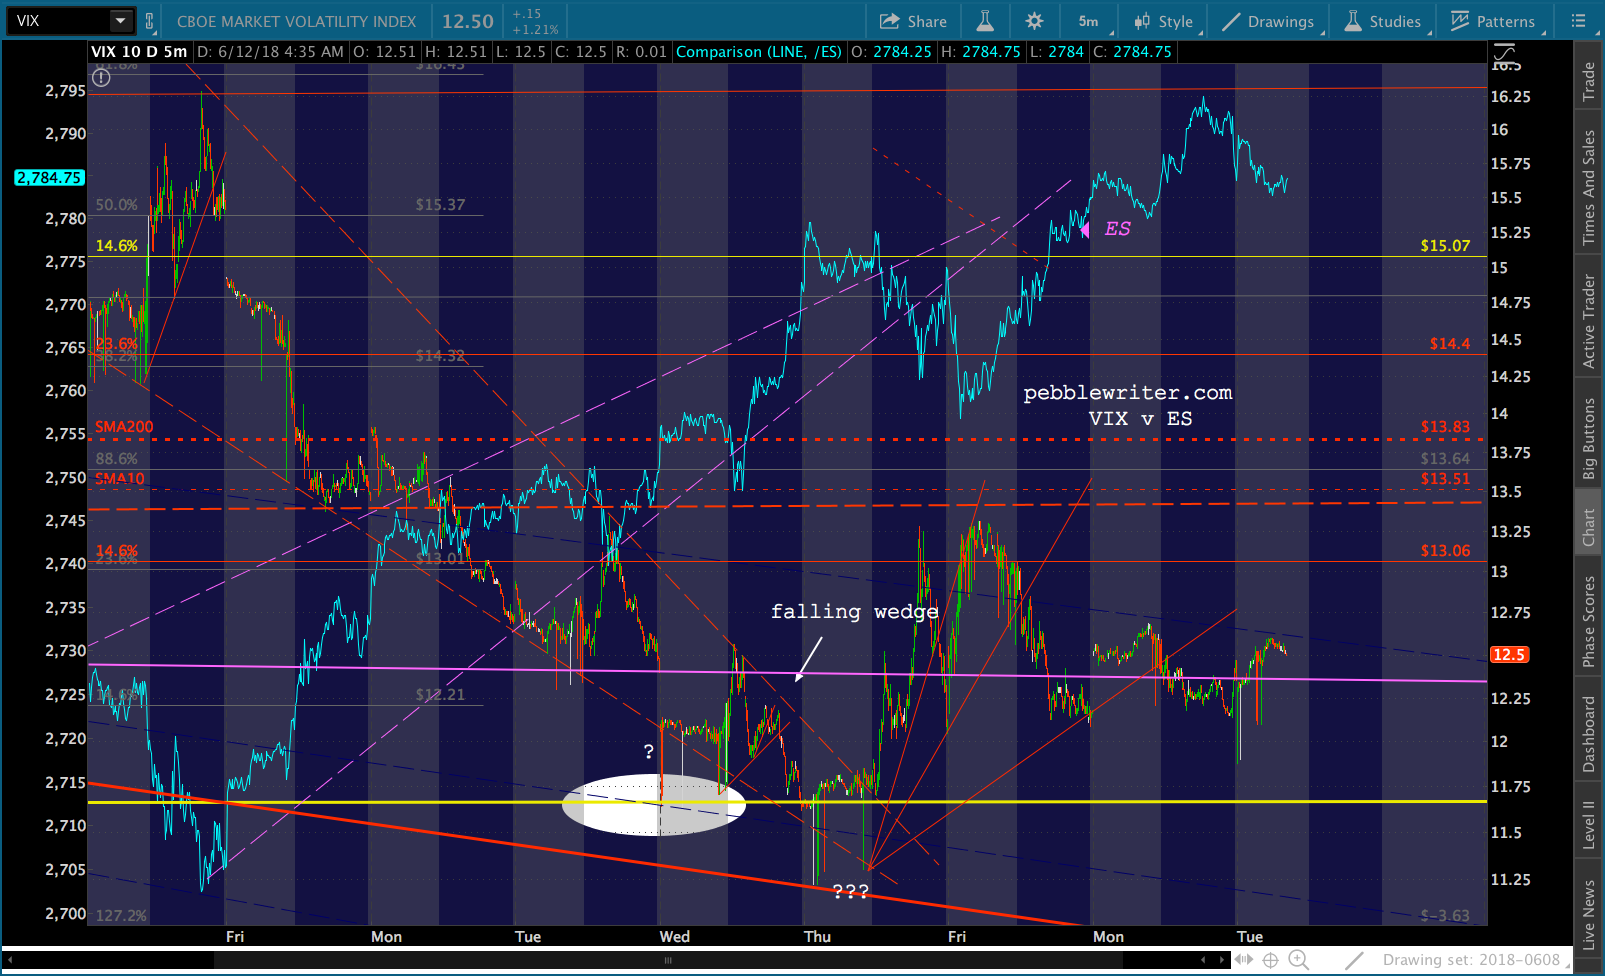
VIX is still within striking distance of the yellow channel bottom and well below the SMA200.
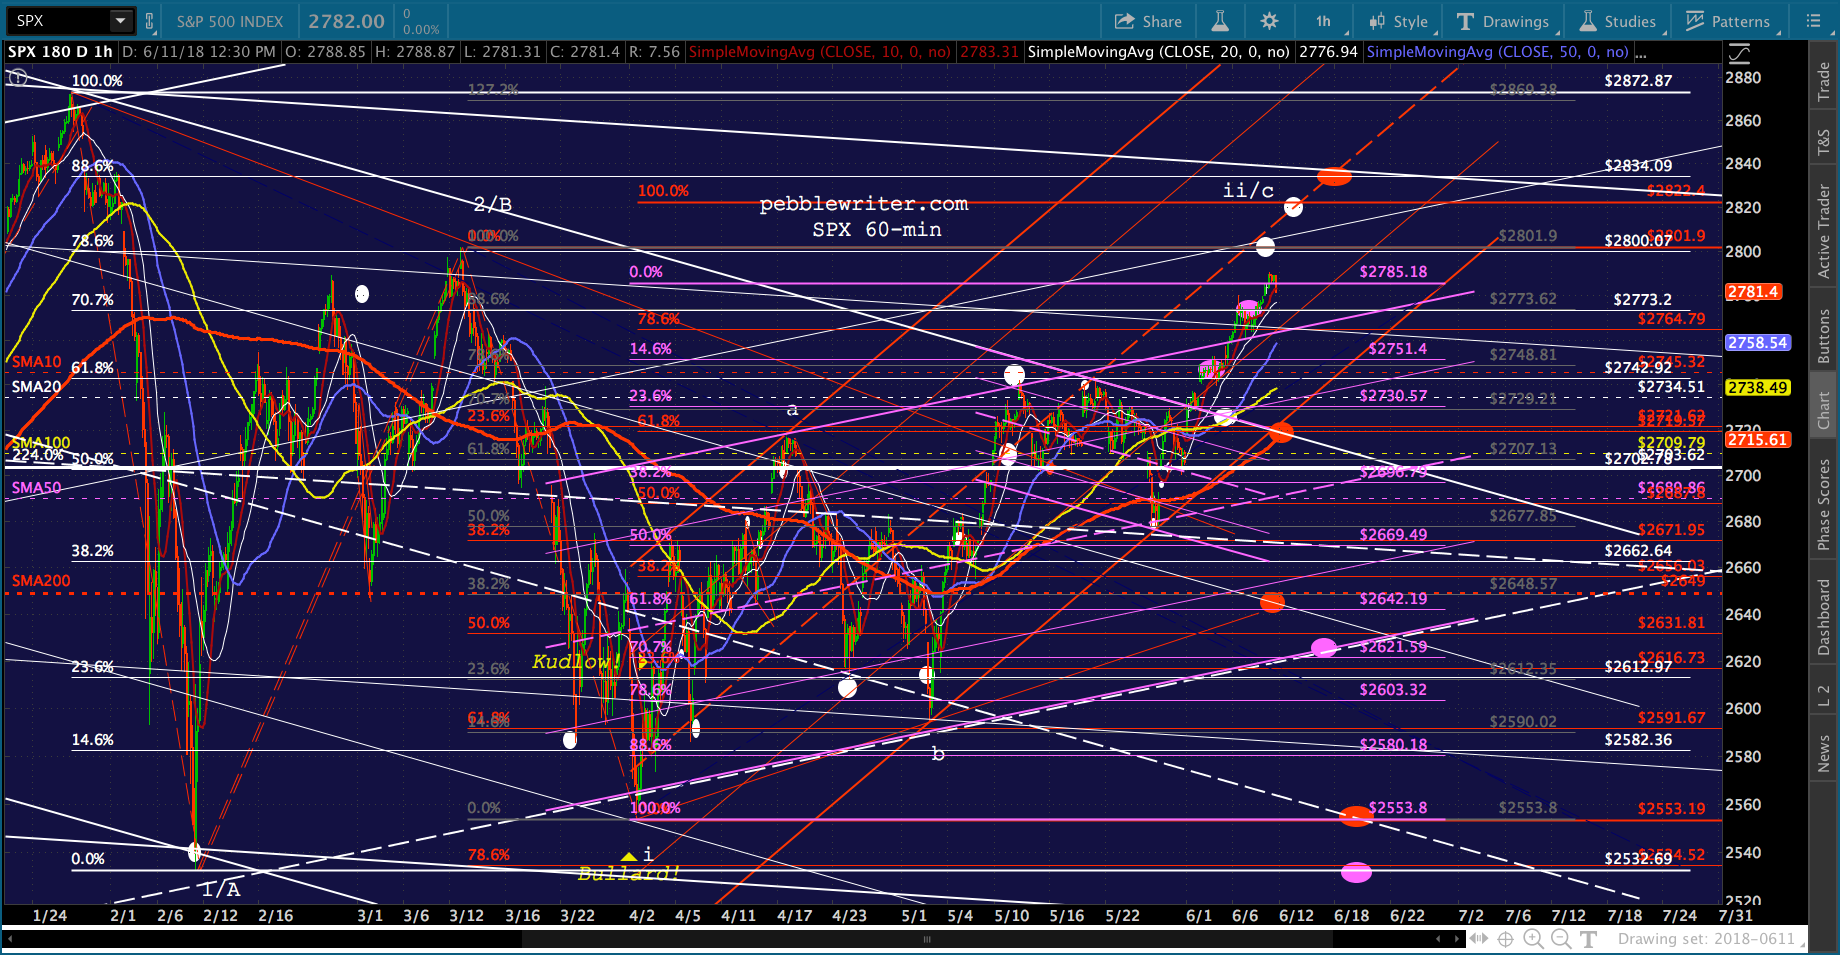
 We talked yesterday about DJIA’s .618 being an important line in the sand. It still is.
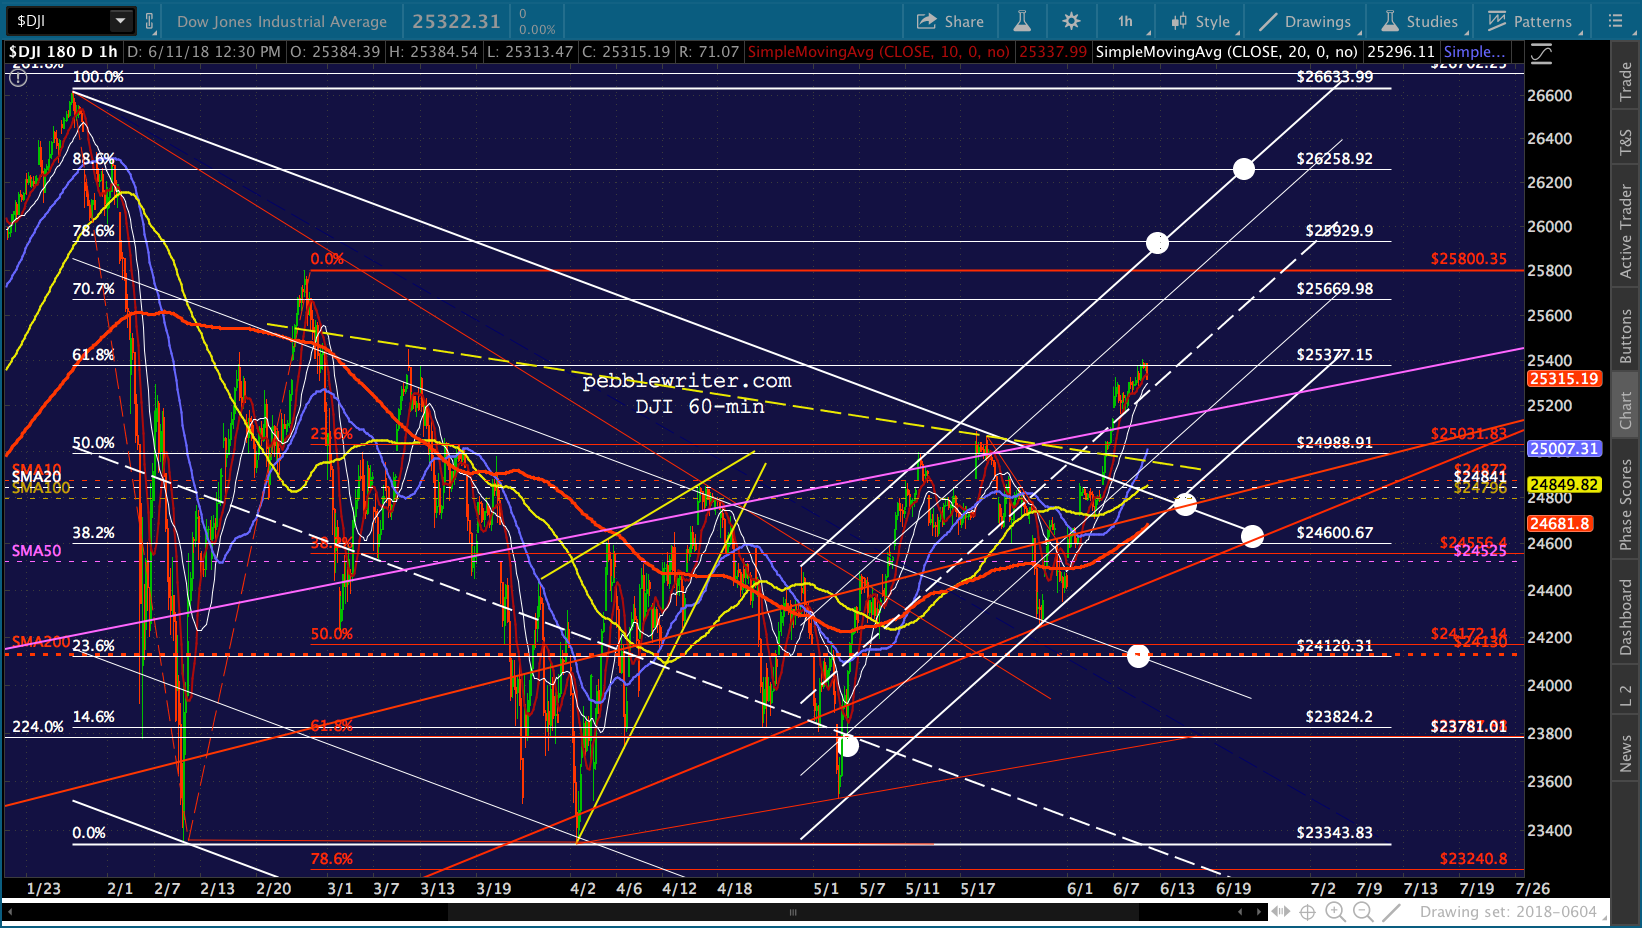 While SPX should still be considered a good candidate for a backtest.
 COMP – the outlier – already made new highs and is threatening to hold the red midline.
 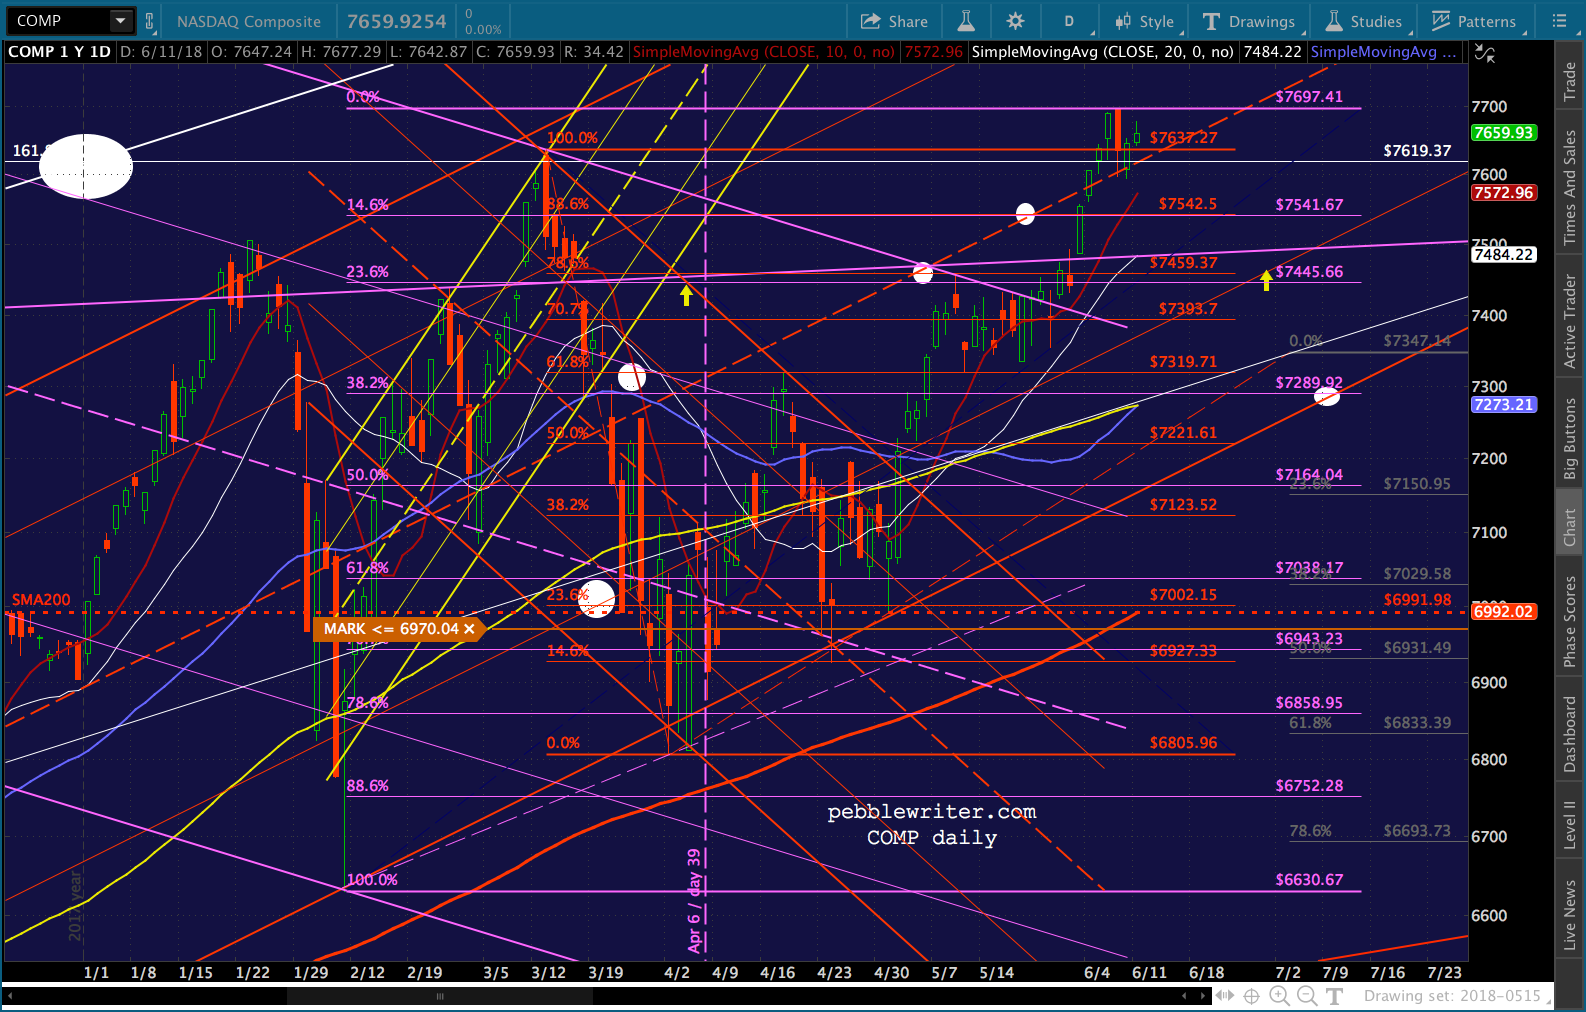 USJDPY continues to threaten a breakout past the SMA200 to the channel top – or higher if need be.
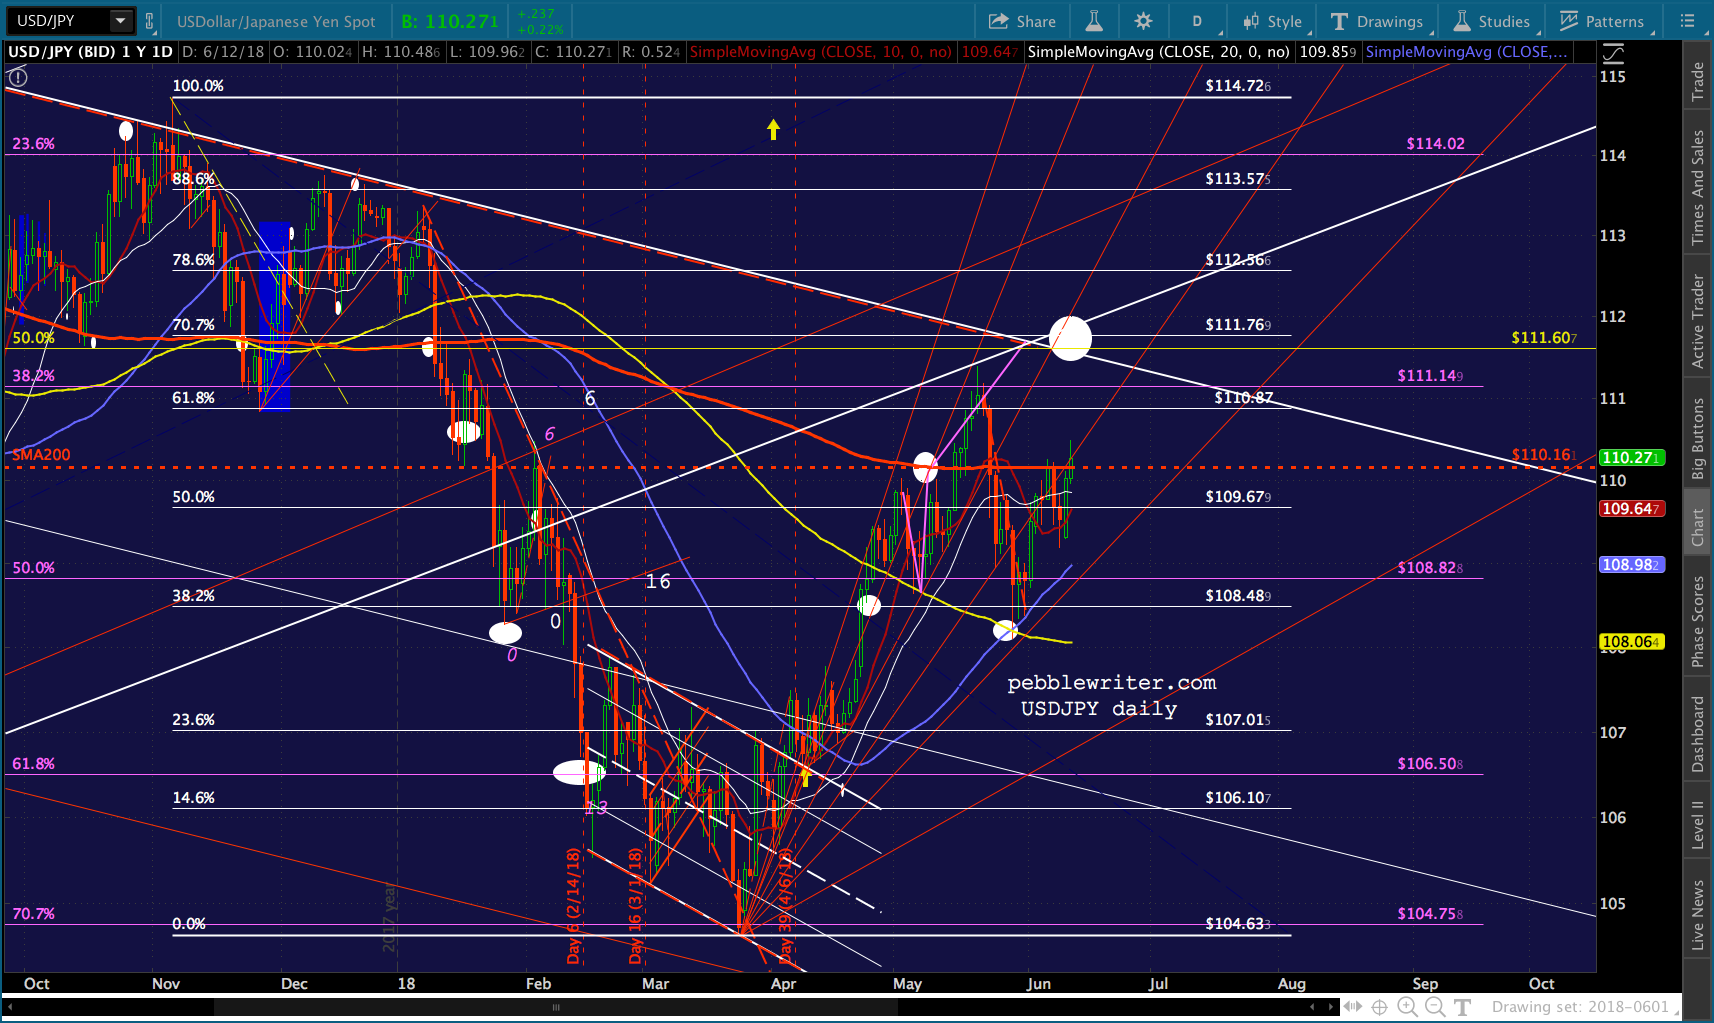 Nothing new, really, for RB or CL.
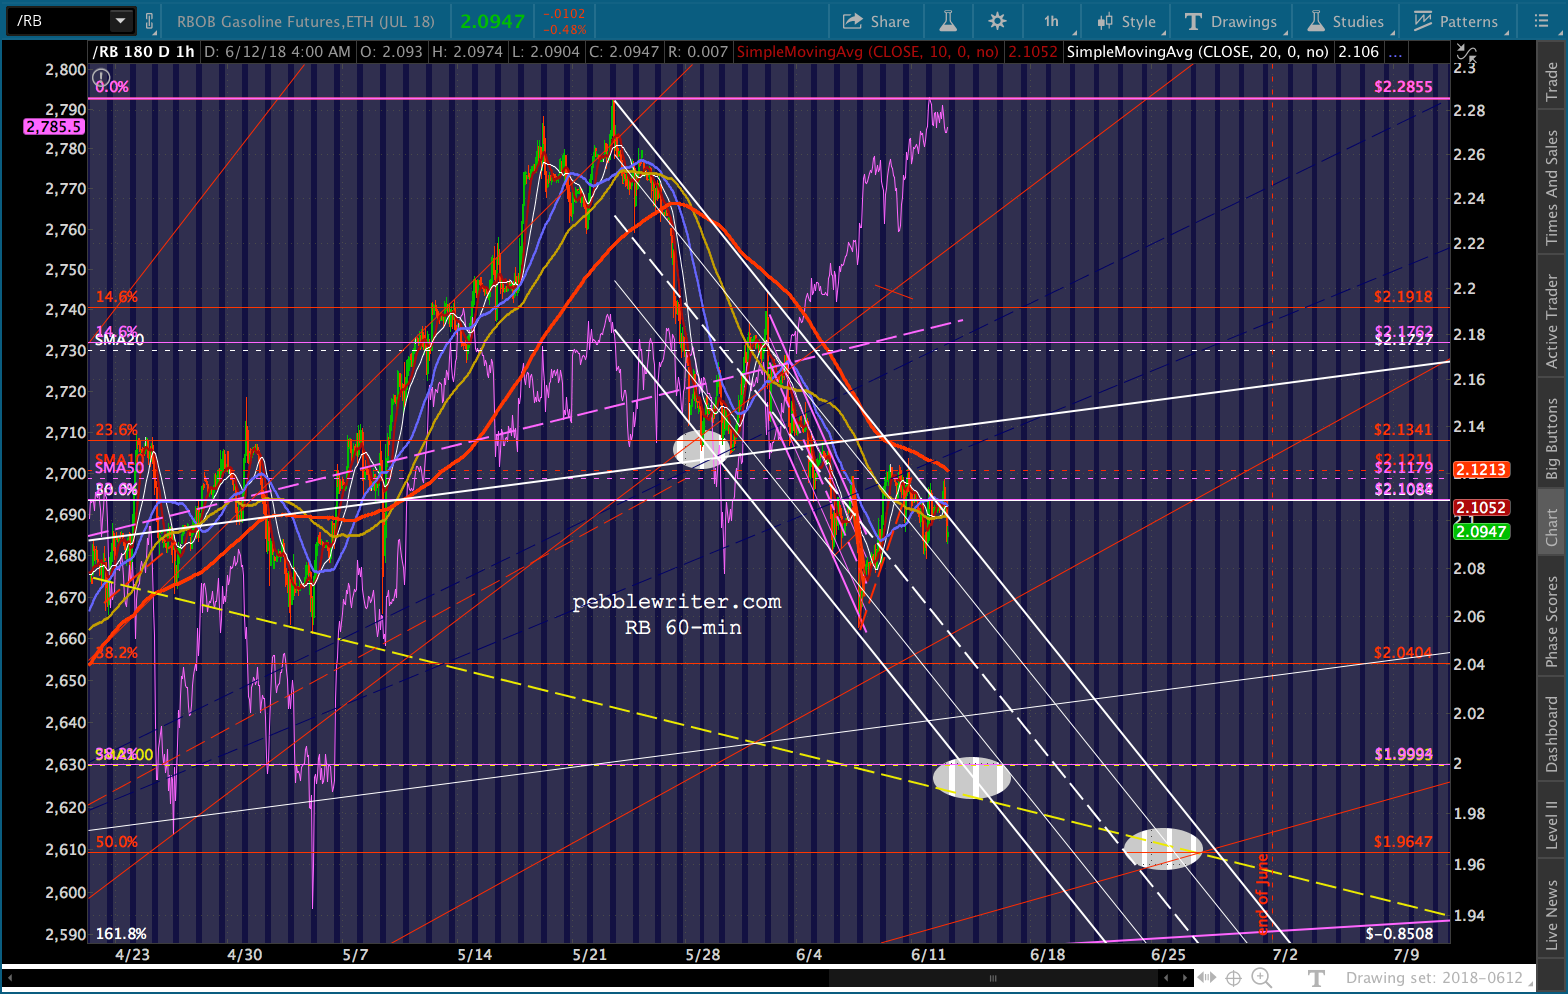 Not to beat a dead horse, but rates can’t go any higher without serious repercussions.
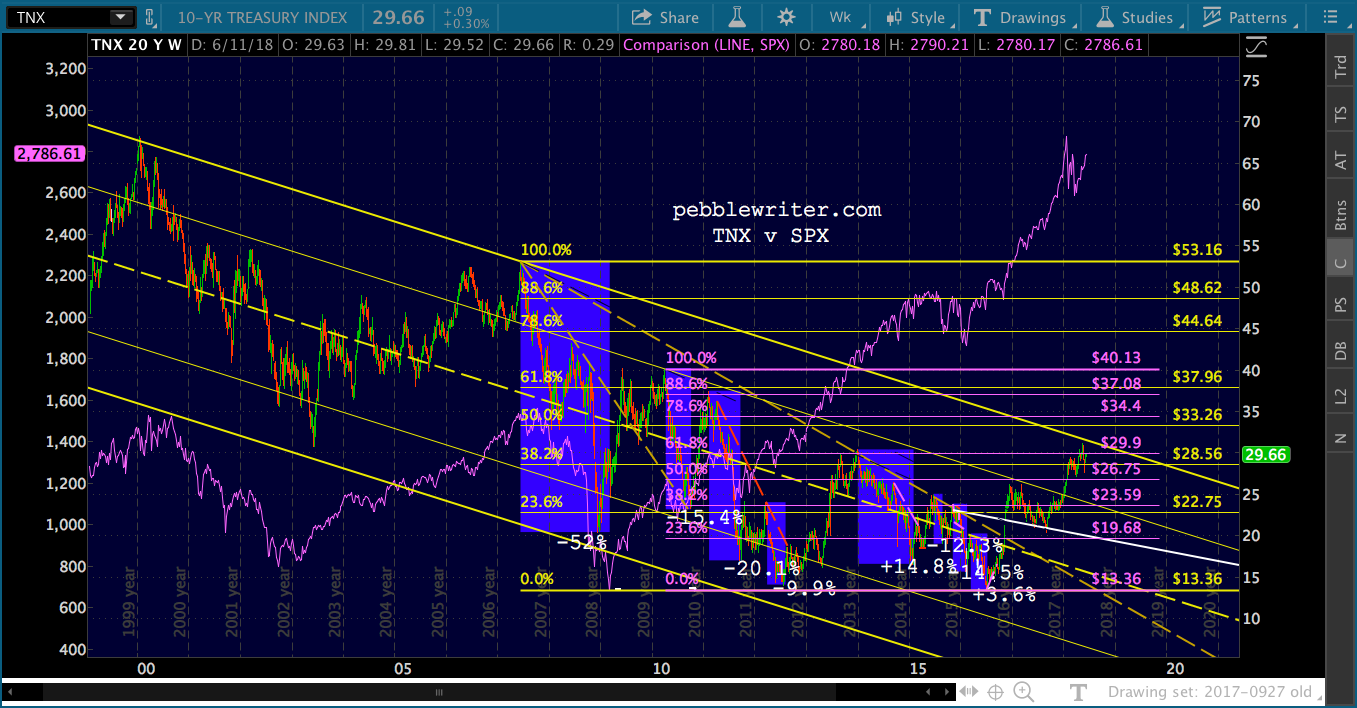 I think it would be very difficult to stuff TNX back into its box if it breaks out. And, since most past downturns in rates have been negative for stocks, this doesn’t bode well for SPX.
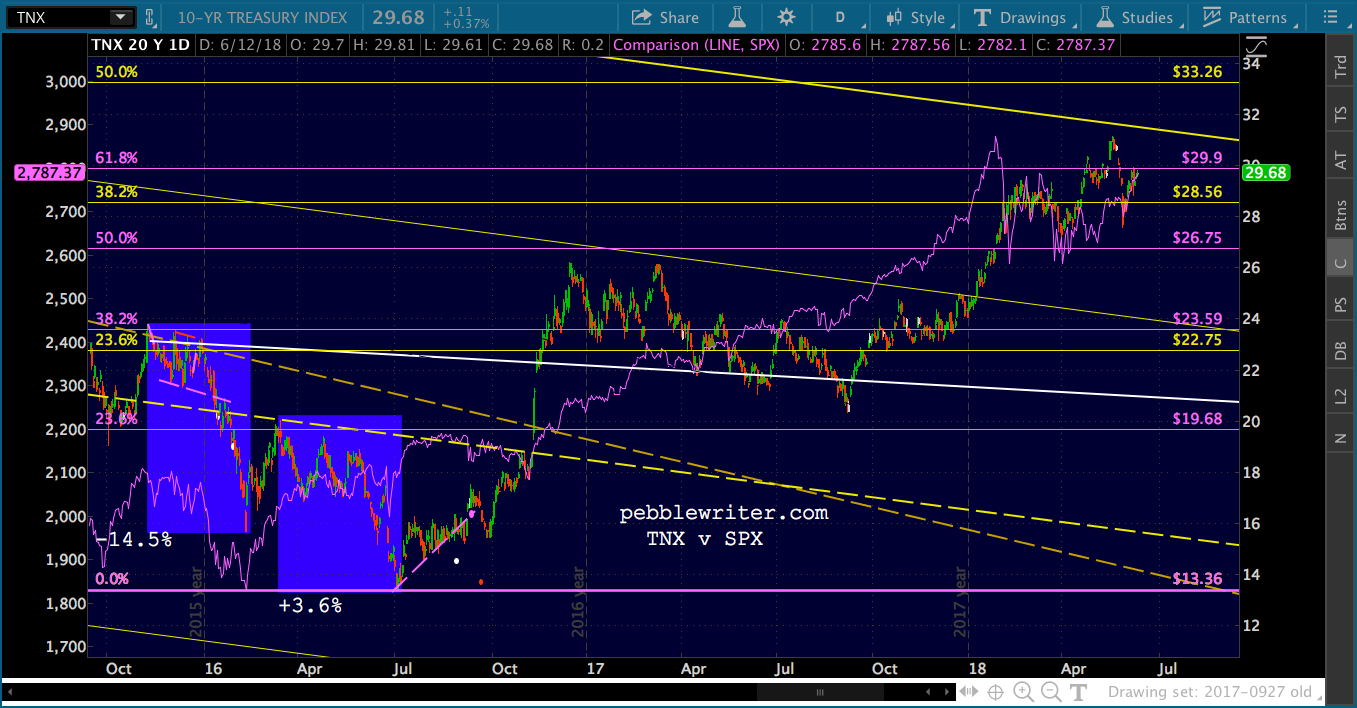 I have to step into a meeting, should be back in the office around 2:30.
UPDATE: 3:55 PM
Meeting ran later than I expected…SPX is back to positive with DJIA off a whopping 2.3 points. The usual suspects: VIX and USDJPY.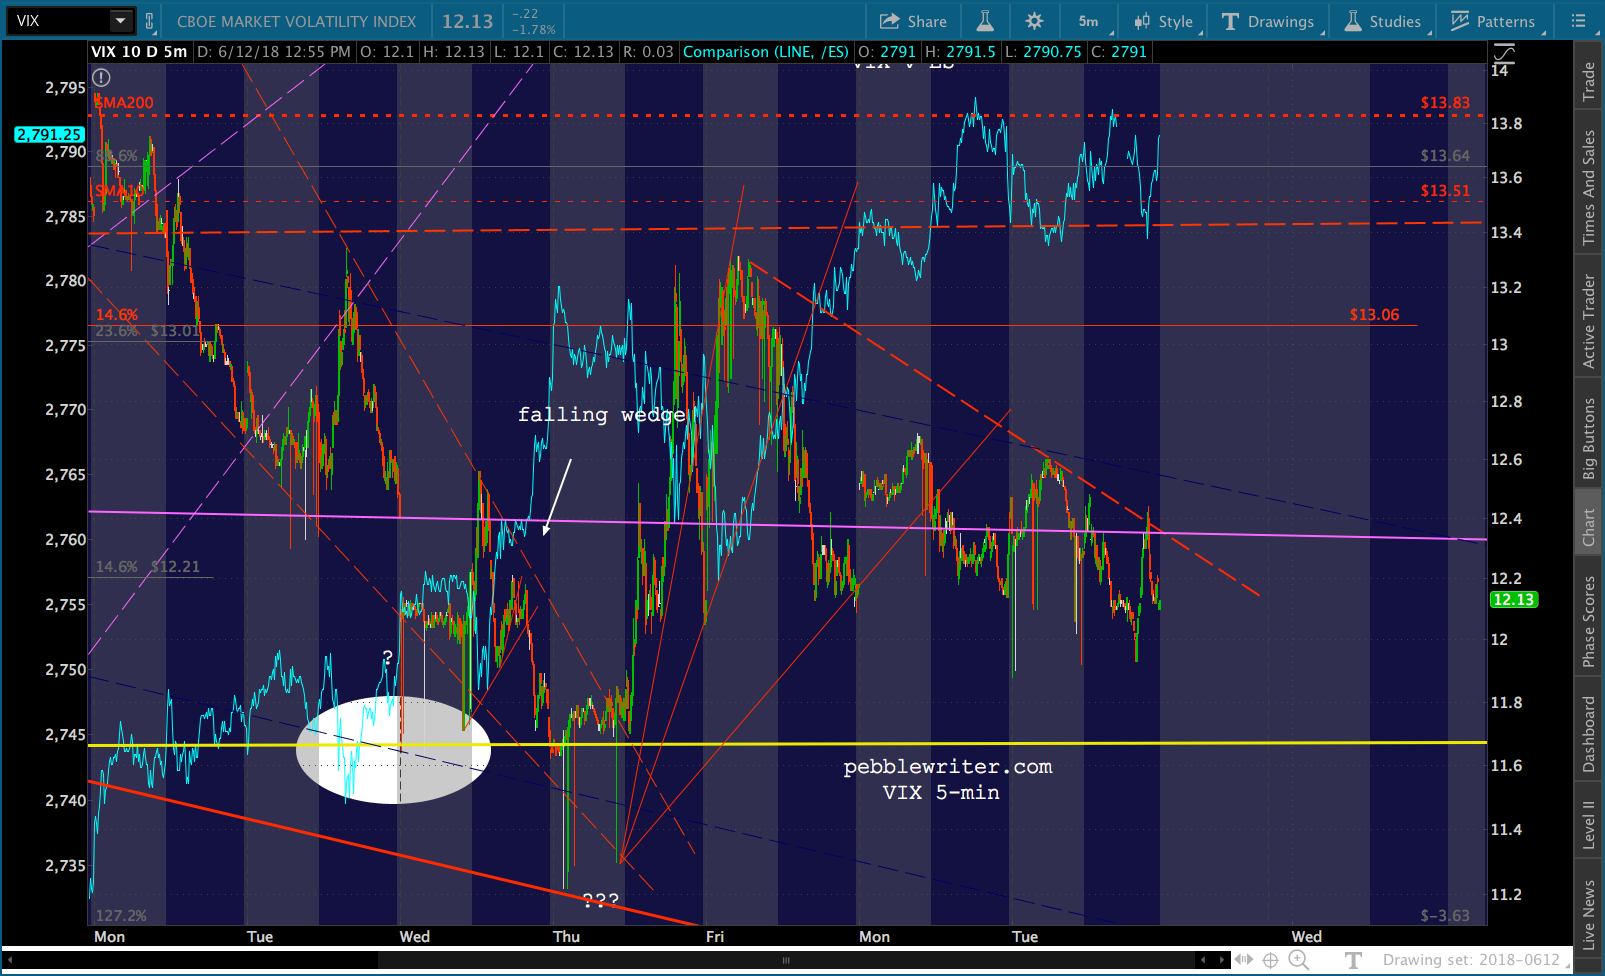
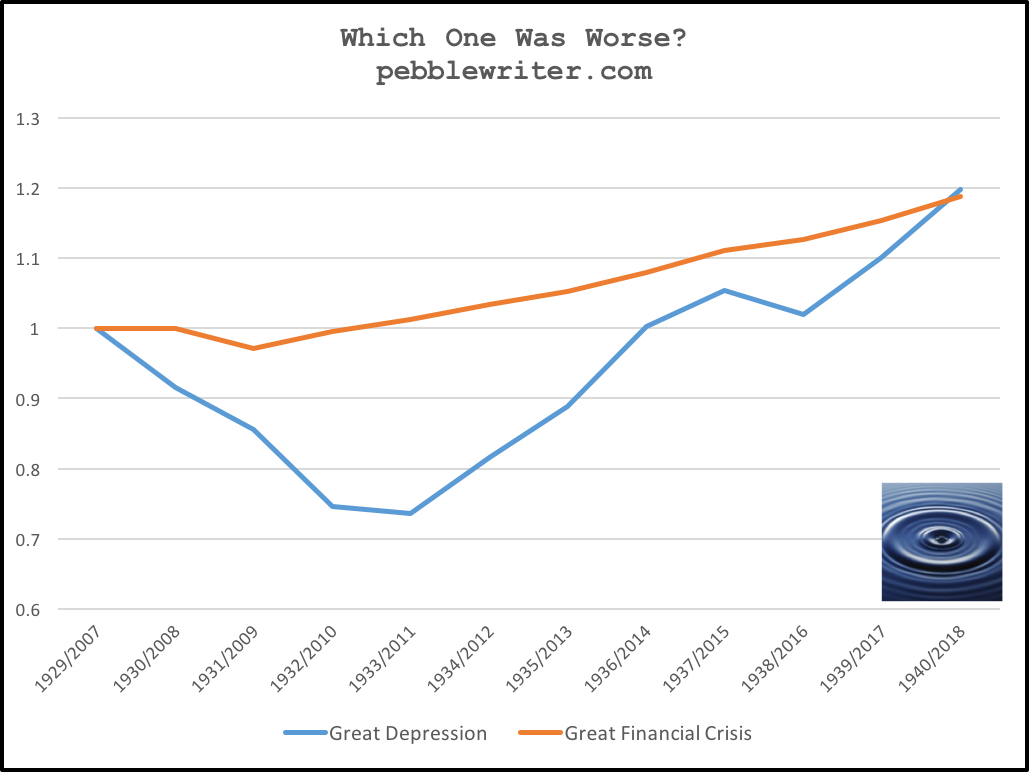
 A chart I’ve been wanting to post for a while…
Comments
2 responses to “CPI: Highest Since Dec 2011”
Hello PW, good point on the difficulty to suppress TNX after it breaks out.
I see an irony. To bring TNX back down, CL needs to go down (for the inflation effect). However, as you pointed out yesterday, CL and SPX often go in sync. CL goes down and SPX goes down.
Such as irony. They want CL to rise, so that SPX will rise.
So, TPTB will choose the lesser evil?
Yes, which is….? So hard to tell, with a new Fed chair and new NY President. But, I think they’re probably terrified of rates getting out of control, so will do what they can to clamp down on oil/gas. There are other ways to prop up stocks, as we’ve seen since gas topped out on 5/22 – 9% ago. Of course, we’ve also seen plenty of instances of CPI being manipulated.