The big news yesterday was AAPL’s market cap reaching $1 trillion. For chartists, however, the big story was the breakout shown below.
 It’s hard to overstate the importance of this move. Just a few days ago, the stock had broken below a trend line dating back to April 27 and was retreating from its 2.24 Fibonacci extension. From a charting standpoint, it was in trouble.
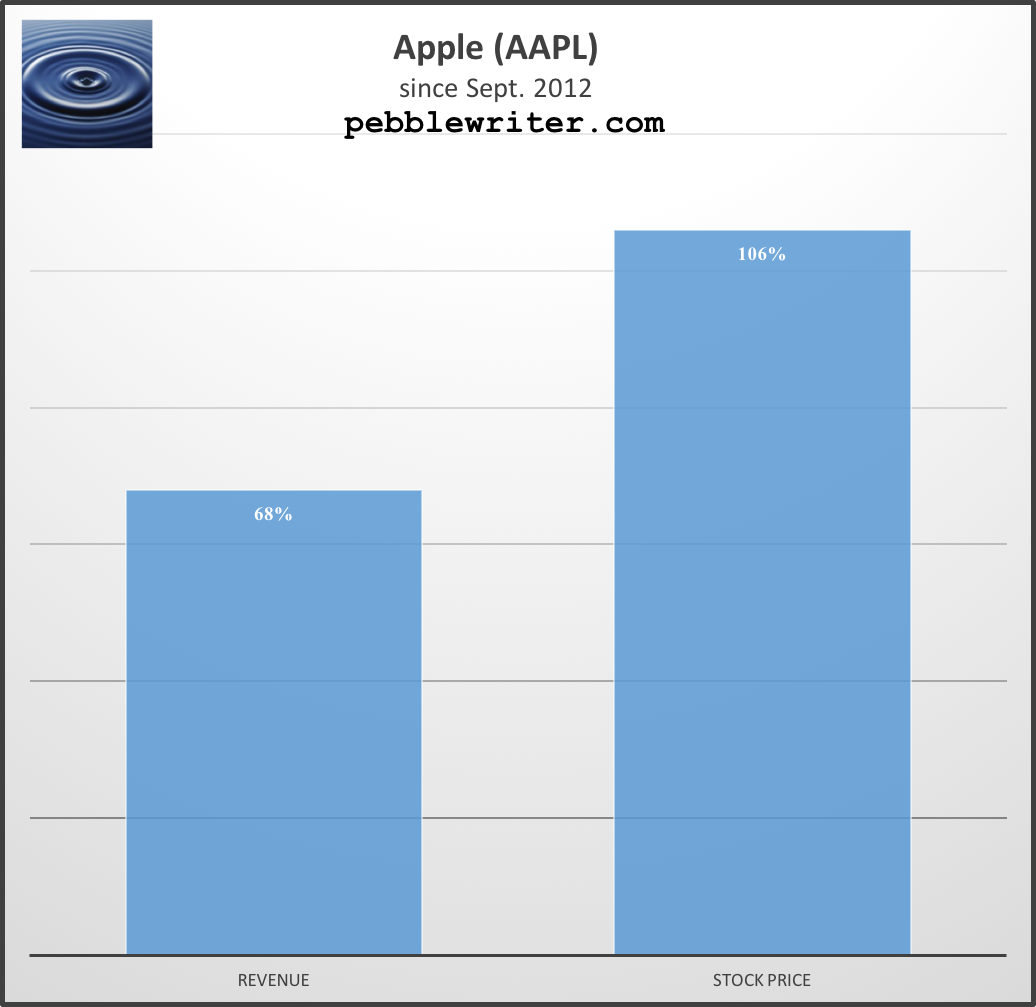
 Revenues have grown 68% since that first market peak in 2012 — about 9.04% on an annually compounded basis (based on estimates of $263 billion for FY2018.) The stock price, however, has grown 106%, a compounded annual rate of 12.9%.
 Those who follow AAPL know it has been the poster child for stock buybacks. The board has approved a total of $310 billion since Apr 2012.
  Might this activity account for some of the stock’s success? Let’s take a closer look.
$310 billion is a lot of money. But, consider that the average daily trading volume in AAPL in the 1,600 trading days since the program started was $5.7 billion. In other words, the entire program comprises about 54 days worth of volume. Fifty-four out of 1,600 — could it make much difference? When we compare the announcements to stock prices, we can see that most were beneficial. When we compare them to chart patterns, though, the extent of the benefit is startling. As they say, timing is everything.
$10B Announcement (2012): I don’t know what prompted this first announcement, but it came shortly after the stock had broken above a trend line (red, dotted line below) going back to April 2010. The company also announced outstanding earnings and the resumption of dividend payments, the first time since 1995.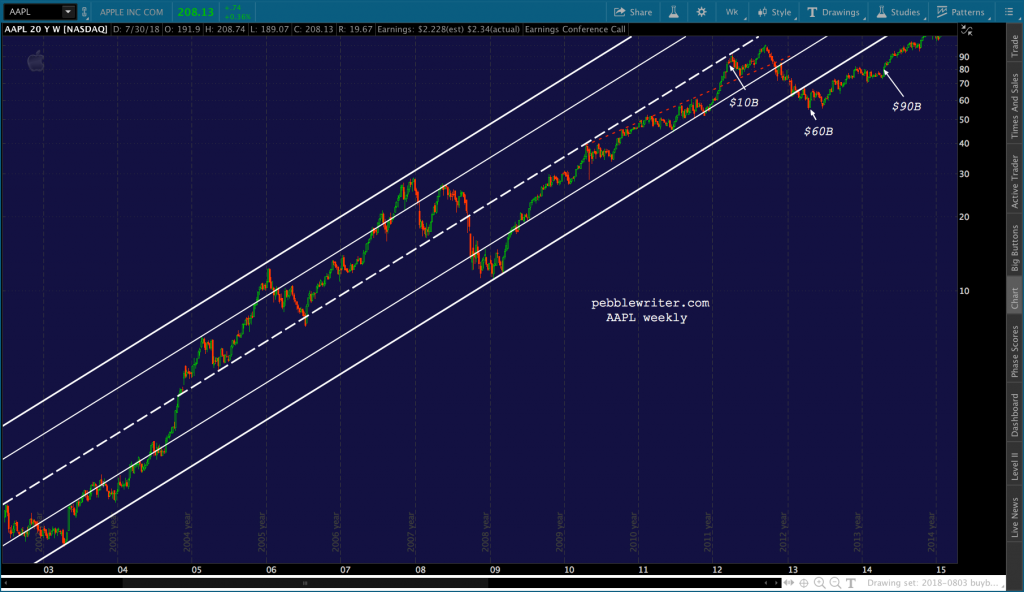 $50B Announcement (2013): This one is a little more obvious. Not only had the red trend line given way, but the white channel which had guided prices higher for the past decade had broken down.
As I warned in November 2012 [Update on AAPL] and again in January 2013 [AAPL: Flirting with Disaster], AAPL had completed a Head & Shoulders pattern that targeted the June 2011 lows. The losses from the Sep 2012 highs would have exceeded 50%.
The massive $50B addition to the share repurchase plan held AAPL’s losses to a “mere” 45%. Unbeknownst to us at the time, it also established the gently rising purple channel AAPL just broke out of. $30B Announcement (2014): In November 2013, Carl Icahn — who had accumulated $2.6B since August — filed a shareholder proposal to encourage Apple to distribute $150B to shareholders.
In addition to Icahn breathing down its neck, Apple’s stock was having a tough time. Keep in mind the rising white channel was still broken down. In addition, a rising wedge (in yellow below) had formed and broken down.
Last, the stock had reversed just shy of its .618 Fib and been unable to rise above a Fibonacci fan line (yellow, dashed) from its 2012 highs. Increasing the share repurchase plan by another $30B seemed to help. $50B Announcement (2015): Fortunately for Apple, someone had convinced them to pay attention to Fibonacci patterns along the way. Unfortunately for Apple, the action they took in April 2015, when AAPL reached its 1.618 extension and the top of the small, white channel from early 2013 wasn’t enough to stave off the effects of the S&P 500 having reached critical resistance [more on this later.]
 Despite the announcement on April 27, AAPL topped out the next day. It struggled to stay aloft until late July, but finally succumbed, tumbling 31.6% (compared to SPX’s 12.5%) by the time the broader market bottomed out on August 24.
$35B Announcement (2016): The 2016 expansion was purely defensive. Having held horizontal support when the market bottomed out in February, AAPL had failed in its attempt to hold the purple channel midline or break out of the trend line (red) connecting its recent highs. It was also dipping perilously close to its September 2012 highs (100.72.)
 The $35B addition wasn’t enough. The company reported its first quarter-over-quarter revenue drop since 2003 and its first year-over-year drop in iPhone sales ever. The stock gapped down 8%, wiping out nearly $50 billion in market cap in a day. It would take three months to recover.
$35B announcement (2017): A rising tide lifts all boats. So it was in April 2017 when SPX has broken out past important resistance and AAPL needed just enough to hold its 1.272 Fib and purple channel .786 lines. This was a tweak, and an earnings beat and upbeat guidance — along with the iPhone X launch — helped the stock hold its own when it revisited this level two months later. $100B announcement (2018): Apple has apprently spent every dime of the $210B previously announced. That’s six years of timely support, lucky bounces, fortunate developments, $100 million paydays. Could you walk away from it? Neither could Tim Cook.
The $100B just announced couldn’t have come at a better time. The stock has been struggling with the purple 1.618 extension at 162.39. It failed to punch through in August 2017, made it through in October 2017, plunged back below it in February 2018, screamed above it a week later, and tumbled back to it on Apr 24.
Had the biggest share repurchase plan expansion plan ever not been announced 5 days later, the stock likely would have dropped through the 1.618 and the bottom of the rising red channel. But, we’ll never know. Clearly, it was enough to create a bounce off of those, push through the purple 2.24 extension, and break out of the rising purple channel on yesterday’s Q3 earnings report. As “luck” would have it, AAPL managed to close 0.53 above the purple 2.618 extension today.
Effects on the Overall Market
The AAPL chart below shows SPX’s key Fibonacci levels as they have played out since 2012.  AAPL’s announcements line up quite well with key breakouts and backtests.
- SPX’s break out past its .786 Fib which marked the 2011 highs (Mar 13 vs Mar 19, 2012)
- SPX’s break out past its 2007 highs at 1576 (April 23, 2013)
- SPX’s backtest of its 1.272 extension at 1823 (Apr 24 vs Apr 13, 2014)
- SPX’s attempt at its 1.618 extension (topped May 20 vs AAPL’s Apr 27, 2015)
- SPX’s break above the trend line from 2015 highs (Apr 26, 2016)
- SPX’s break out past a smaller pattern 1.618 (Apr 24 vs May 1, 2017)
- SPX’s recovery after dipping below its SMA200 (7th time was a charm – May 3 vs May 1)
The same info from SPX’s point of view:
 Since investors (algos) have come to rely on Apple’s buyback announcements every April, we may as well put these on our calendar.
In Conclusion
It seems clear to me that the timing of Apple’s buyback announcements played an important role in the stock reaching its recent highs. If the company published the actual transactions, I suspect we would find that they were instrumental in overcoming resistance and holding support.
From an earnings standpoint, this sort of financial engineering is clearly beneficial. Borrowing money to buy back shares increases EPS and shifts dividend expense (non-deductible) to interest expense (deductible.)
Is it a good thing that AAPL has managed to break out and achieve a $1 trillion valuation? I doubt there are many shareholders who would complain. Employees who own stock or whose employment prospects are enhanced by Apple’s success are probably happy, too. So, what’s the problem?
In a Harvard Business Review article Profits Without Prosperity, William Lazonick makes a pretty good argument that buybacks represent stock manipulation. By driving prices artificially higher, corporate executives increase the value of their stock awards and options — about 83% of their compensation.
He further argues that funds going toward repurchases could be better spent on innovation, employee (the other 99%) compensation, and productivity improvements. Although I can find no fault with Mr. Lazonick’s conclusions, I’m a chartist – not an ethicist.
My goal is to accurately forecast price movements. So, when I consider the effects of Apple’s repurchase program, I think about price manipulation and market integrity. Equities are subject to substantial price manipulation from many sources, exacerbated by the fact that only 10% of trading volume is conducted by fundamental, discretionary traders.
As the largest component of the stock market (4.25% of the S&P 500) and the largest component of the FAANG stocks — which contributed over 100% of the S&P 500’s gains during the first half of 2018 — AAPL will continue to exert a great deal of influence.
Of course, influence works in both directions. Some feel that Apple has reached a plateau in terms of innovation. At some point, a slightly different screen size and slightly faster processing speed might not produce an increase in sales.
And, competitors certainly haven’t conceded the race for market share. Since buybacks were first announced in 2012, Apple’s share of smartphone sales have actually dropped from 23% to 12.1%.  I have owned Apple products ever since my first Titanium Powerbook in 2001. I enjoyed the “oohs and aahs” it drew from passersby. My family uses Mac computers and iPhones exclusively. And, I can’t imagine ever leaving the Apple environment.
But, I only recently upgraded from my iPhone 6 (not waterproof, as it turns out!) out of necessity. I could have lived with it for another year or two, no problem. I’ve owned the laptop and Mac Pro sitting on my desk since 2013 and see no need to upgrade. Of course, I could be an outlier.
But, Apple reported Wednesday that iPhone sales increased just 1% year-over-year. The average price of an iPhone increased substantially, from $606 to $724. But, with real retail sales and wage growth stagnating lately, I question whether a 20% increase is sustainable.
Bottom line, Apple’s share repurchase plan is a force to be reckoned with. It has helped propel the stock to historic levels — and, beyond. Now, all Apple has to do is deliver.
Related posts:
Update on AAPL: Nov 27, 2012
AAPL: Flirting with Disaster
AAPL: Is it Safe?
Update on AAPL: Jul 31, 2013
Update on AAPL: Aug 19, 2013
Update on AAPL: Dec 23, 2013
How Exposed is AAPL?
AAPL: Still Tasty?