Where did March go? If you’re anything like me, it was a blur. I was in the process of recovering from knee replacement surgery when the crash began [being under the influence of some very strong pain killers was probably the best way to weather the storm.]
On February 3, the day before I went under the knife, I pulled together a forecast on everything I chart: stocks, bonds, currency pairs, commodities, etc. I try to update the Current Forecast page at least every month. But, between the pain and the global pandemic which threatened to trap my daughter in Rome, I was a little preoccupied.
I had been fairly bearish when penning that Feb 3 forecast and was still lucid enough in the following weeks to warn of the coming storm, writing on Feb 18 in When Will News Begin to Matter Again…
…be very careful in chasing this breakout. It is built on a very weak algo-driven foundation which, given the coming moves in CL, DXY, USDJPY and TNX, cannot stand. When it cracks, it could be quite violent.
…and, again on Feb 20 in Buckle Up:
…the major downside support levels such as the yellow 2.618 at 3047 – which was never backtested – and 2.24 at 2703 will soon disappear from the path of the existing rising channels… All I know is that when important support breaks down, it’s time to short – especially when the usual central bank tricks aren’t working.
As it turned out, Feb 20 was the all-time high. A month later, SPX had fallen further and faster than ever before. Needless to say, the targets mentioned in the forecast were reached and exceeded in almost every case – more than reversing the excesses of the breakout above SPX 3047.
 My favorite downside targets over the past six months have been ES 2155 and SPX 2138. ES came close, dropping within 19 points of its target on Mar 23 before all hell broke loose.
The Fed began an extraordinary response which was expanded again by $2.3 trillion at 8:30:01 this morning. Not coincidentally, it was announced seconds after jobless claims of 6.6 million (also not coincidentally, which tied the worst ever prior continuing claims number) were announced.
Futures responded as planned — taking us another step past the line where price discovery used to be. The Fed might as well have named it the Prop Up the Market Program, as it lends new import to the expression “don’t fight the Fed.”
Oh, and just in case the market doesn’t understand the Fed’s intentions, Jerome Powell will give another presser at 10AM.
 Just for fun, here’s a quick peek at where things stood on February 3…
Short RB: 2/3/20 – Shorted near target on 4/24, back to long on 6/5, shorted again at backtest targets on 7/11 and back to long on 9/5. Back to short on 9/16 and back to long on 10/3. Shorted on 11/4 with tight stops, target of 1.35. Broke down on 11/19, but buy triggered on 11/20. Back to short on 11/22, long on Dec 4 and short on Dec 27. Targets are 1.44, 1.41 and 1.349.
Short CL: 2/3/20 – Shorted near target on 4/24, back to long at target on 6/5, shorted at backtest target on 7/11, breakouts on 9/16 and .886 target on Jan 8. Targets delayed by Aramco IPO in Dec and Al Asad spike in January. 54.55 target reached on Jan 24, breakdown yielded targets of 51.62 (reached Jan 31), 49.46, 47.55 and 46.
Neutral DXY: 2/3/20 – We were long from 88.253 on Feb 16, 2018. Came close enough to our 97.873 target on Nov 12 and again on Dec 14 where we shorted at 97. Multiple breakdowns have bounced back, leaving DXY in trading range between 97-99 since Aug 2019. Essentially jerking algos around with signalling rises and dips. Don’t see it as a viable trading vehicle until at least March 2020, when inflation pressures should ease and make a decline possible.
Short USDJPY: 2/3/20 – Has been consolidating since June 2016, making lower highs and lows in the 104.74 area. Highs have followed a falling channel top, with the latest tag of our upside target on Jan 17. Since then, USDJPY has accommodated stocks’ weakness, with even lower downside targets of 107.94 and 107.64.a 107.64. The range remains tight (only 3 points, 107-110ish) so – like DXY – it has offered very modest trading opportunities.
Short EURUSD: 2/3/20 – Has been in a gently falling channel since July 2018, seems destined to remain in it for the foreseeable future. Recently backtested the latest rising corrective channel it broke down from. A nice drop to 1.0592 is possible, but the ECB is being careful to avoid big drops. Next downside target is 1.0813.
Short SPX/ES: 2/3/20 – formed an inverted H&S Pattern from Jan 2018, breaking out in Oct 2019 and racing higher in an acceleration channel to 1.618 Fib at SPX 3306.51/ ES 3336.49, at which point we started looking for a backtest of the acceleration channel/SMA50 around 3200 and, if that fails, the IH&S around SPX 3100. Major support below that include SPX’s 2.618 at 3047 and the 2.24 at 2703. If SPX should break out of its current correction, the IH&S targets 3673.
Long Gold: 2/3/20 – went back to long on rise through yellow TL at 1195 in August 2018. Completed IH&S, reaching 1370 target (again) in June 2019, then channel top in Aug 2019 and again on Jan 8, 2020. Backtested rising channel midline target on Nov 12, 2019 and back to red channel top where it is threatening a breakout. If it doesn’t, it has downside risk to 1490ish, 1424 and 1380. If it does, upside targets include IH&S target at 1308 and .786 Fib at 1735.70.
Long VIX: 2/3/20 – Went long in Jan 2020 after survived test of TL from Nov 2017. Has run into resistance at successively lower points on a falling TL from Aug 5, finally breaking out on Jan 27, 2020. Upside targets now include the TL from Dec 24, 2018, favoring 23.38. A breakout above it would open up 25.50 and 33.33.
Short COMP: 2/3/20 – Spent Apr 2 through Oct 25, 2019 trying to break out of falling channels and make new highs. Oct Oct 25 2019, finally broke out for good, testing 1.618 at 9334.14 on Jan 16, 2020. Anything below 9334 opens the door to 8953, 8661 and potentially 8133. But, stops are warranted as COMP has ignored reality time and time again.
Long Bonds: 2/3/20 – ZN reached our downside target of 117’135 on Oct 8, 2018, has since bounced to our successively higher targets, reaching the .886 at 132’100 on Sep 3, 2019. Almost backtested the SMA200 on Dec 19, has since broken out, back to near its Sep high. Targeting 133’070, followed by 134’075 and 135’155.
Shorted TNX in Oct 2018 and have seen it tag successively lower targets until reaching 15.54 on Aug 15, 2019. Long, drawn out series of bounces until Jan 21, 2020 when it broke down again. Reached 1.636 target on Jan 27, 15.54 on Jan 30 and is approaching 14.91 target. If it breaks lower, targets include 14.46 and 14.29. Longer-term, see the 10Y reaching 8.16 around May 2020 and approaching 0.0 in Jun-October 2020.
We’ll continue with a roundup of where we are two months later.
continued for members… (more…)


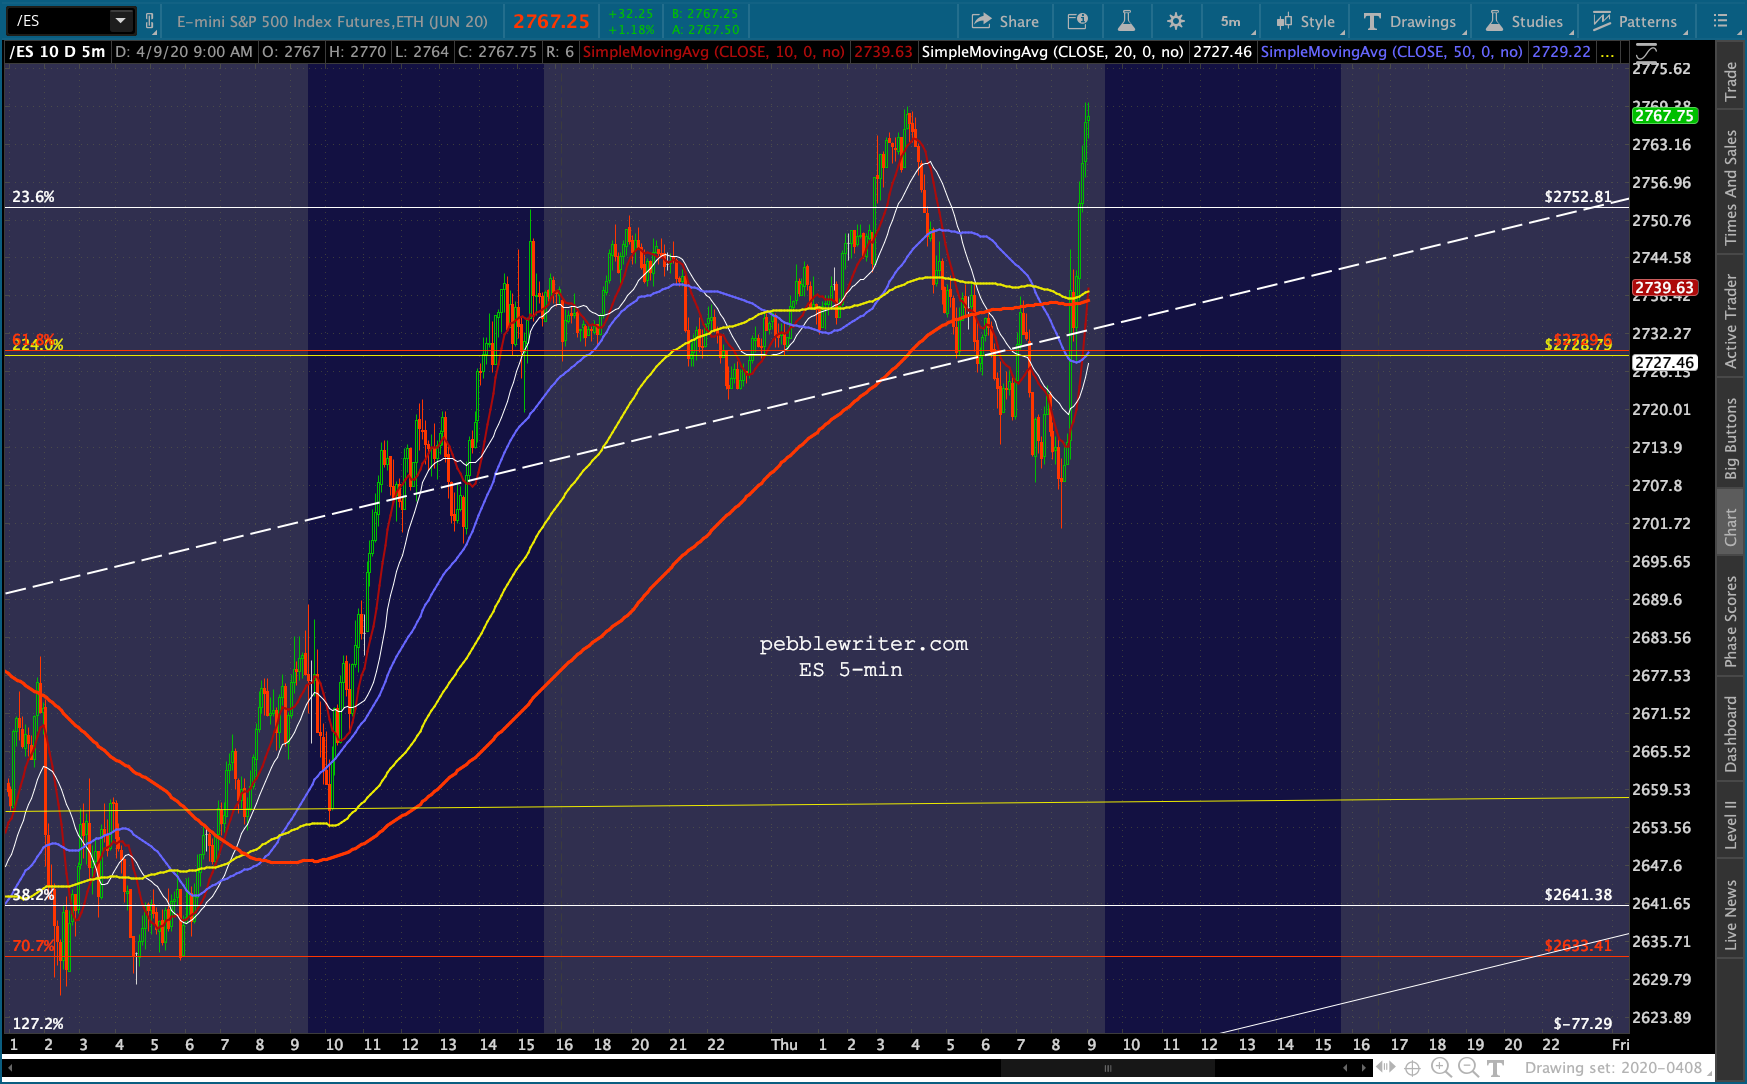
 Futures tested our initial downside target yesterday, the Fib 2.24 extension at 2728.79, and bounced overnight…
 …as oil and gas prices bounced sharply off our downside targets…
 …and VIX collapsed after tagging our backtest target.
 The question, as is often the case, is whether the relief rally can continue once equities’ cash market reopens. And, will SPX ever get to test its own critical support?