Unemployment reaches 14.7%. It’s a sobering headline, but it could be worse. As the BLS explains…
Due to the impact of the COVID-19 pandemic, the relationship between the two was no longer stable in April. Therefore, the establishment survey made modifications to the birth-death model.
If the workers who were recorded as employed but absent from work due to “other reasons” (over and above the number absent for other reasons in a typical April) had been classified as unemployed on temporary layoff, the overall unemployment rate would have been almost 5 percentage points higher than reported (on a not seasonally adjusted basis).
In other words, actual unemployment (U-6) is nearly as high as the 24.9% registered during the Great Depression.
 Since the futures have already ramped 30 points (50 points from overnight lows) higher…
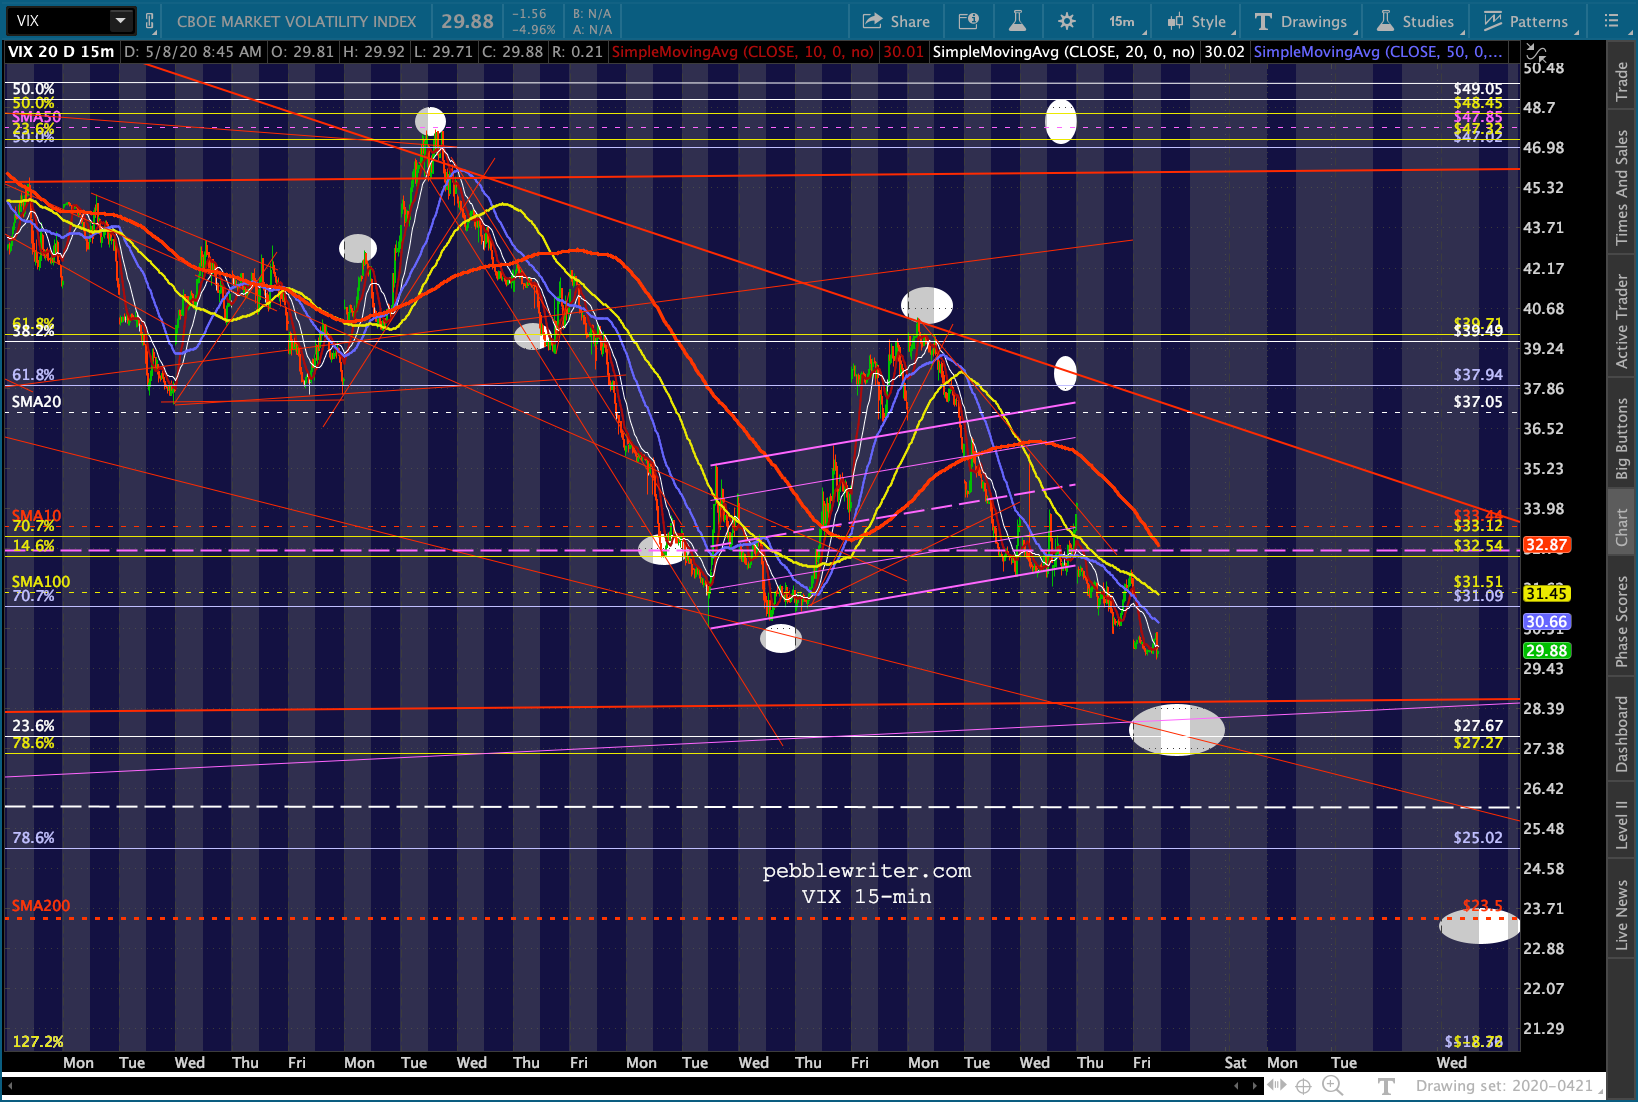
 …on the usual nightly collapse in VIX…
 …we’ll have to wait until the cash market opens to see whether or not carbon-based investors agree that 85-year highs in unemployment are insignificant.
continued for members…
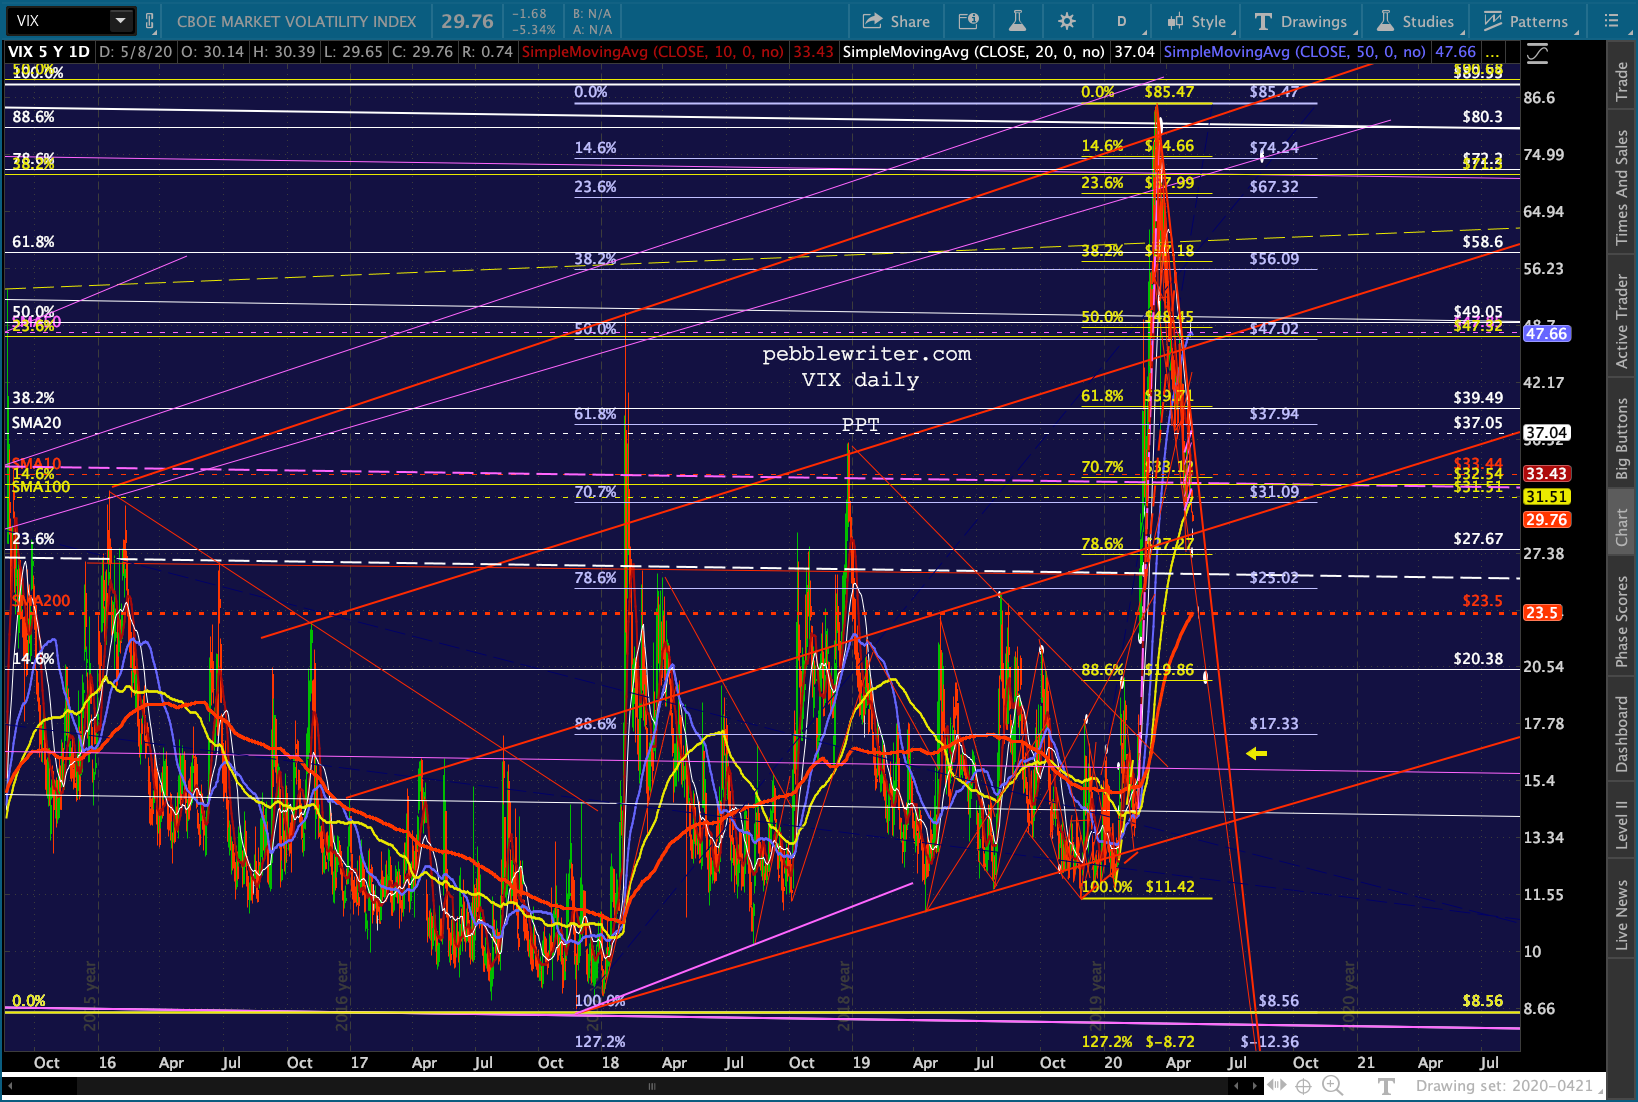
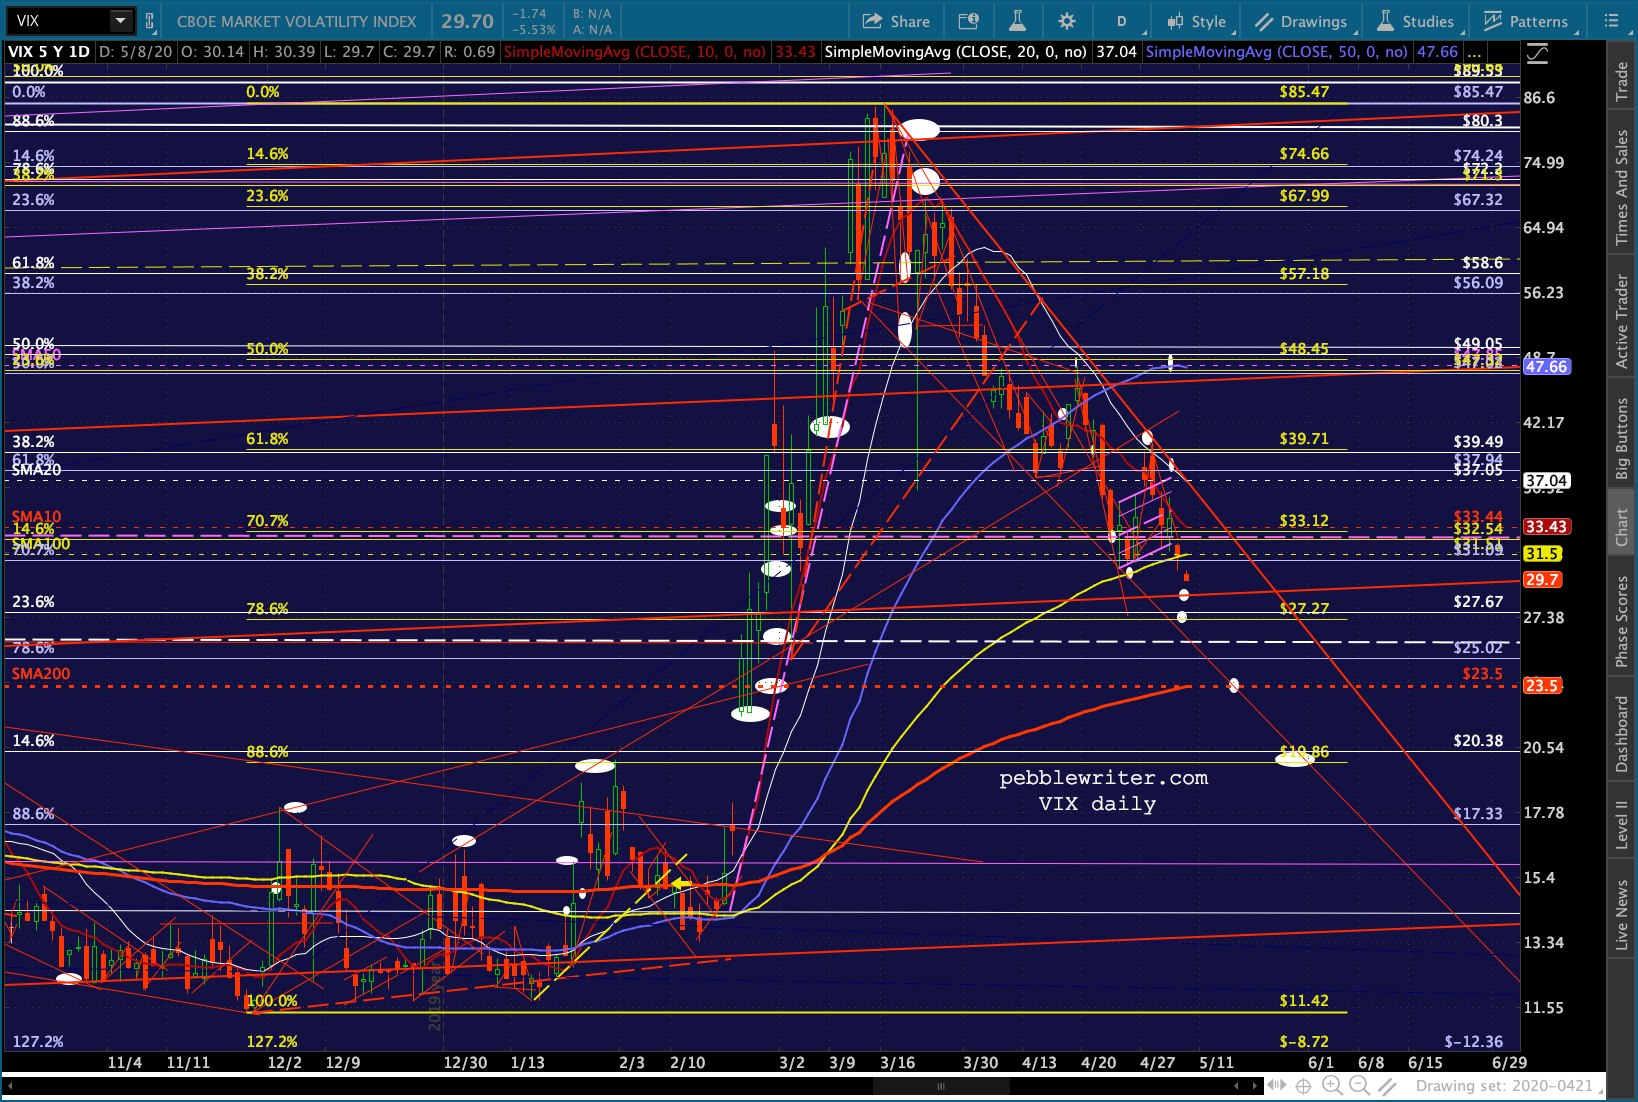
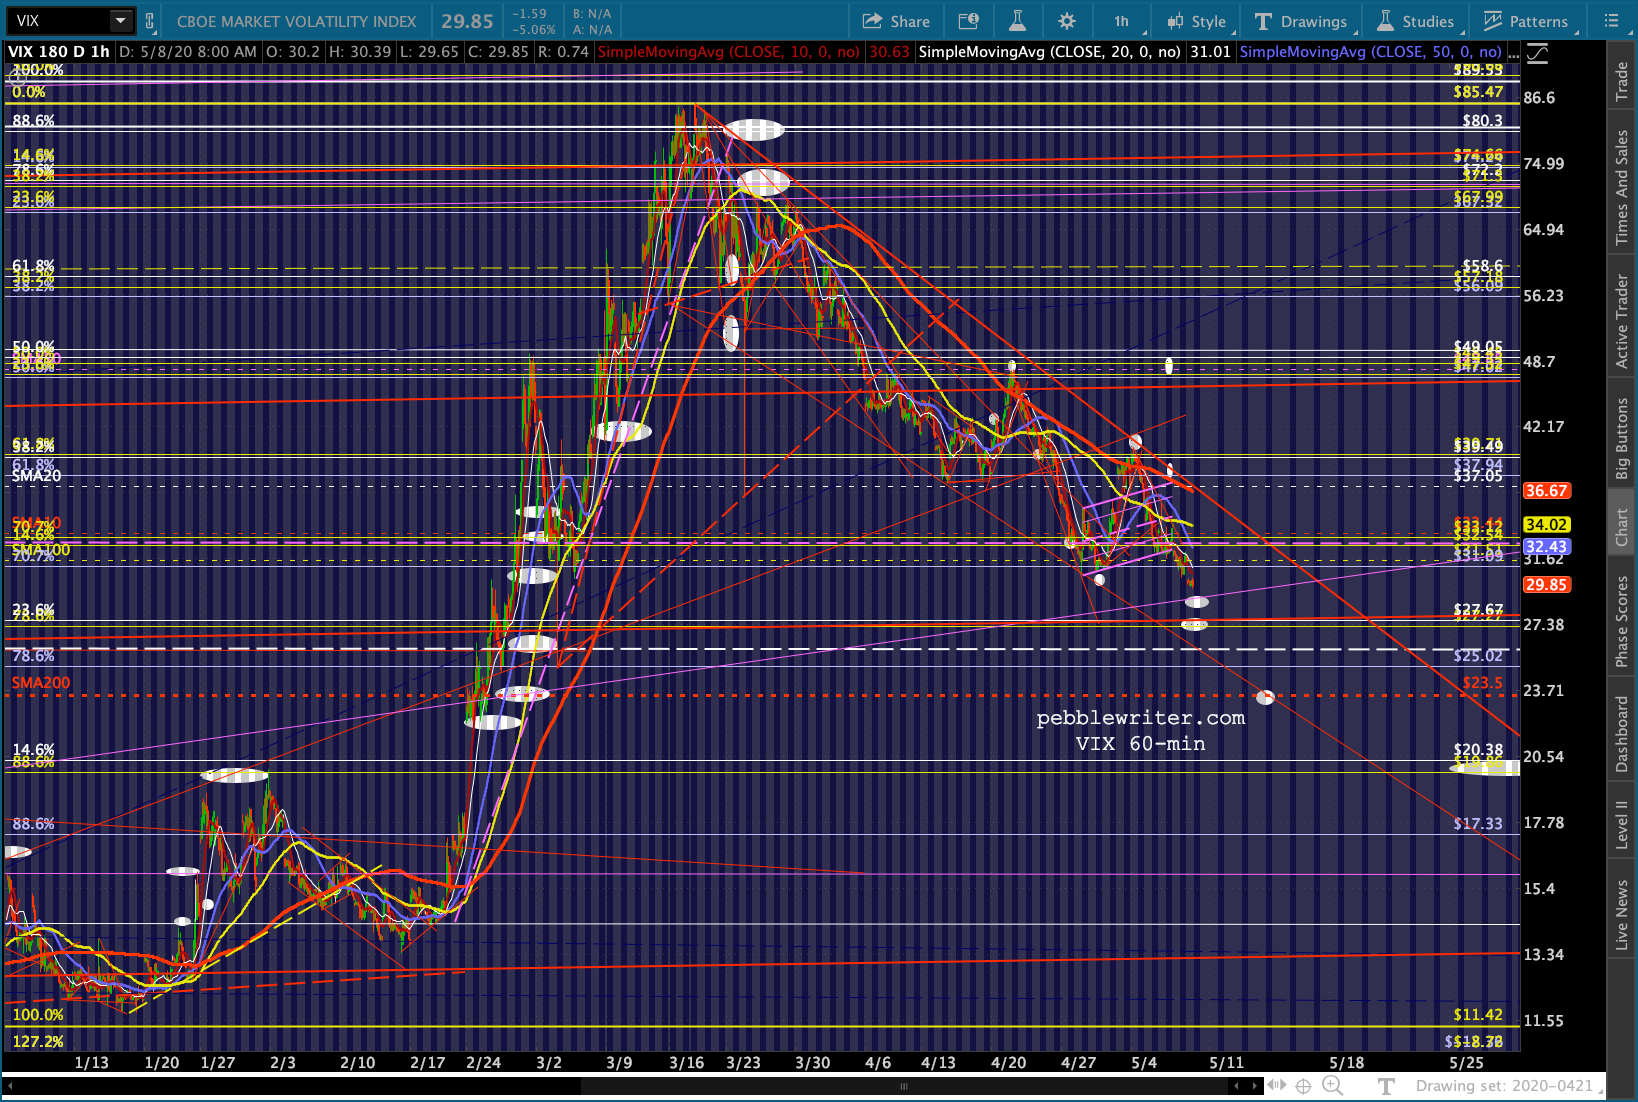
The bigger picture for VIX…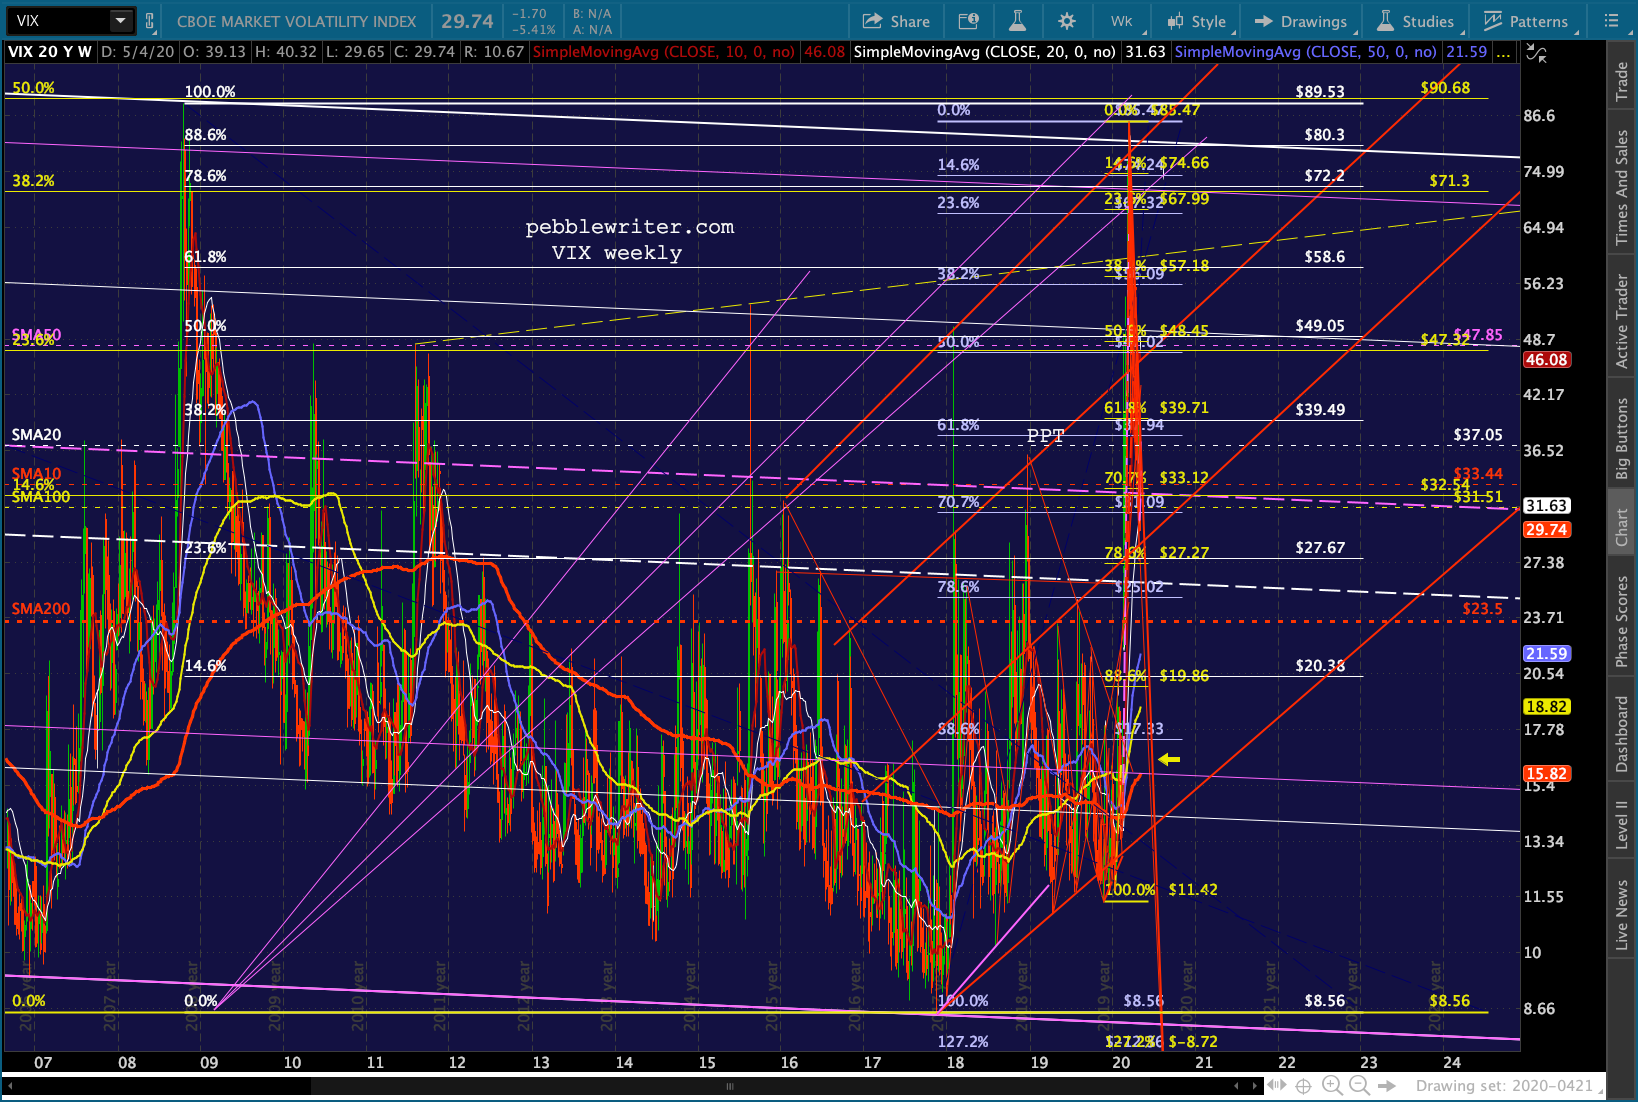
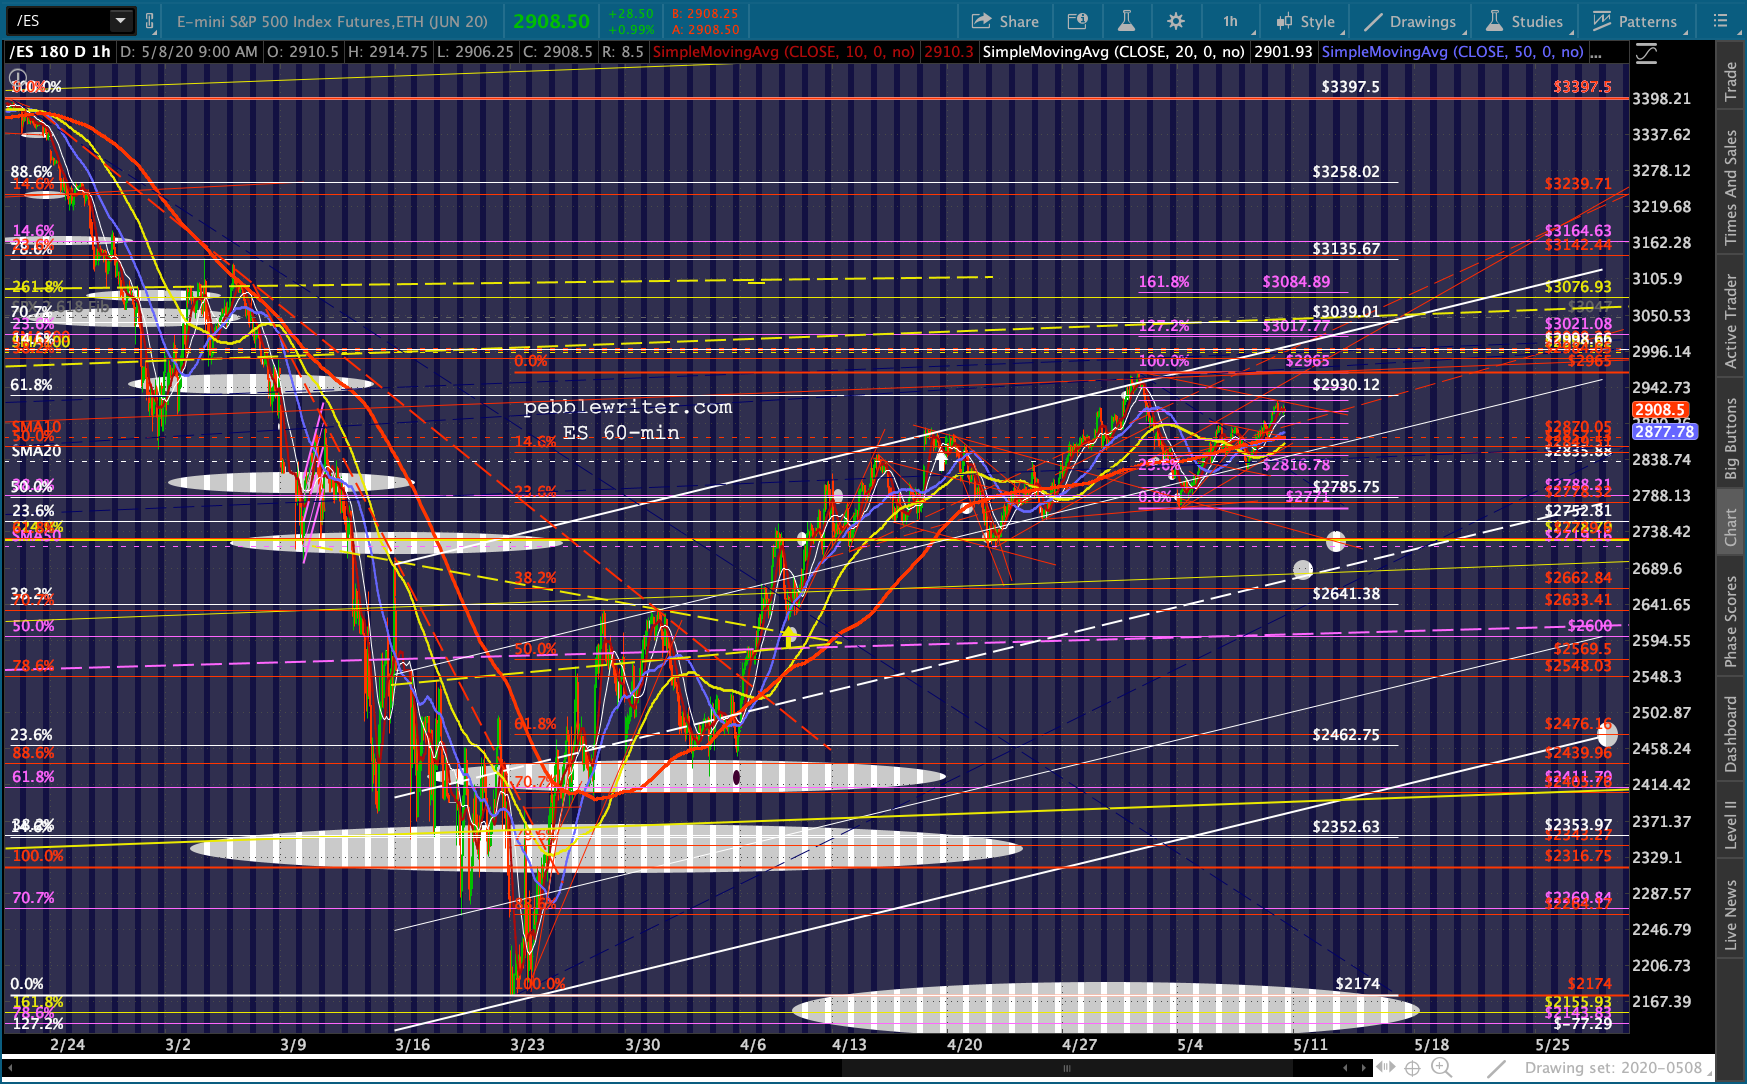
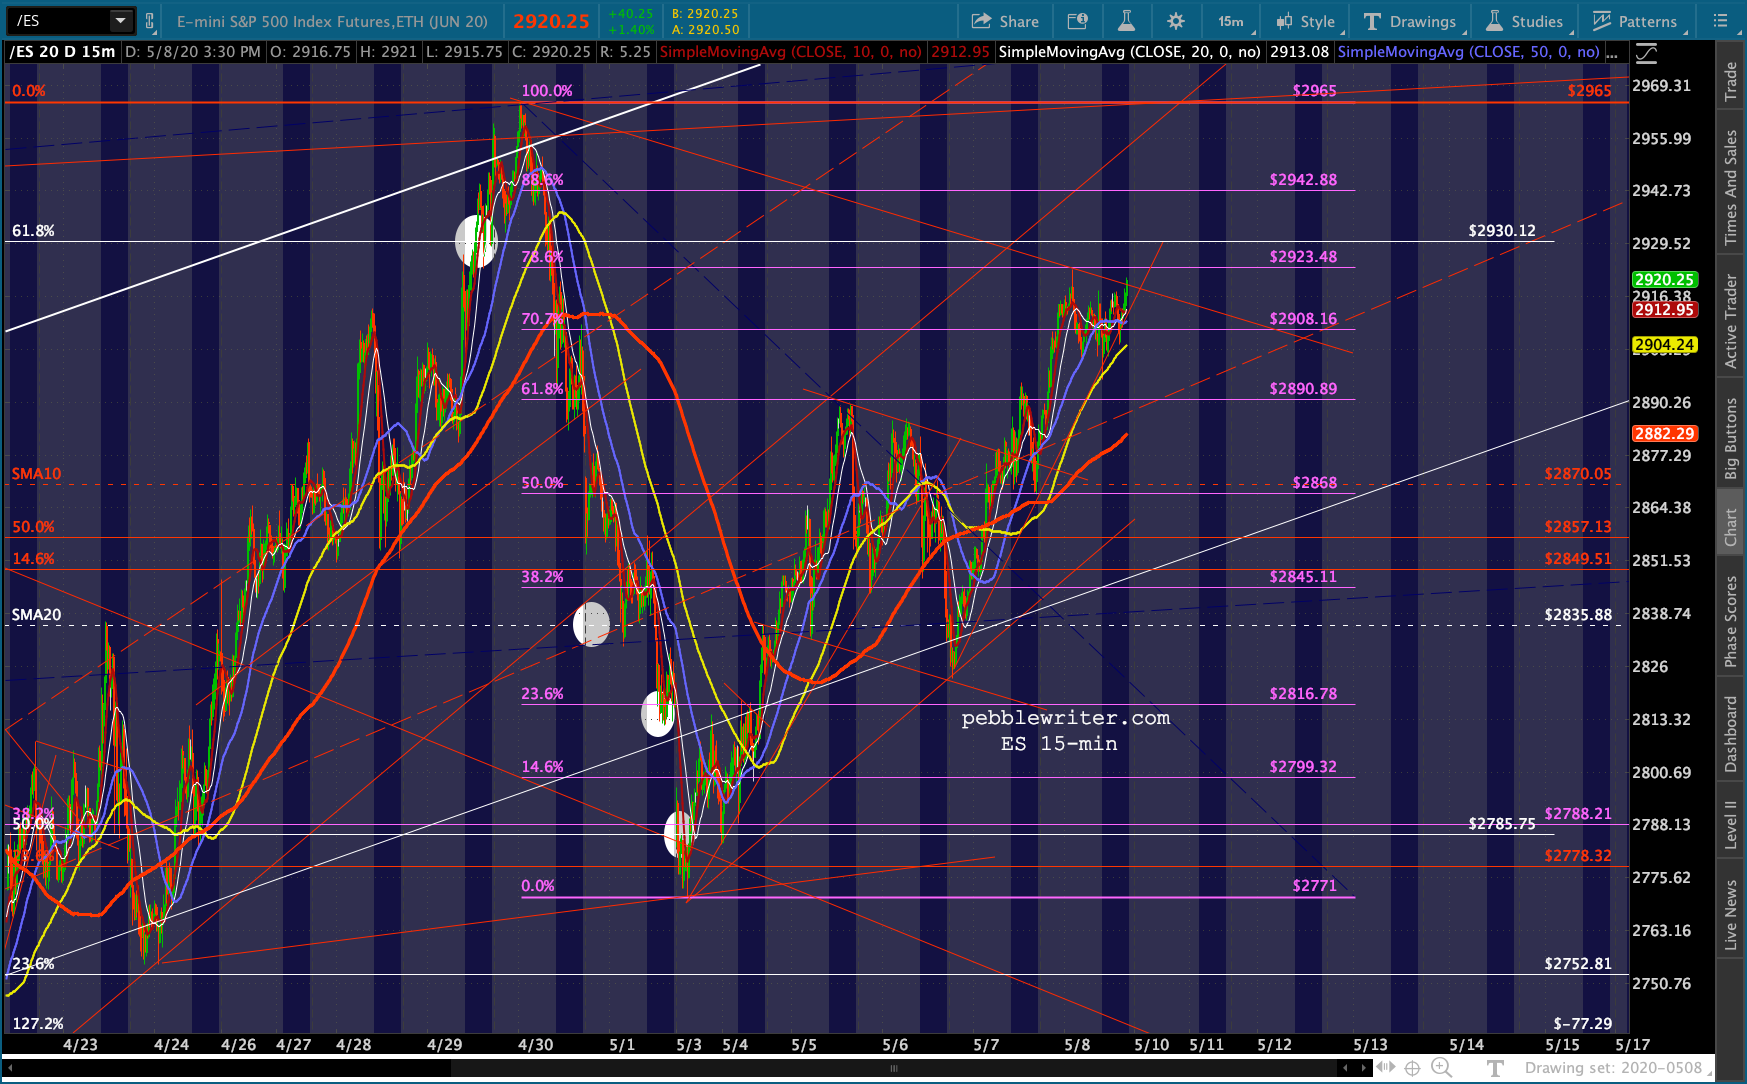
 …and, for equities:
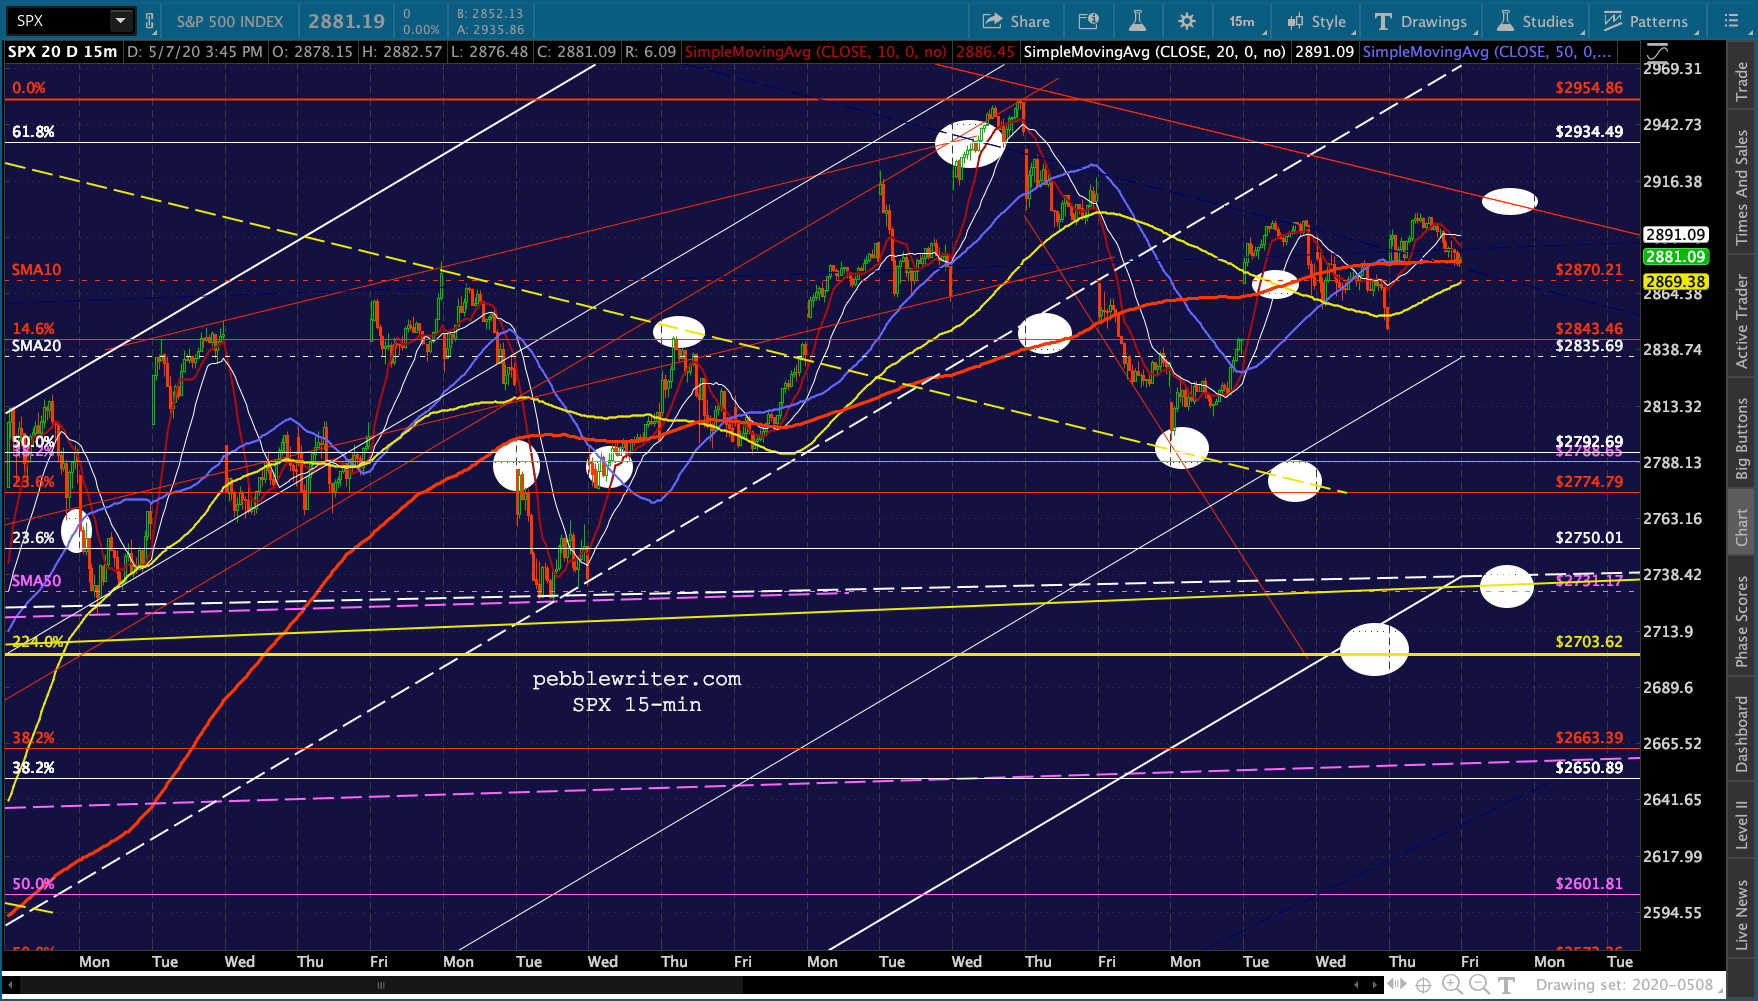
Note that ES has completed a Gartley Pattern (purple) on the heels of its reversal at the white .618.
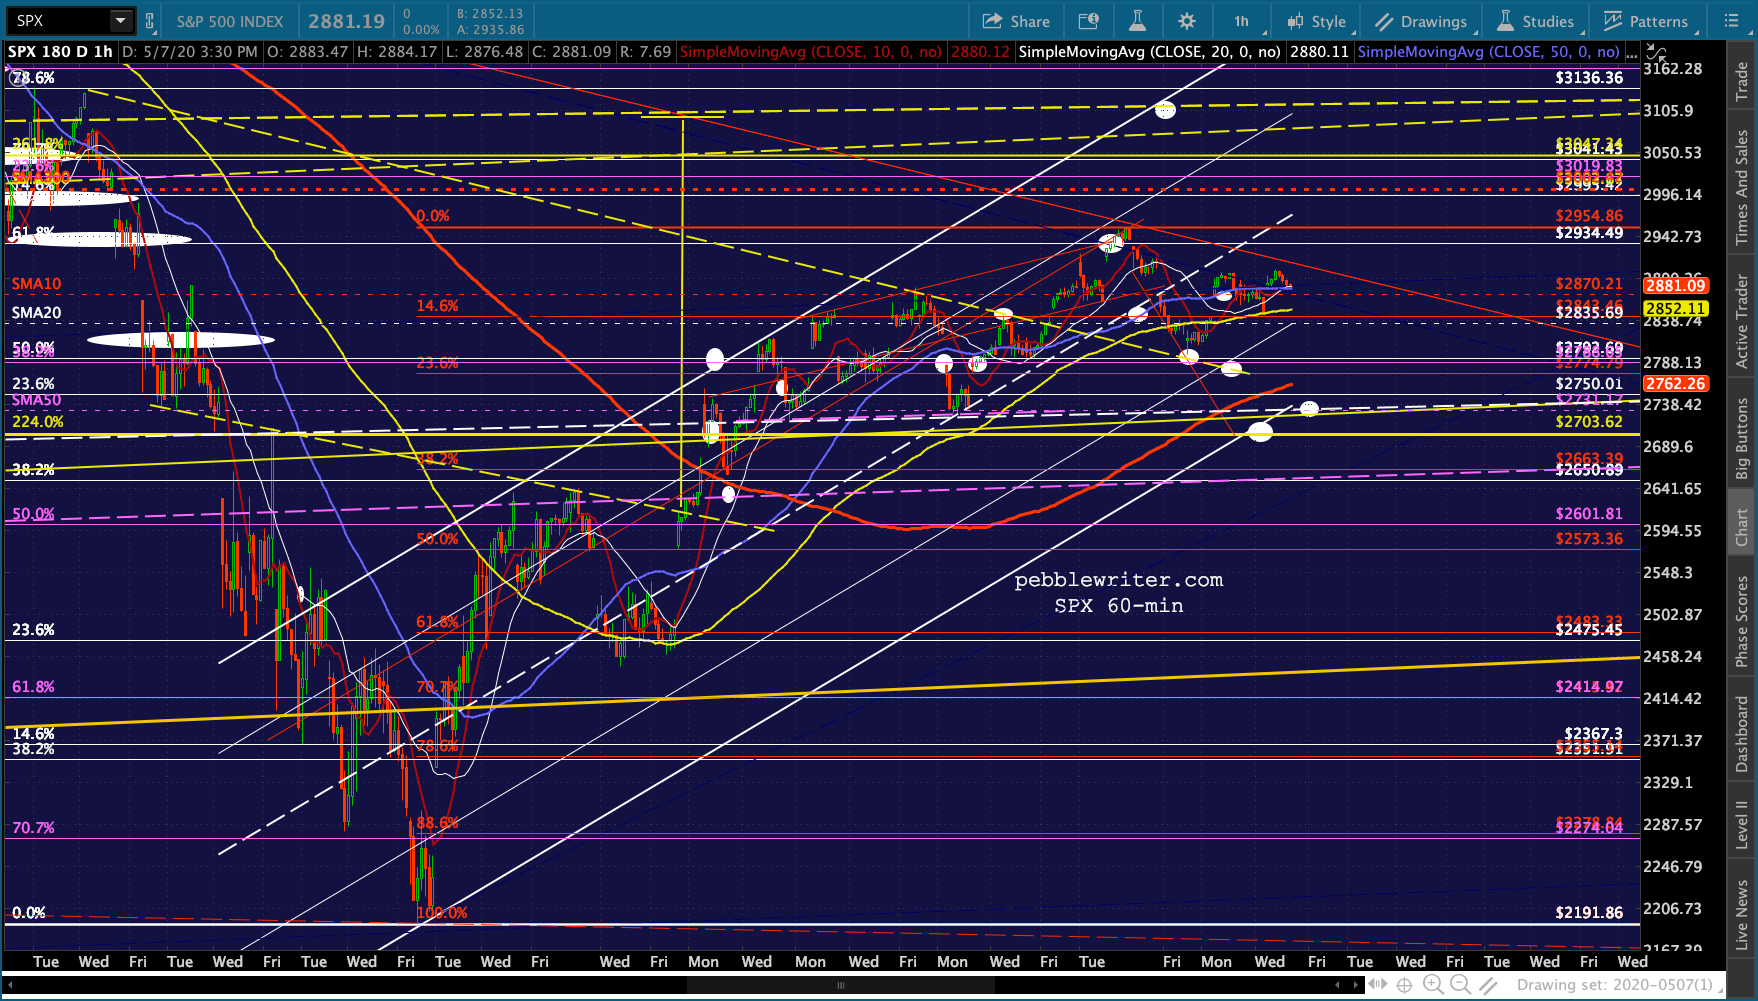
 As SPX’s chart shows, bears are almost out of time to reach 2703 unless the rising white channel is to break down.
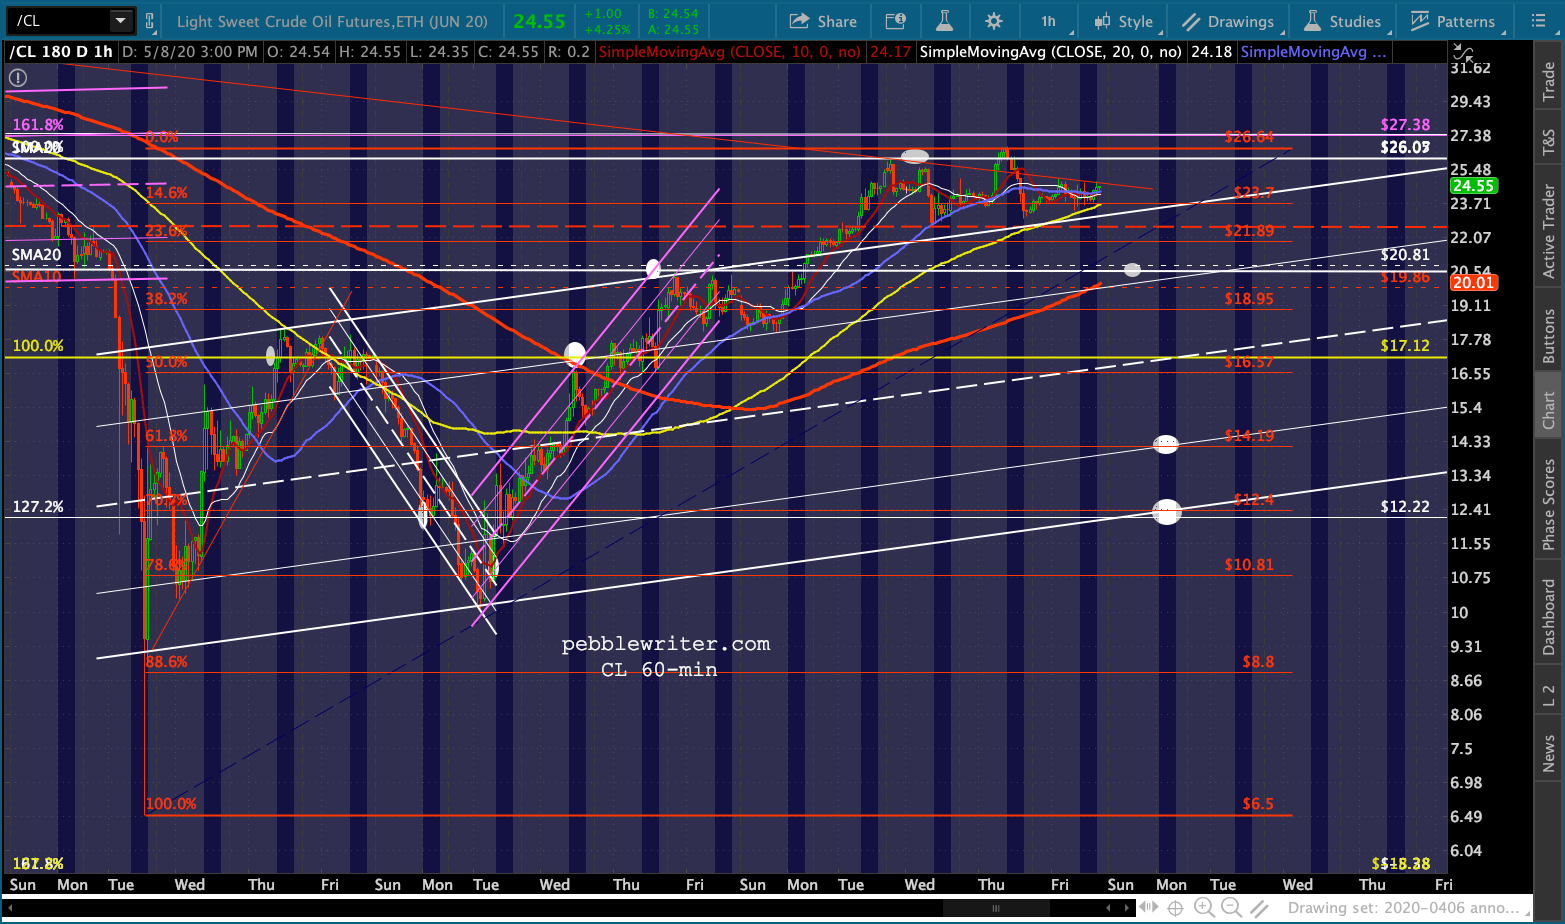
 CL and RB rallied overnight, but are still off their recent highs and should go lower.
 And, USDJPY is rallying, but running into its SMA10.
 While EURUSD continues to tread water…
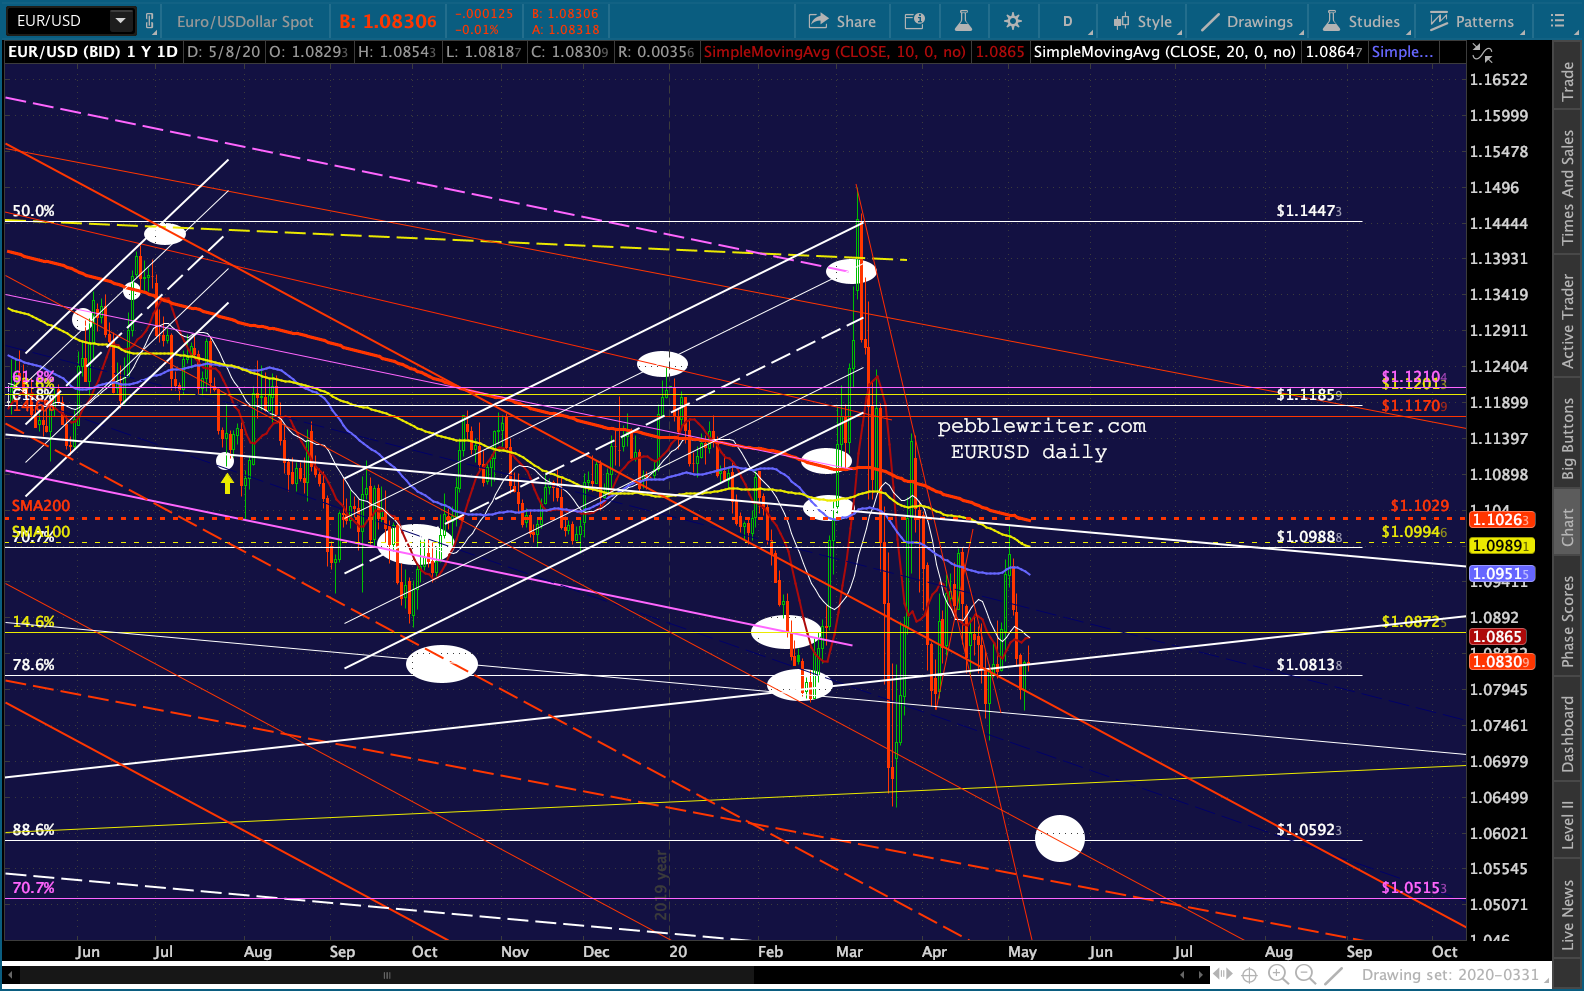 …enabling DXY to avoid a breakout.
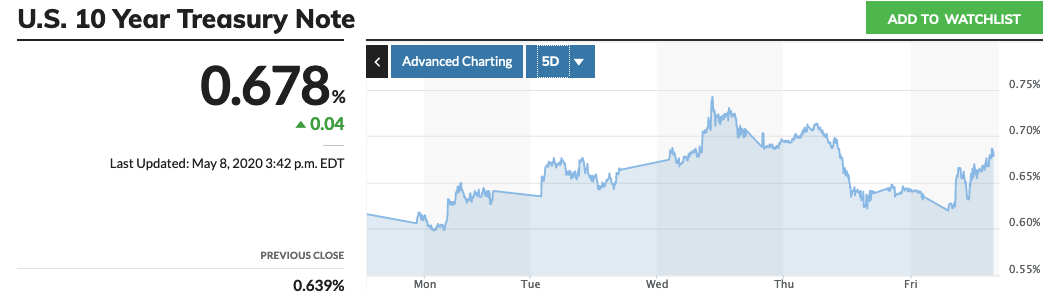
  Our yield curve model continues to suggest more downside for stocks. The 10Y is slipping higher again…
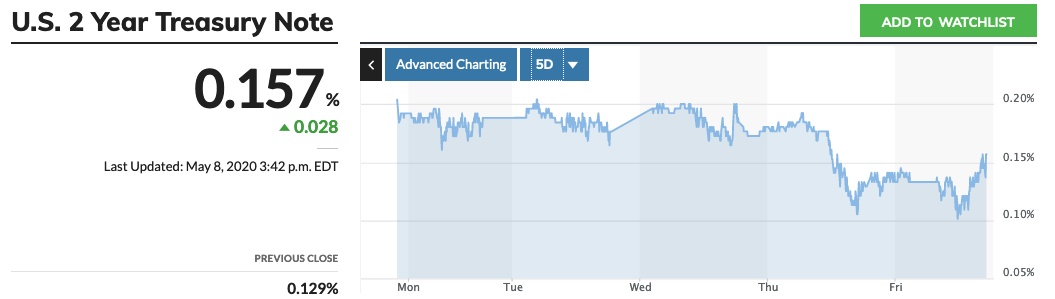
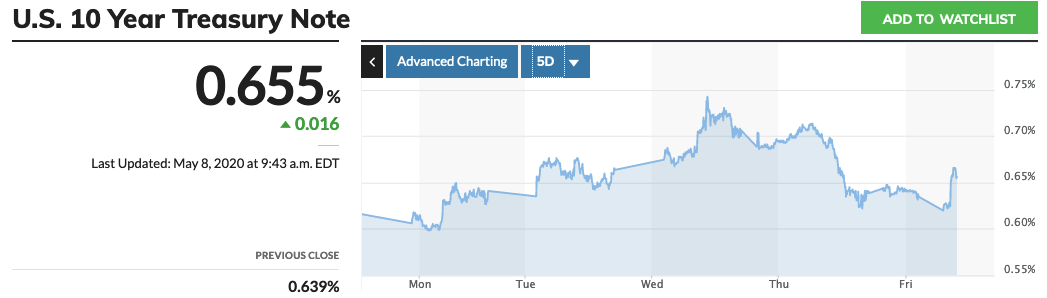 …while the 2Y dropped far below the 17 bps support, reaching as low as 10.5 bps yesterday.
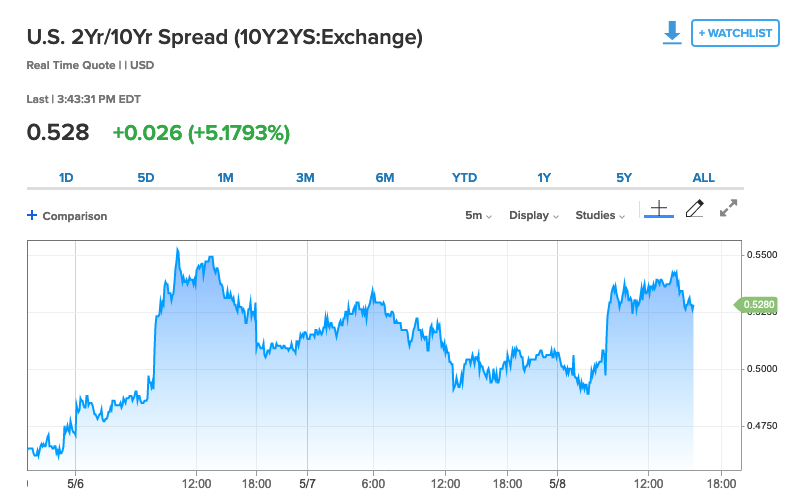
 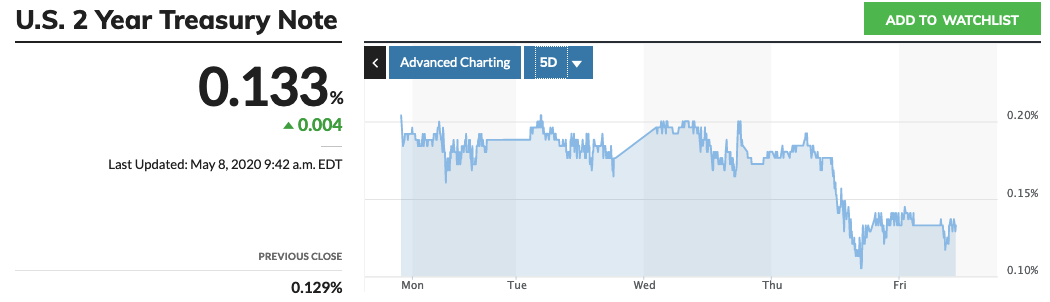 This puts the 2s10s back above 52 bps.
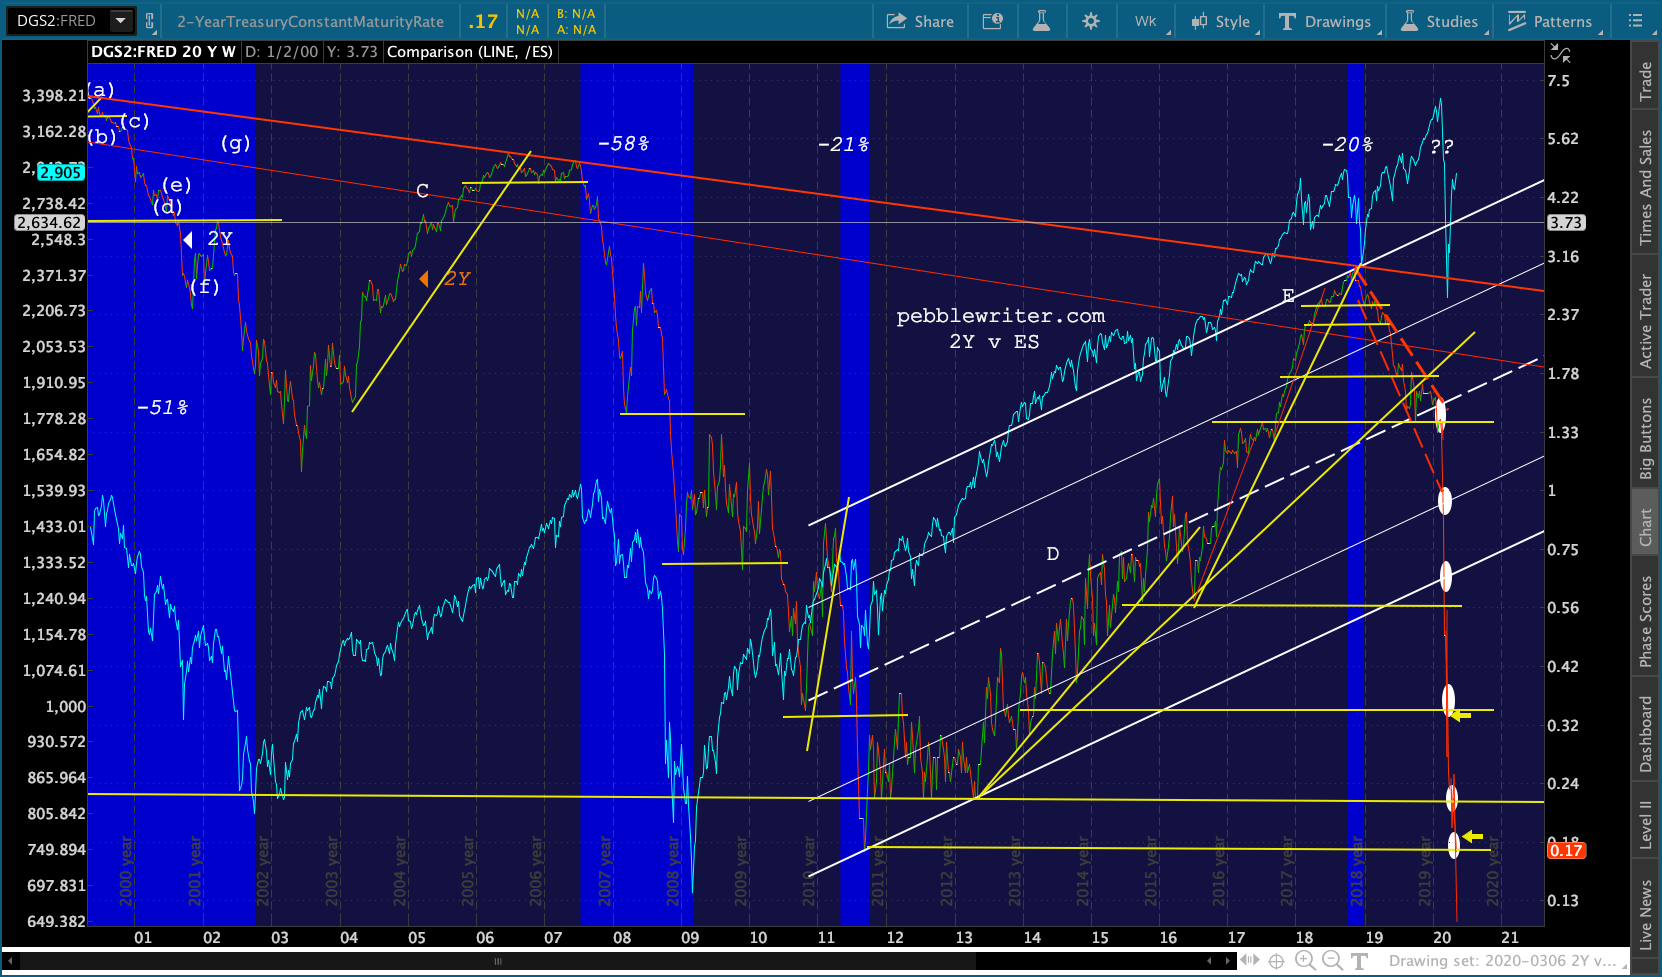
 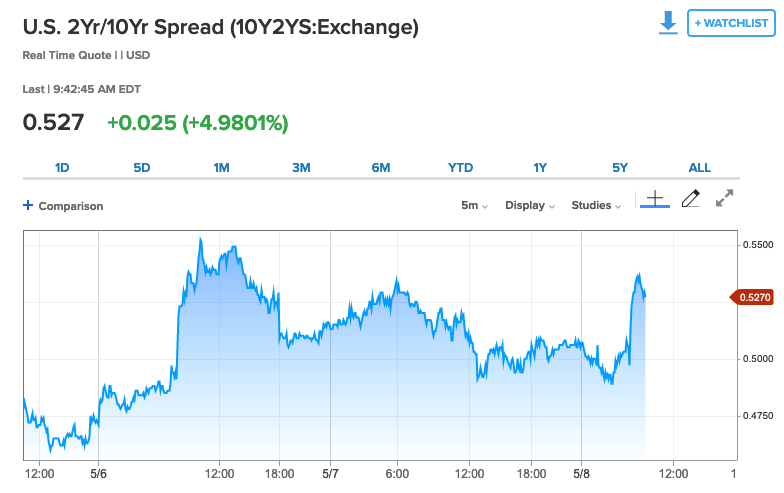 Converting to our daily charts…
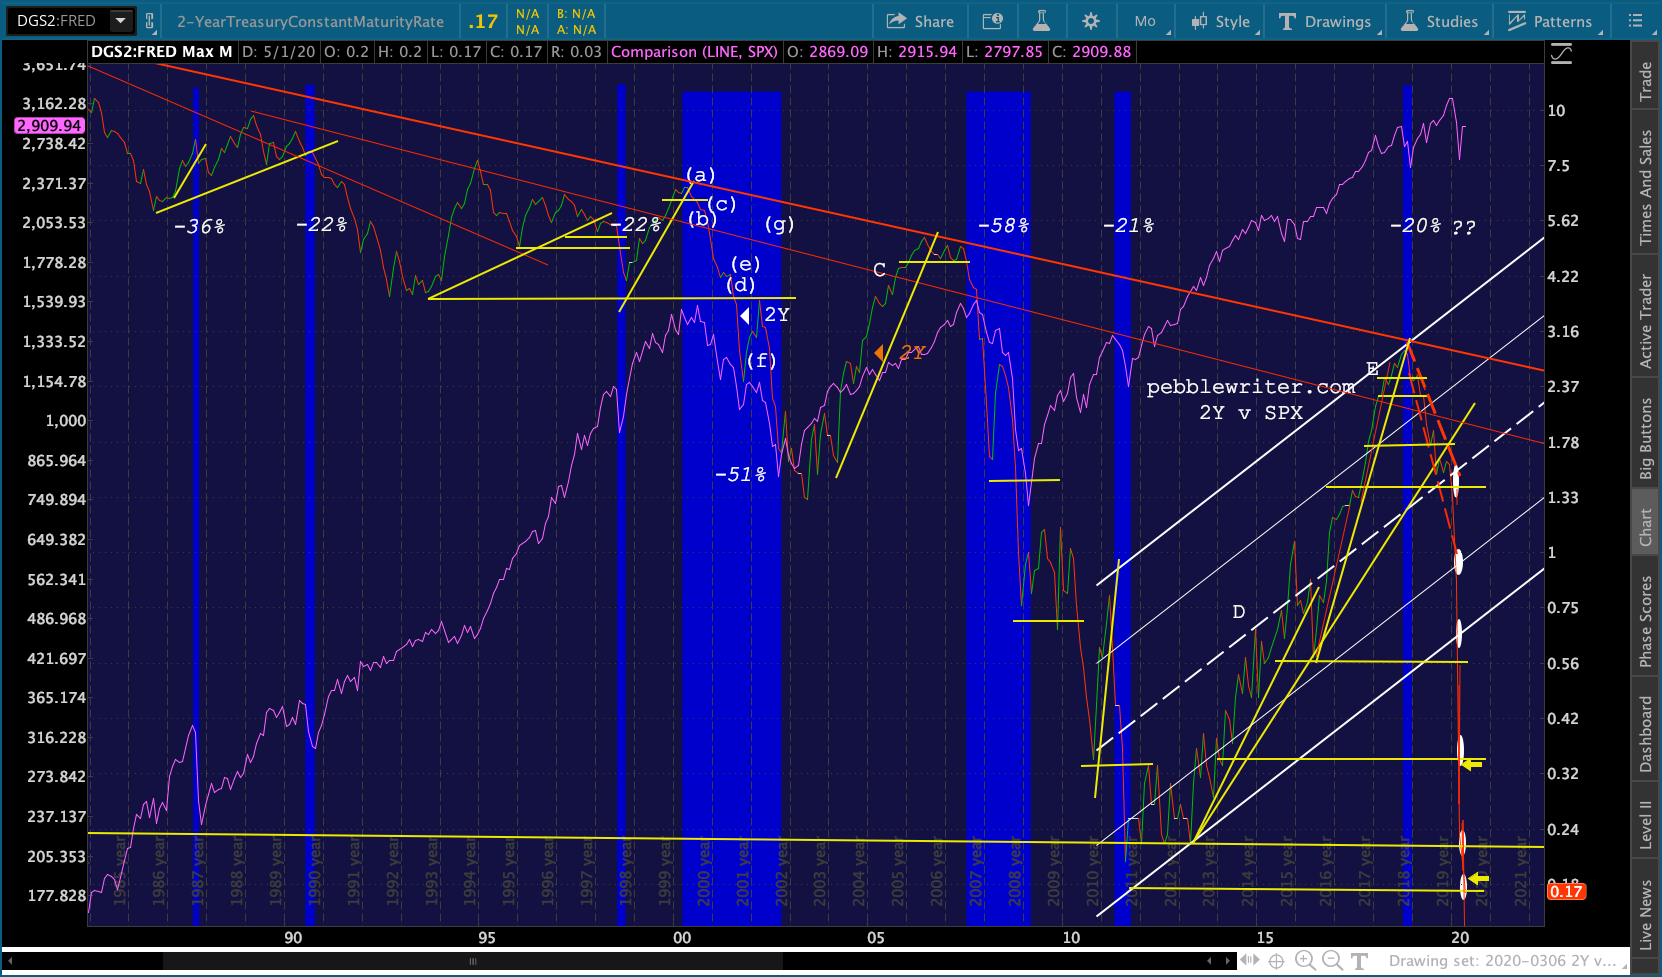
Since 1986, the 2Y has never broken down through major TL or horizontal support without an accompanying major decline in SPX. It just broke below its all-time lows.
 And, the 2s10s remains in breakout mode.
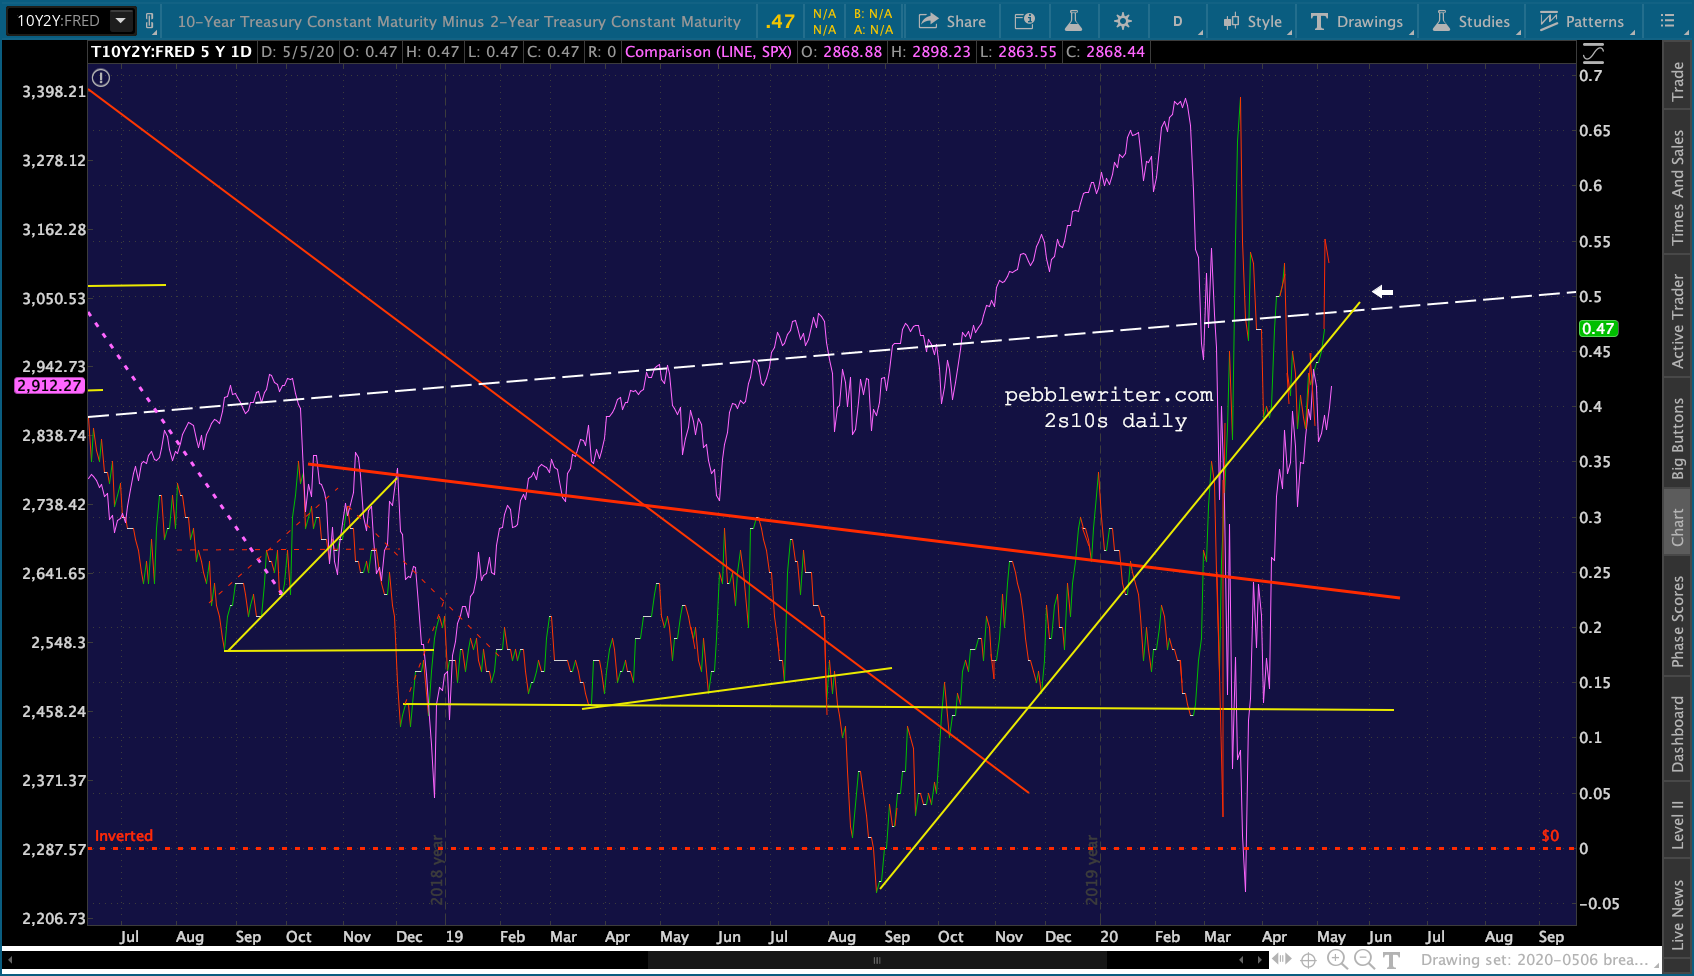 As we’ve discussed many times, this is a strong signal of a breakdown in stocks.
 Obviously we’ve never before seen the level of central bank support currently being thrown at the markets. But, if the past 35 years of relationships still means anything, we should see additional downside.
UPDATE: 3:40 PM
The bond market is still suggesting downside, but you’d never guess it from ES/SPX, which have been inching higher all session…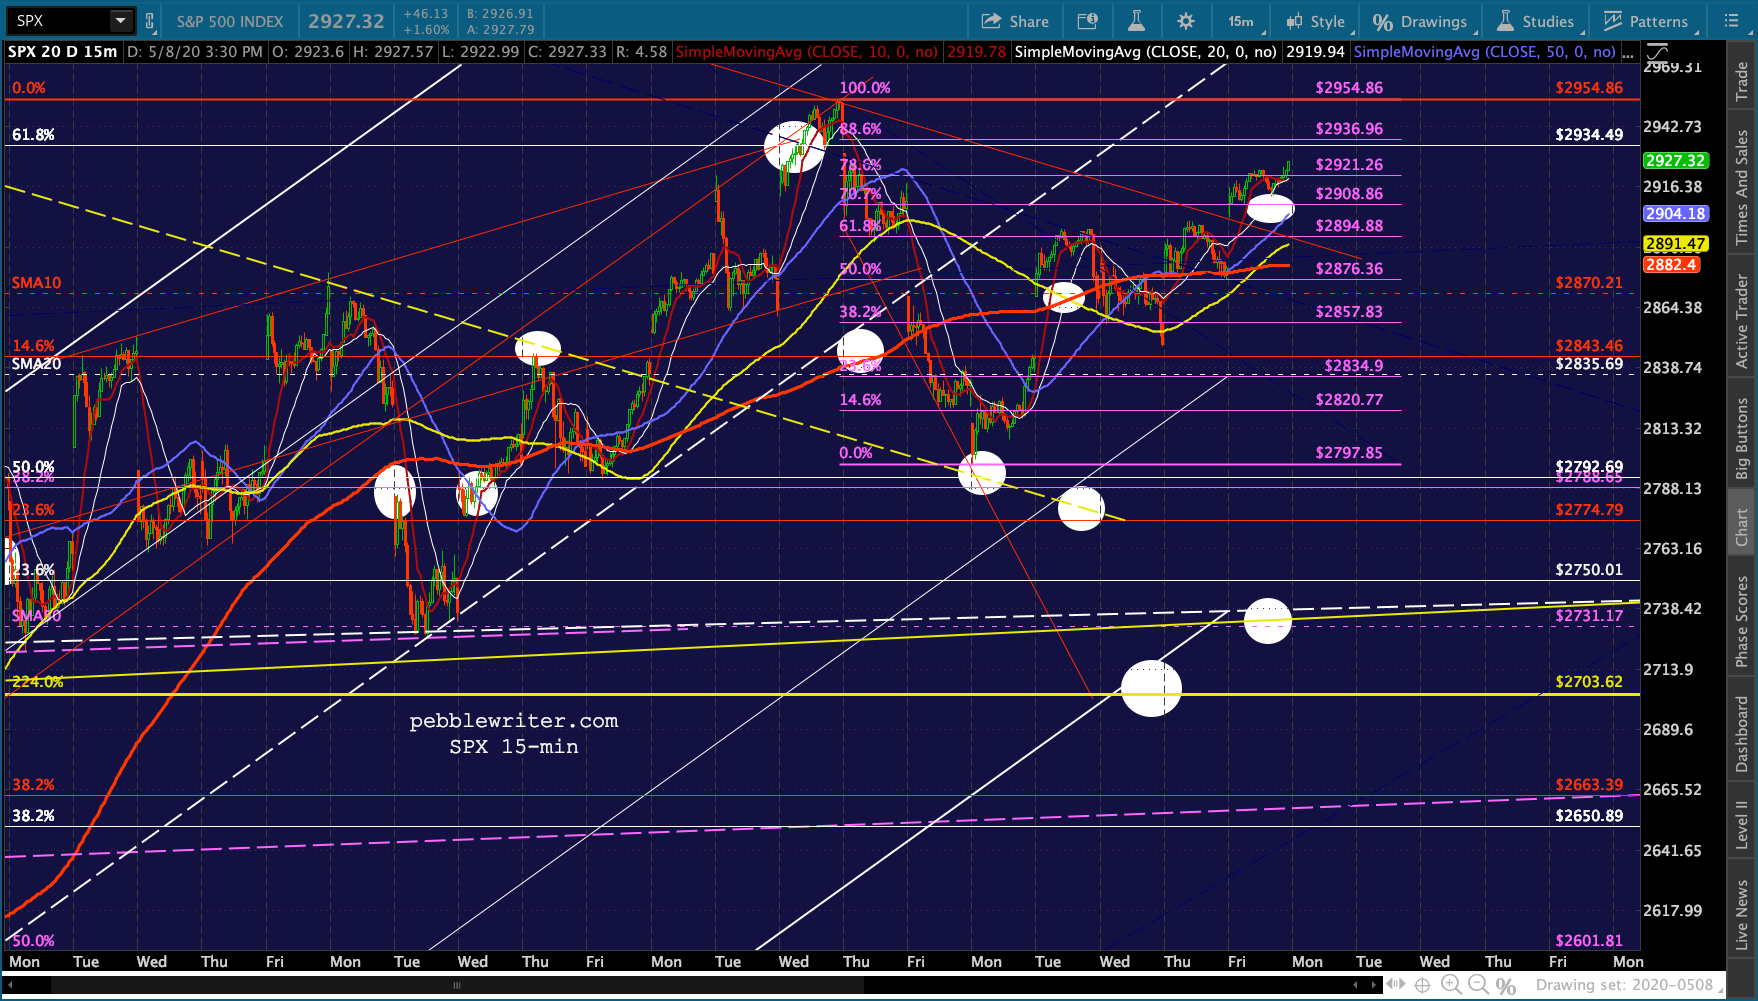
 …still based largely on VIX’s now 10% decline…
 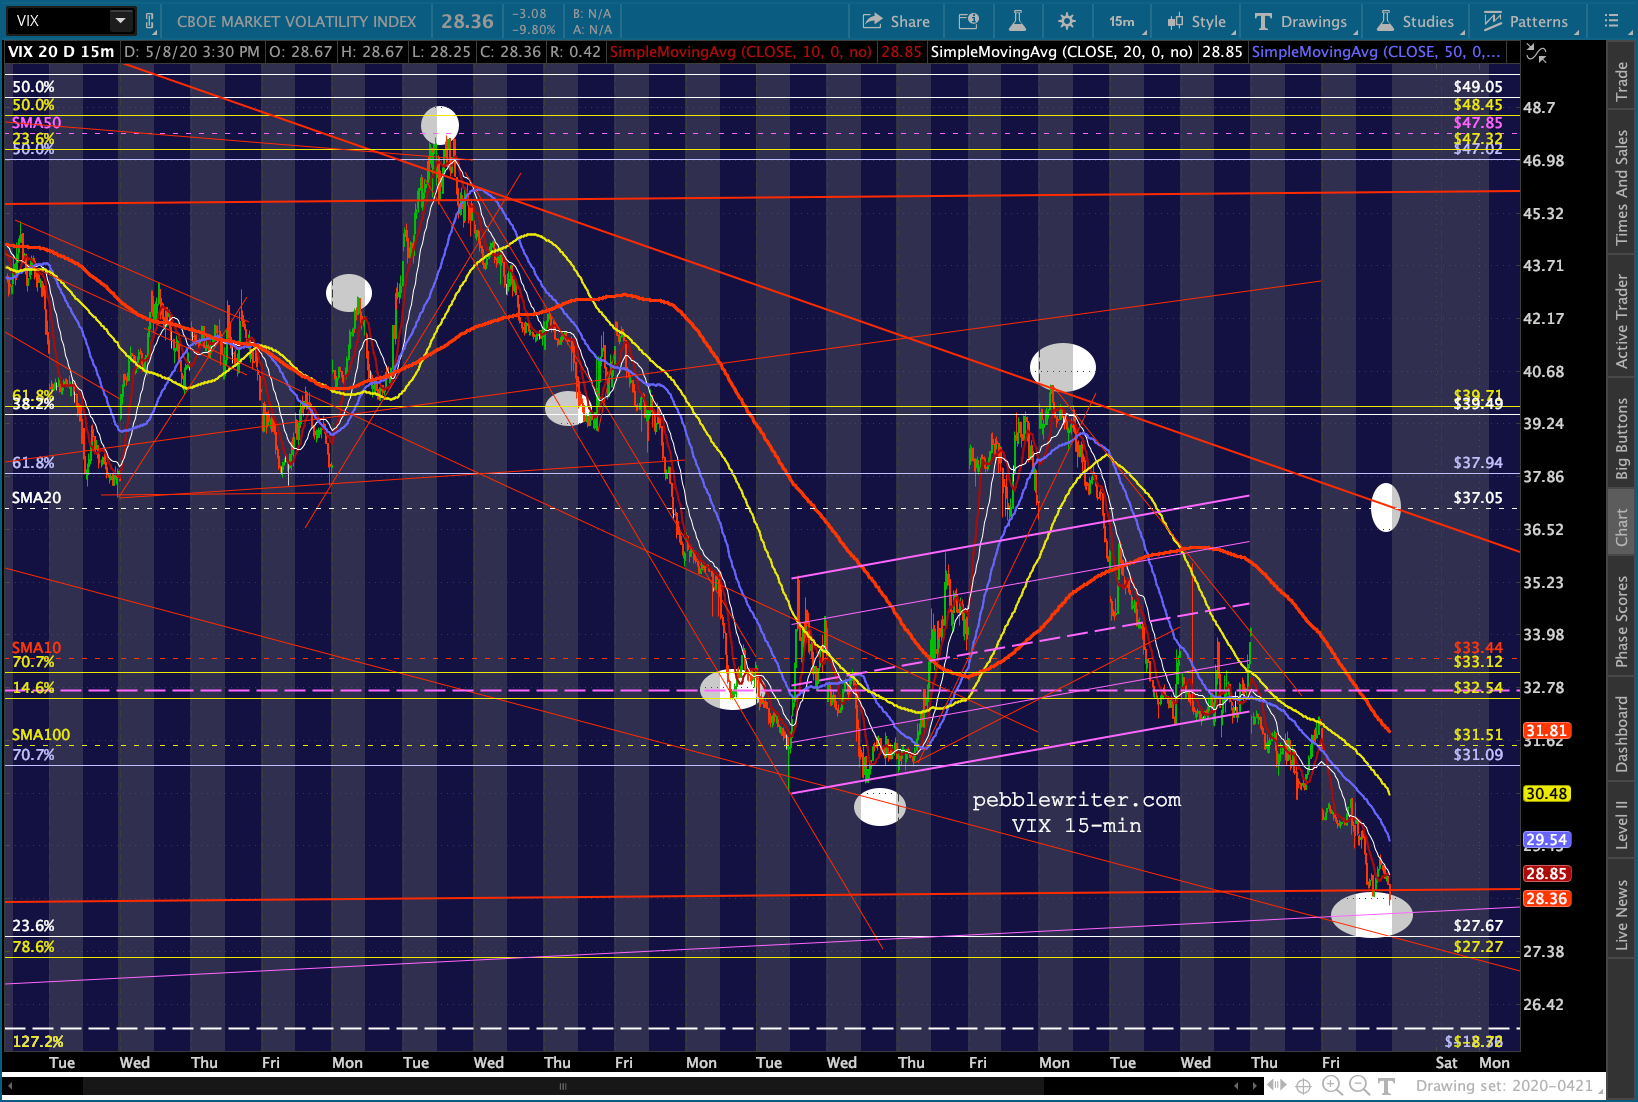 …and bumps higher by CL and RB…
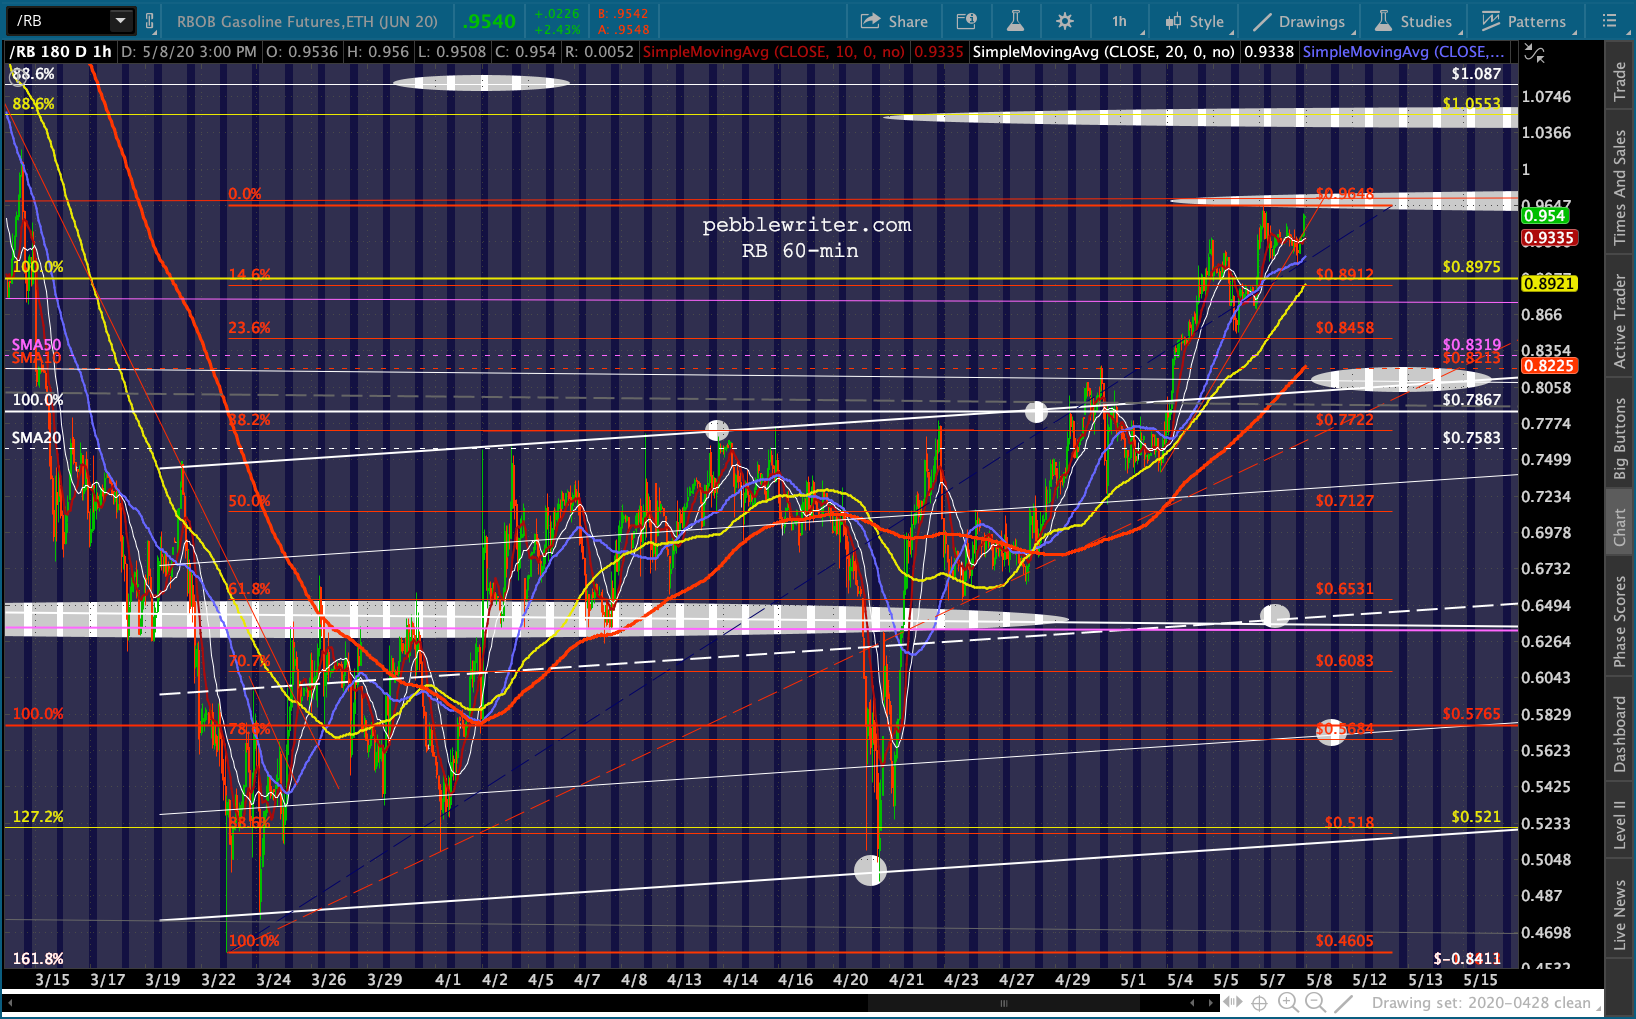
 and a push slightly above its SMA10 by USDJPY.
  In fact, everything is looking peachy – except bonds. The 2s10s is still elevated as both the 2Y and 10Y are easing higher.
 I hate being bearish going into the weekend, but I have more faith in the yield curve model and the 2Y model than I do an algo-driven meltup.
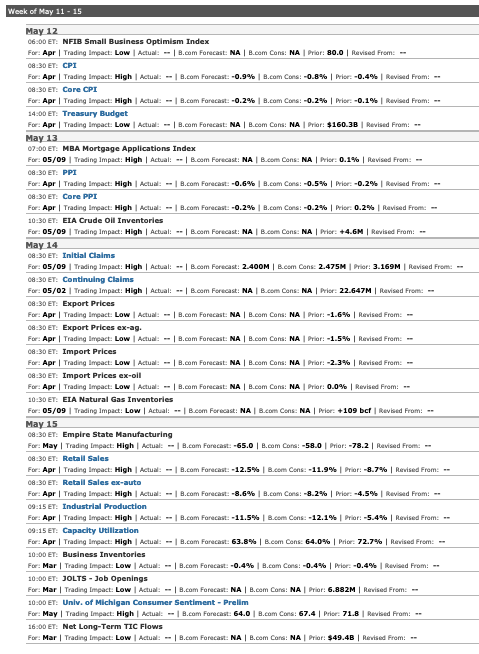
There’s a lot of economic data coming out next week starting with the important CPI read and treasury blowout on Monday.