

Futures are off sharply, eyeing a bevy of gaps and Fib levels left in the wake of last week’s nonsensical algo-driven ramp.
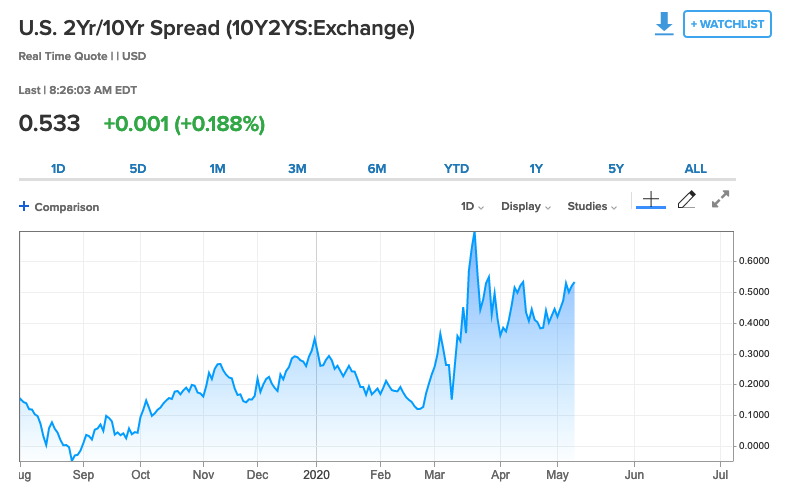
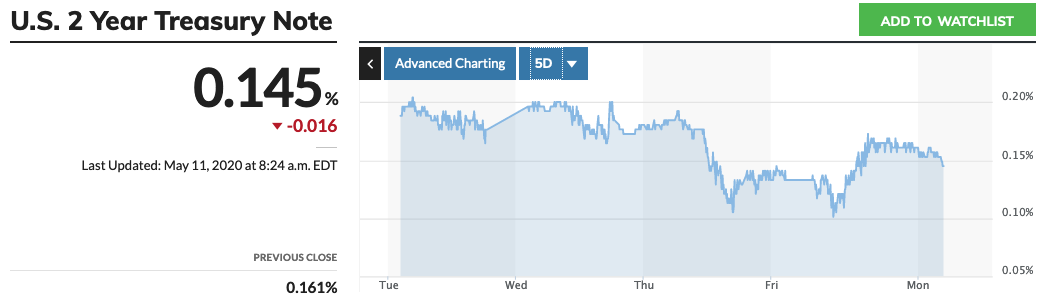
Our yield curve models swung bearish last week, as did a number of other sentiment-based indicators. Perhaps the most compelling is the 2Y, which plunged below critical support at 17 bps, testing 10 bps before bouncing.
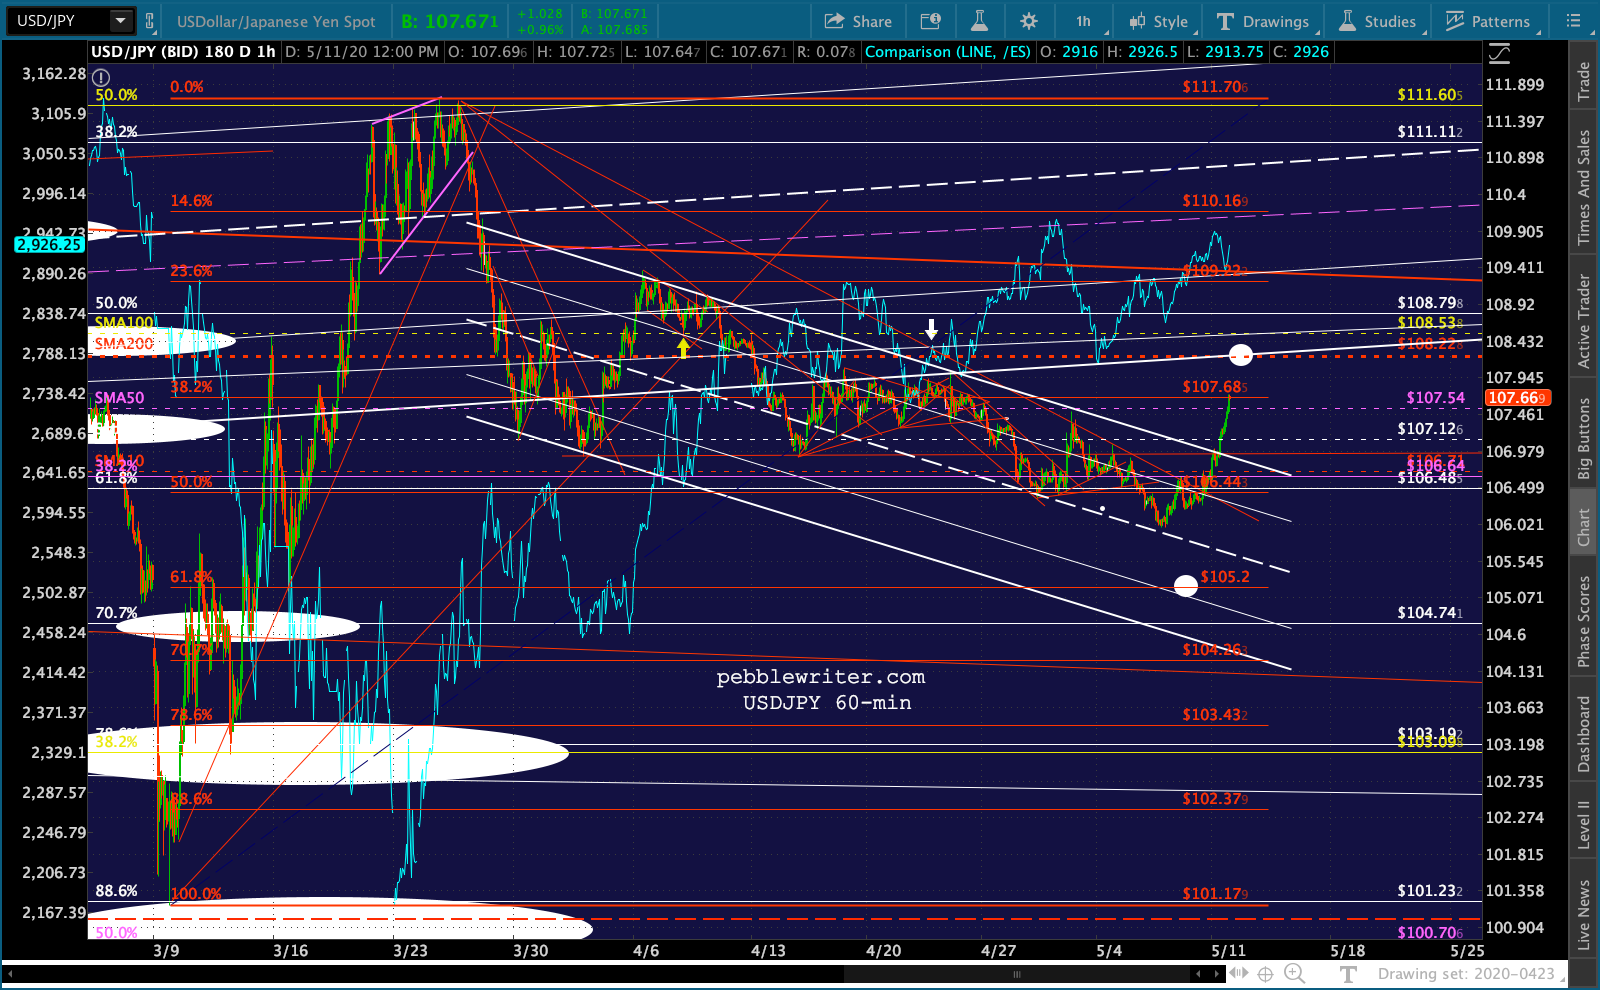
 The 2s10s is currently confirming, though CL and USDJPY are swinging into action in an effort to stave off a significant downturn. Under ordinary circumstances, a breakout in USDJPY would prop up stocks. But, current circumstances are anything but ordinary.
 continued for members…
Remember, it was the failure of USDJPY’s breakout above the red channel top on Feb 27 which provided a strong sell signal for stocks.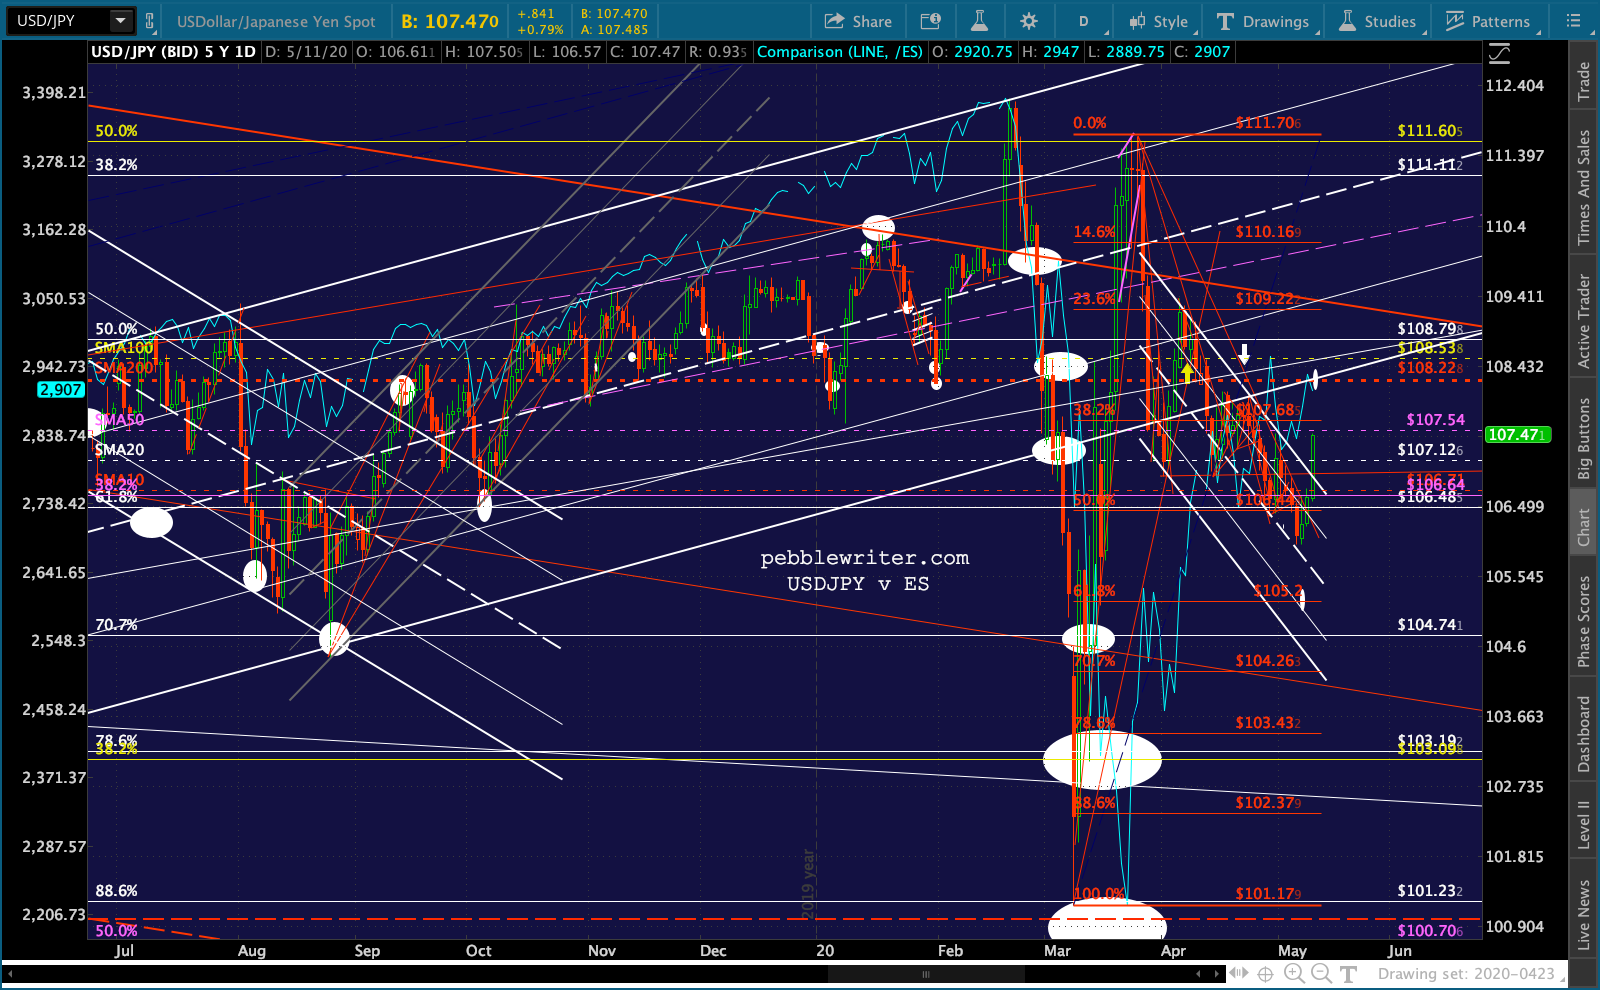 The second breakout which began on Mar 19 provided an early warning of SPX’s bottom on Mar 23. It has since failed again, gradually declining to the point where a rise to the SMA200 at 108.228 would constitute a backtest which, if USDJPY failed, would contribute to equity weakness.
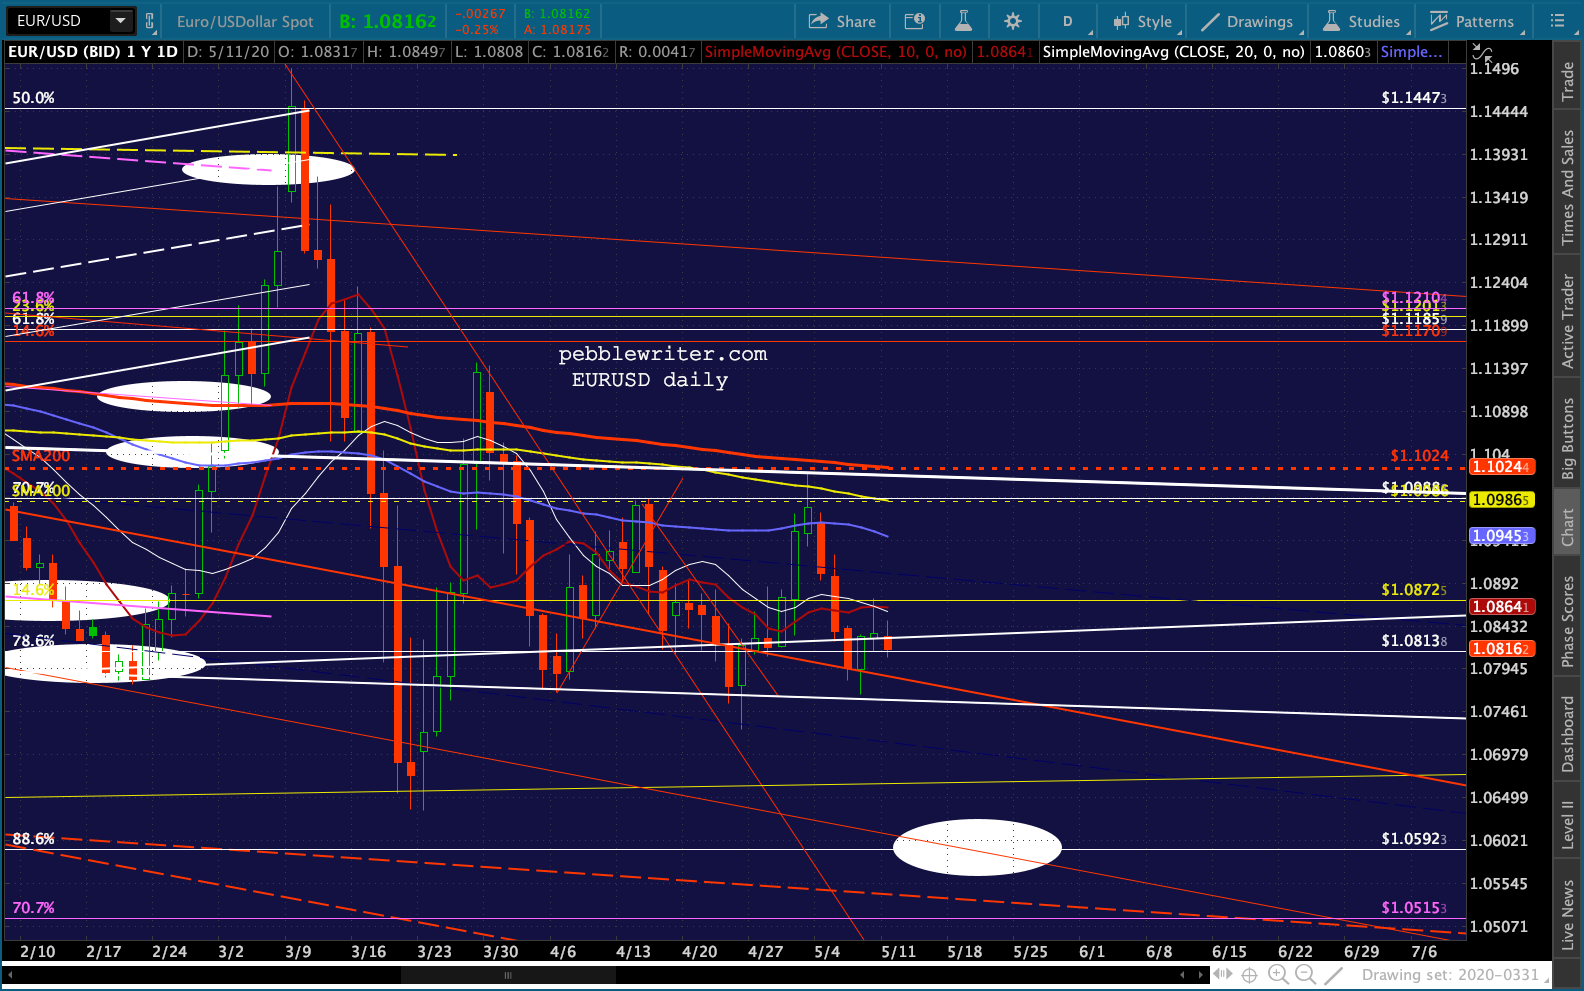
USDJPY is combining with EURUSD to finally force DXY’s breakout.
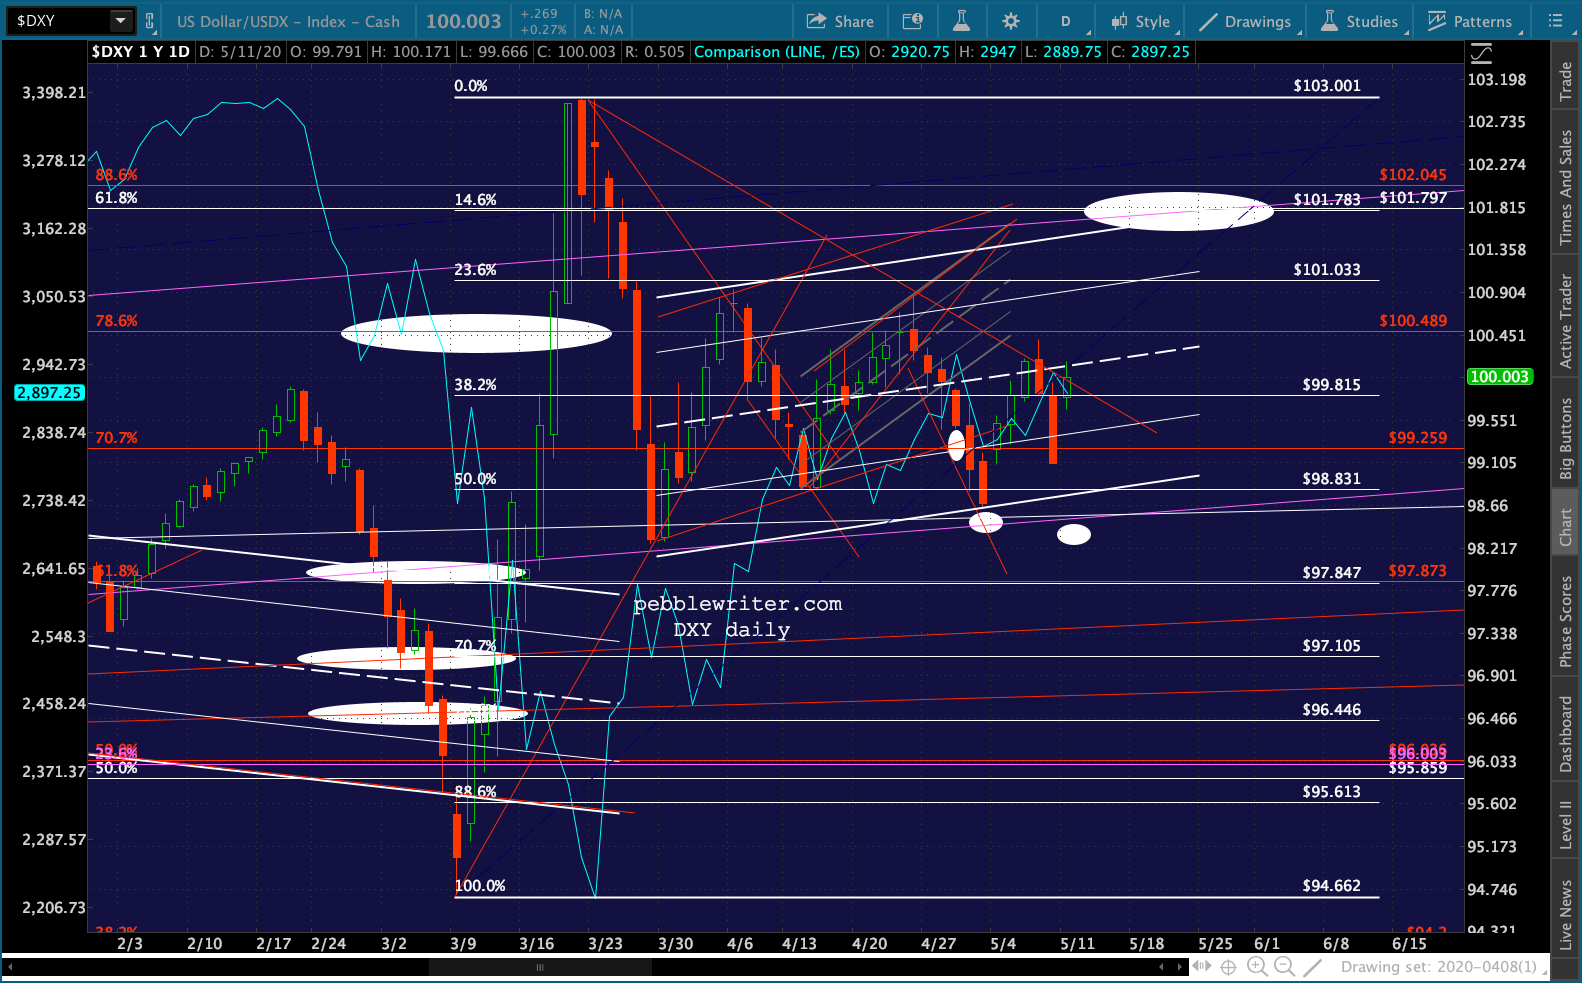
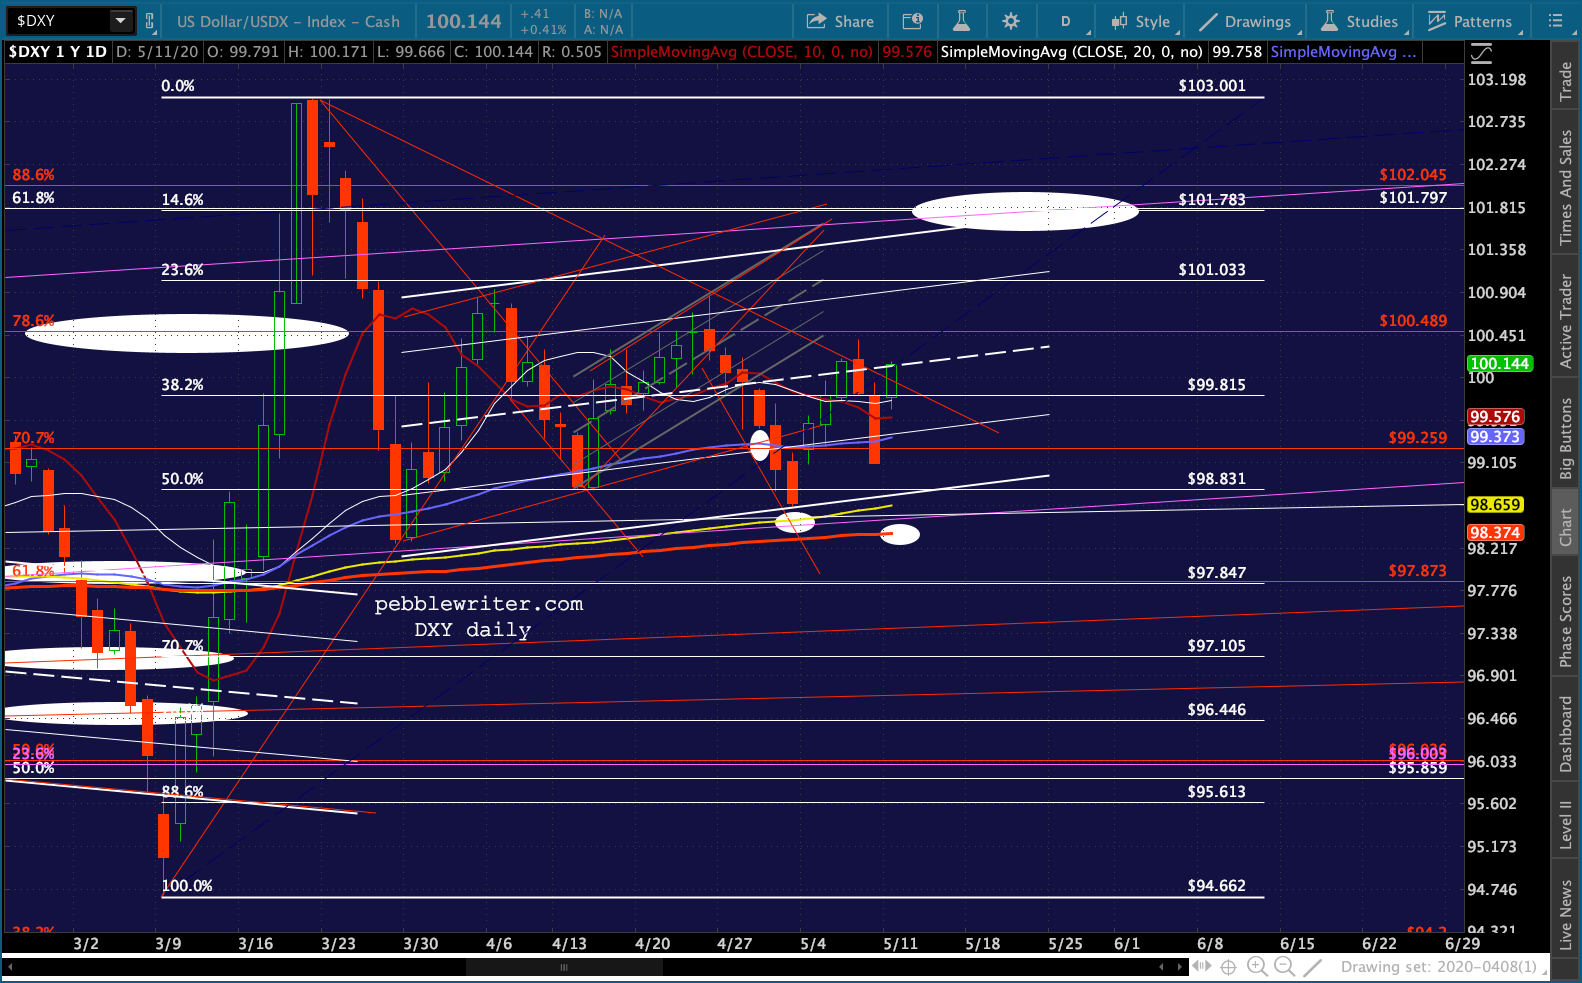 Remember, SPX’s March plunge was also accompanied by a spike/breakout in DXY.
 At the same time, it’s time for ZN to shine…
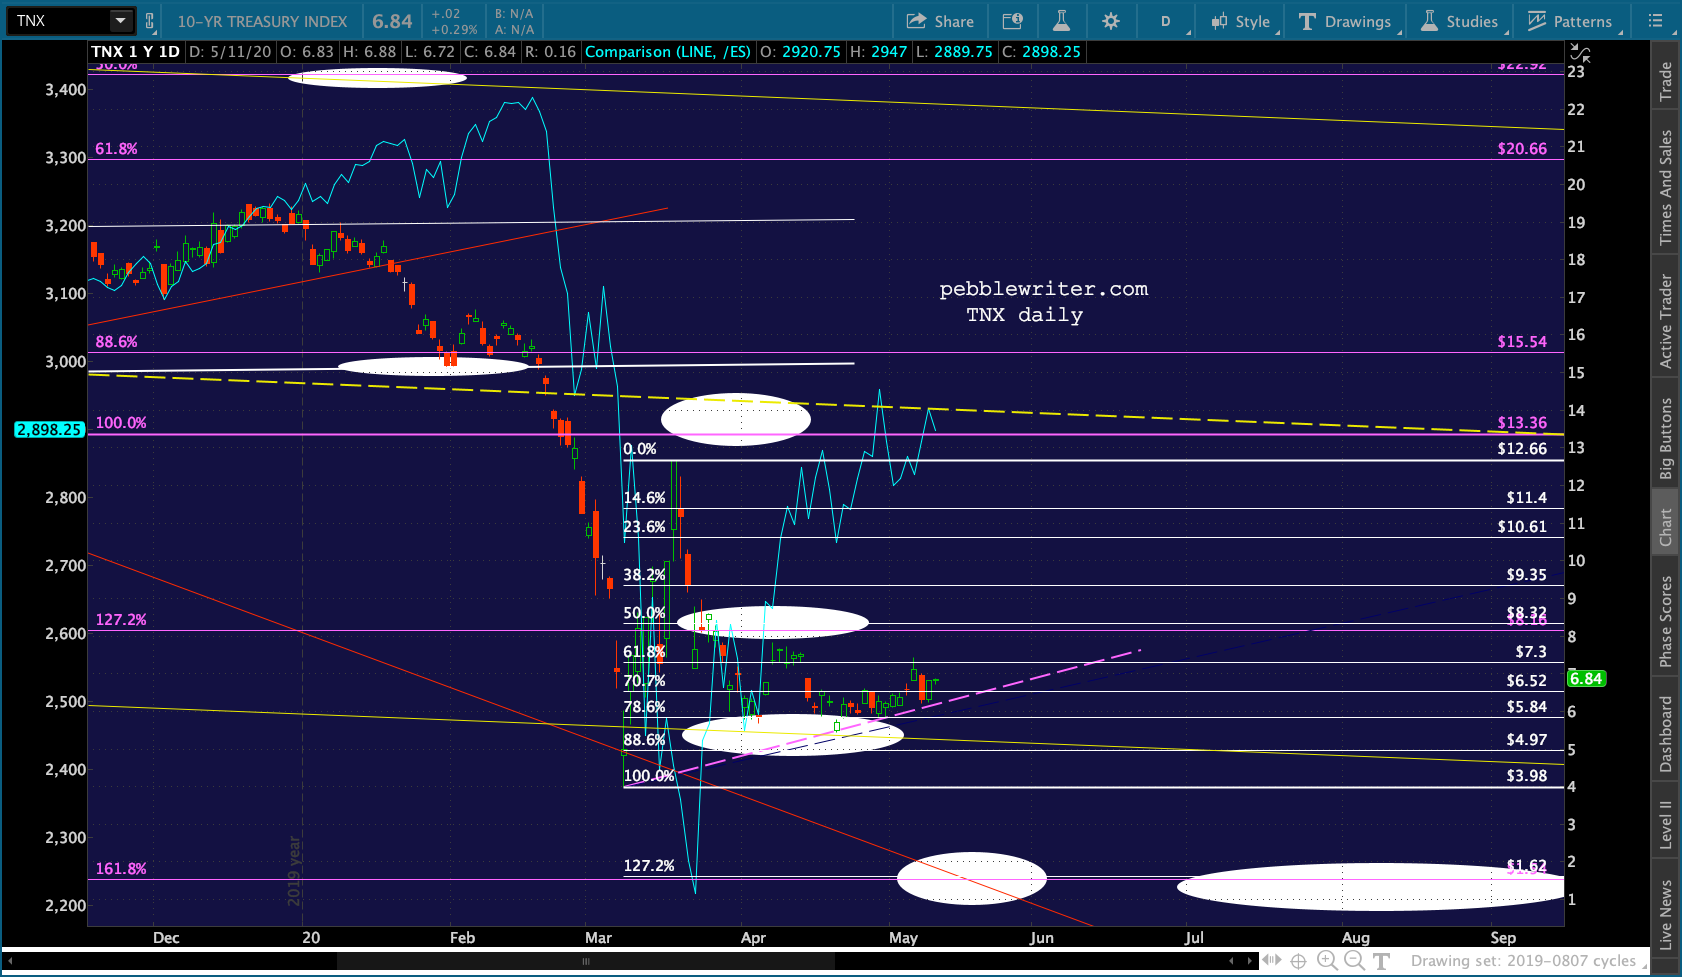
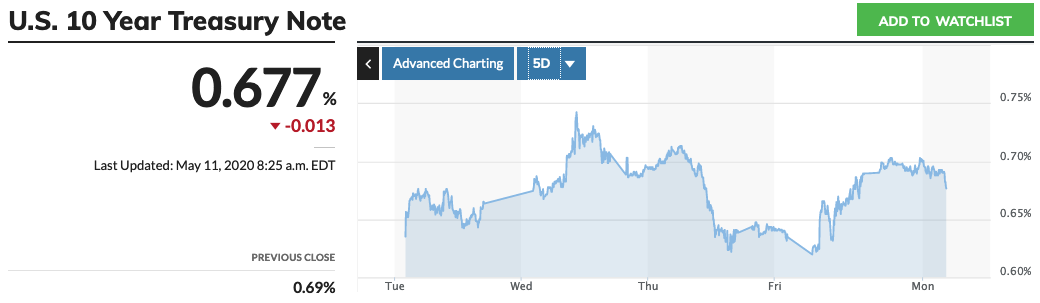
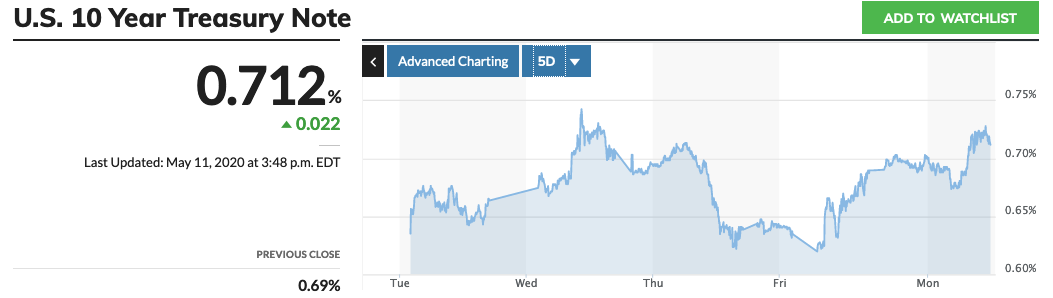
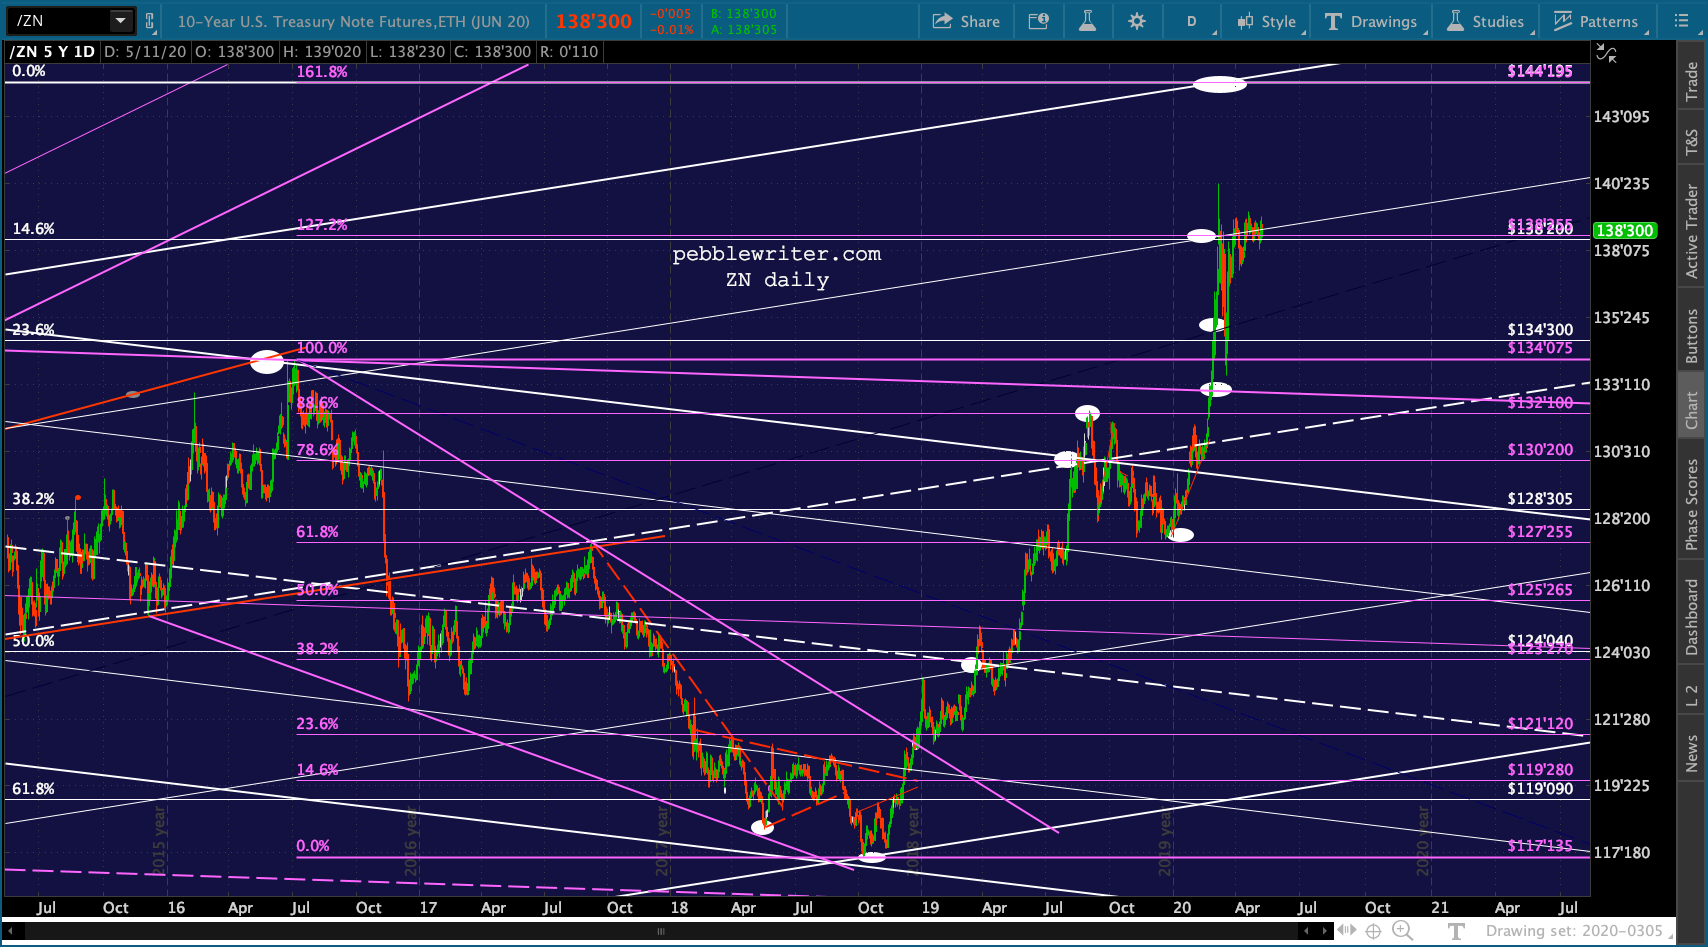 …and TNX to break down.
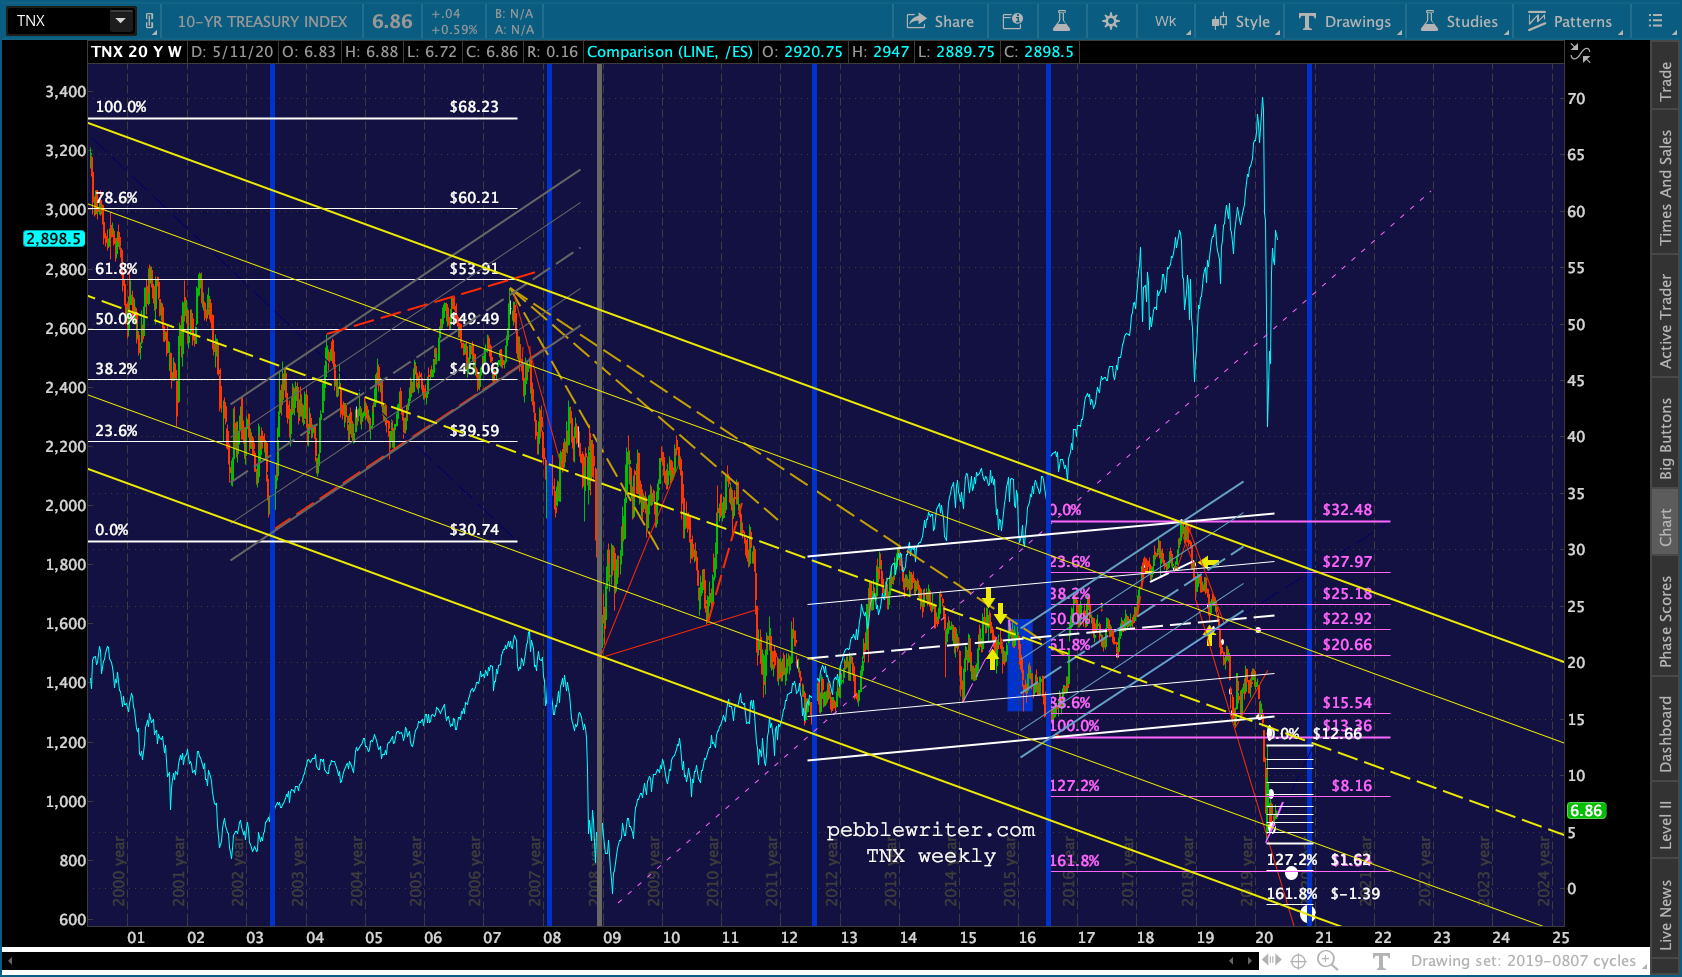
 It’ll be interesting to see how this plays out with the 2s10s. Remember, both breakouts and breakdowns are bearish. The only scenario which supports stocks is for 2s10s to go sideways.
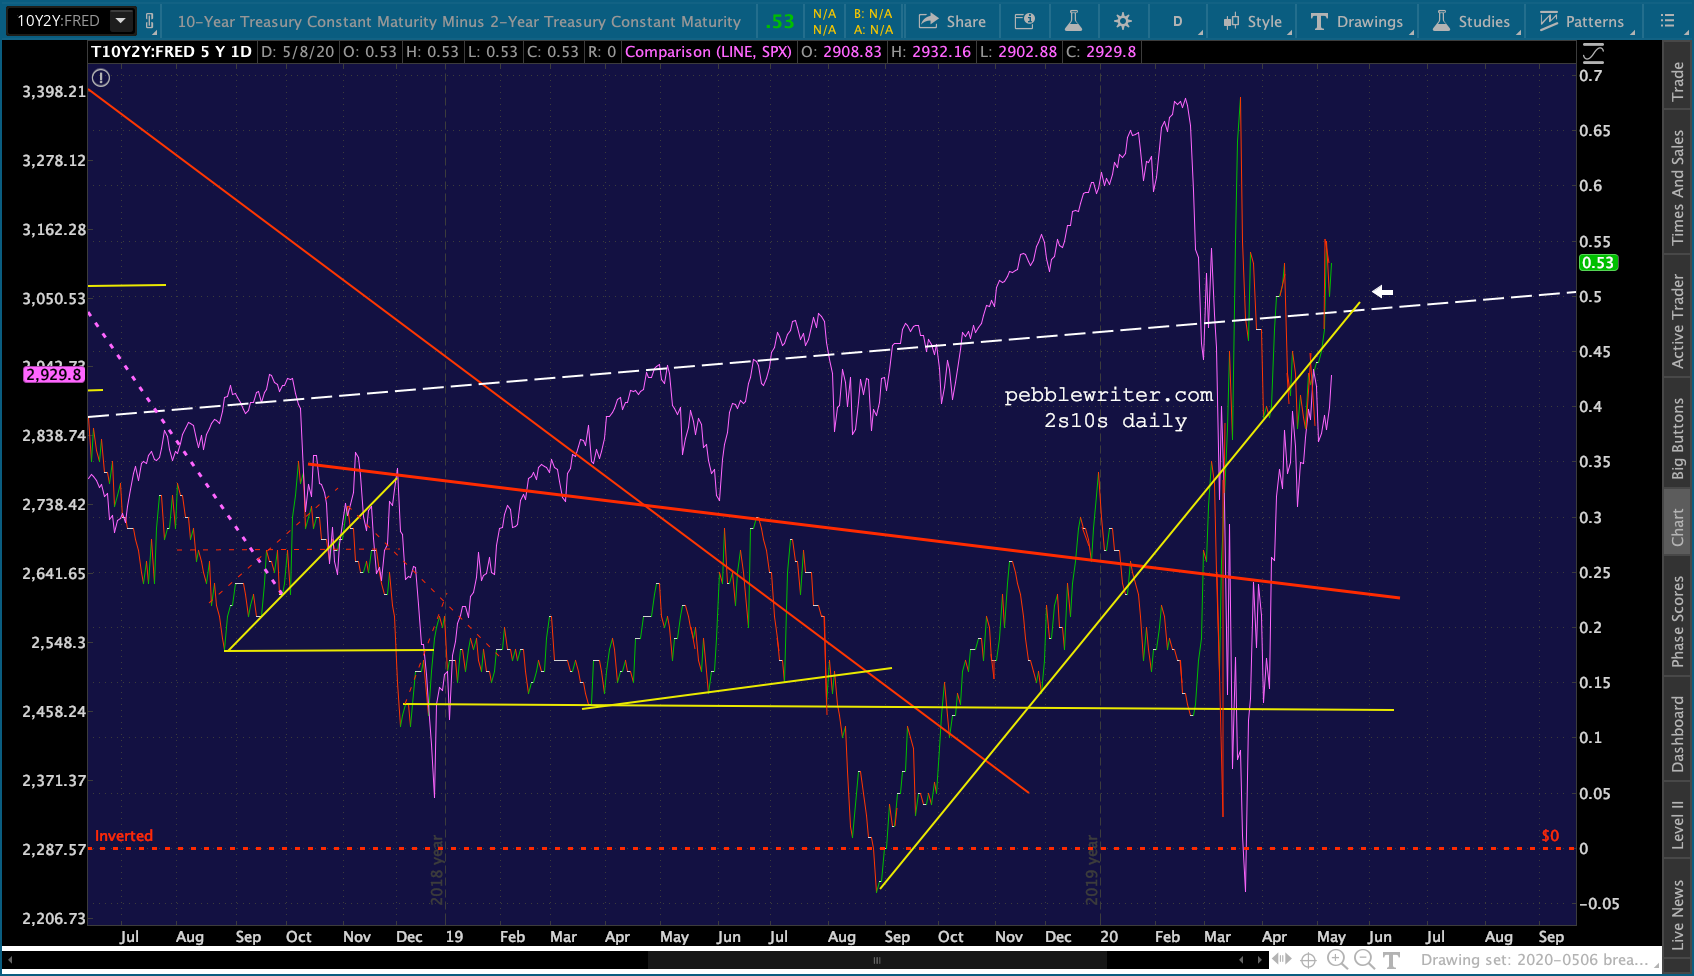 Currently, 2s10s is testing recent highs.
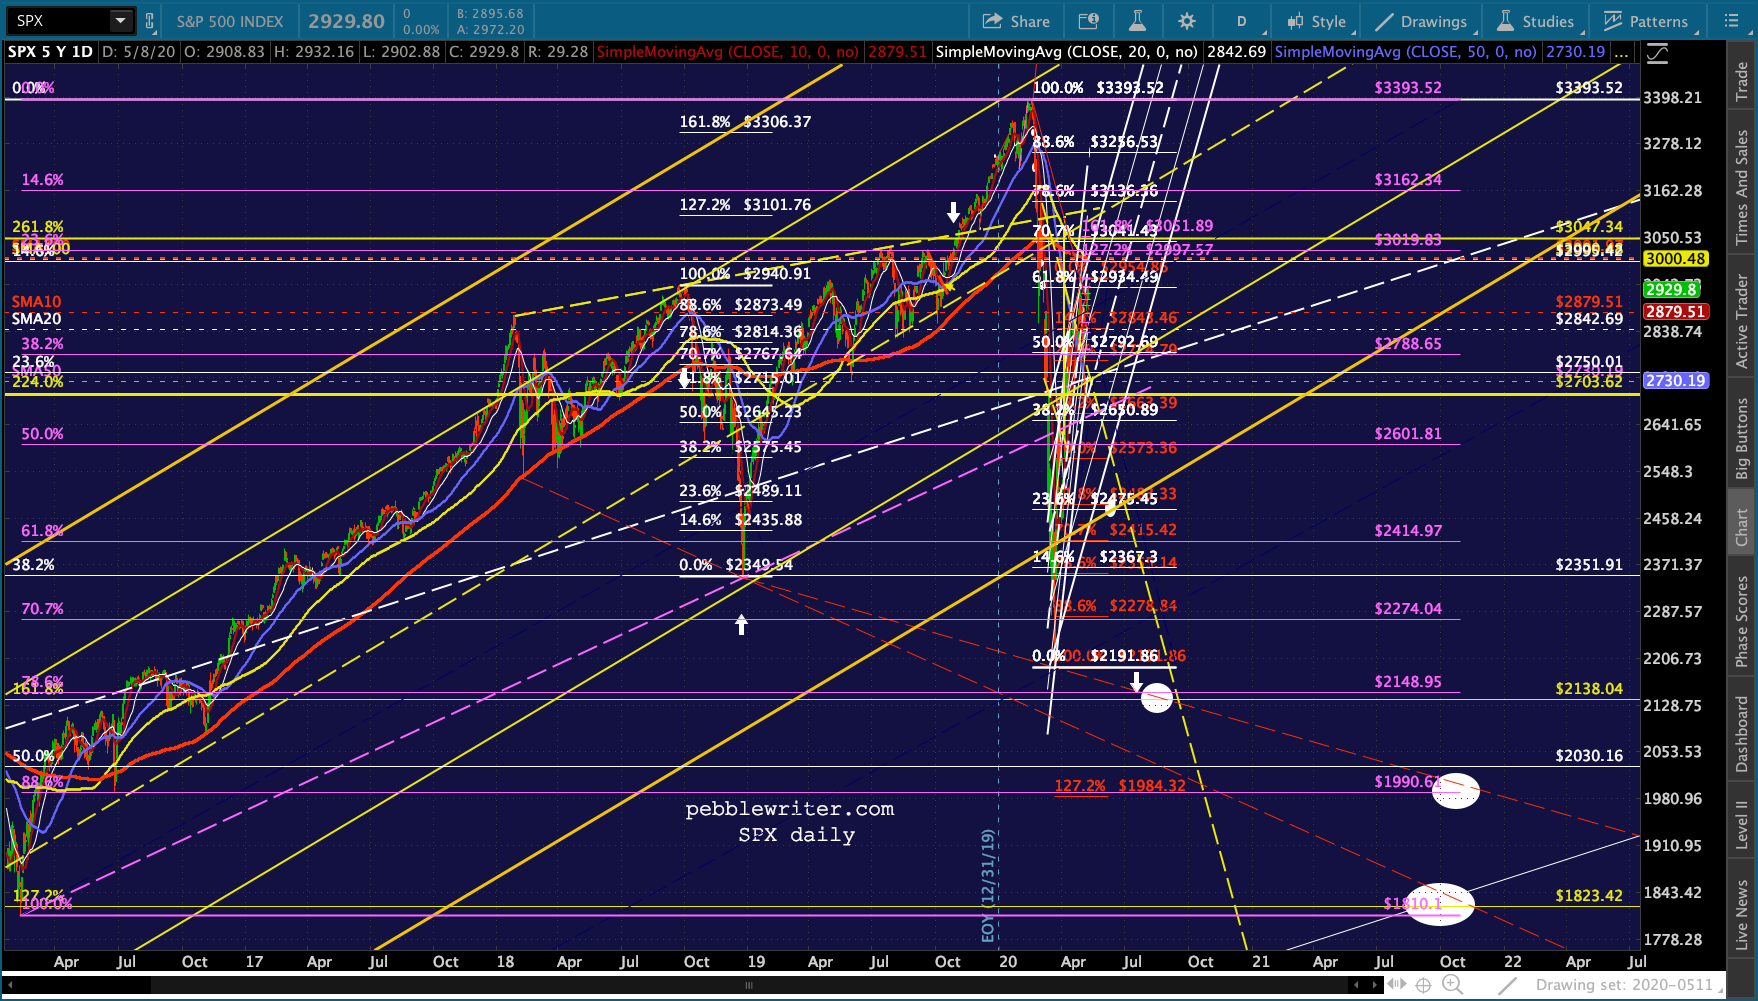
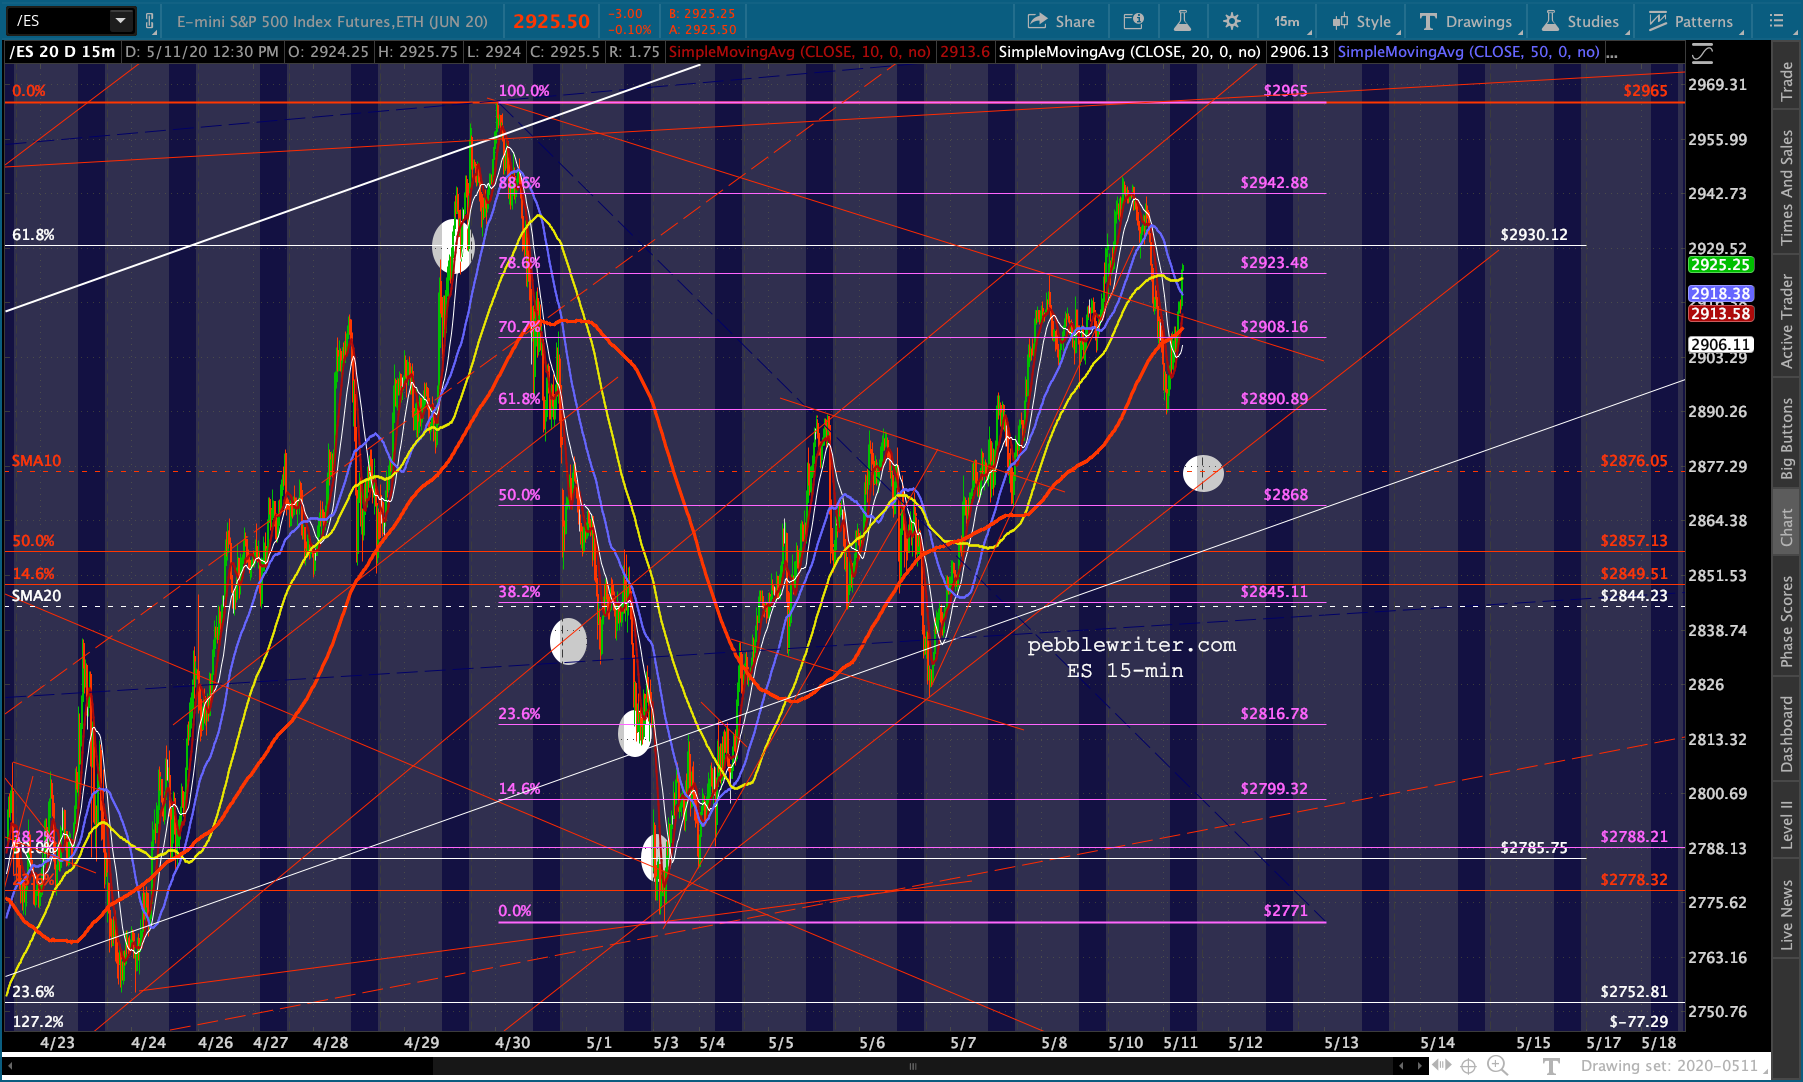
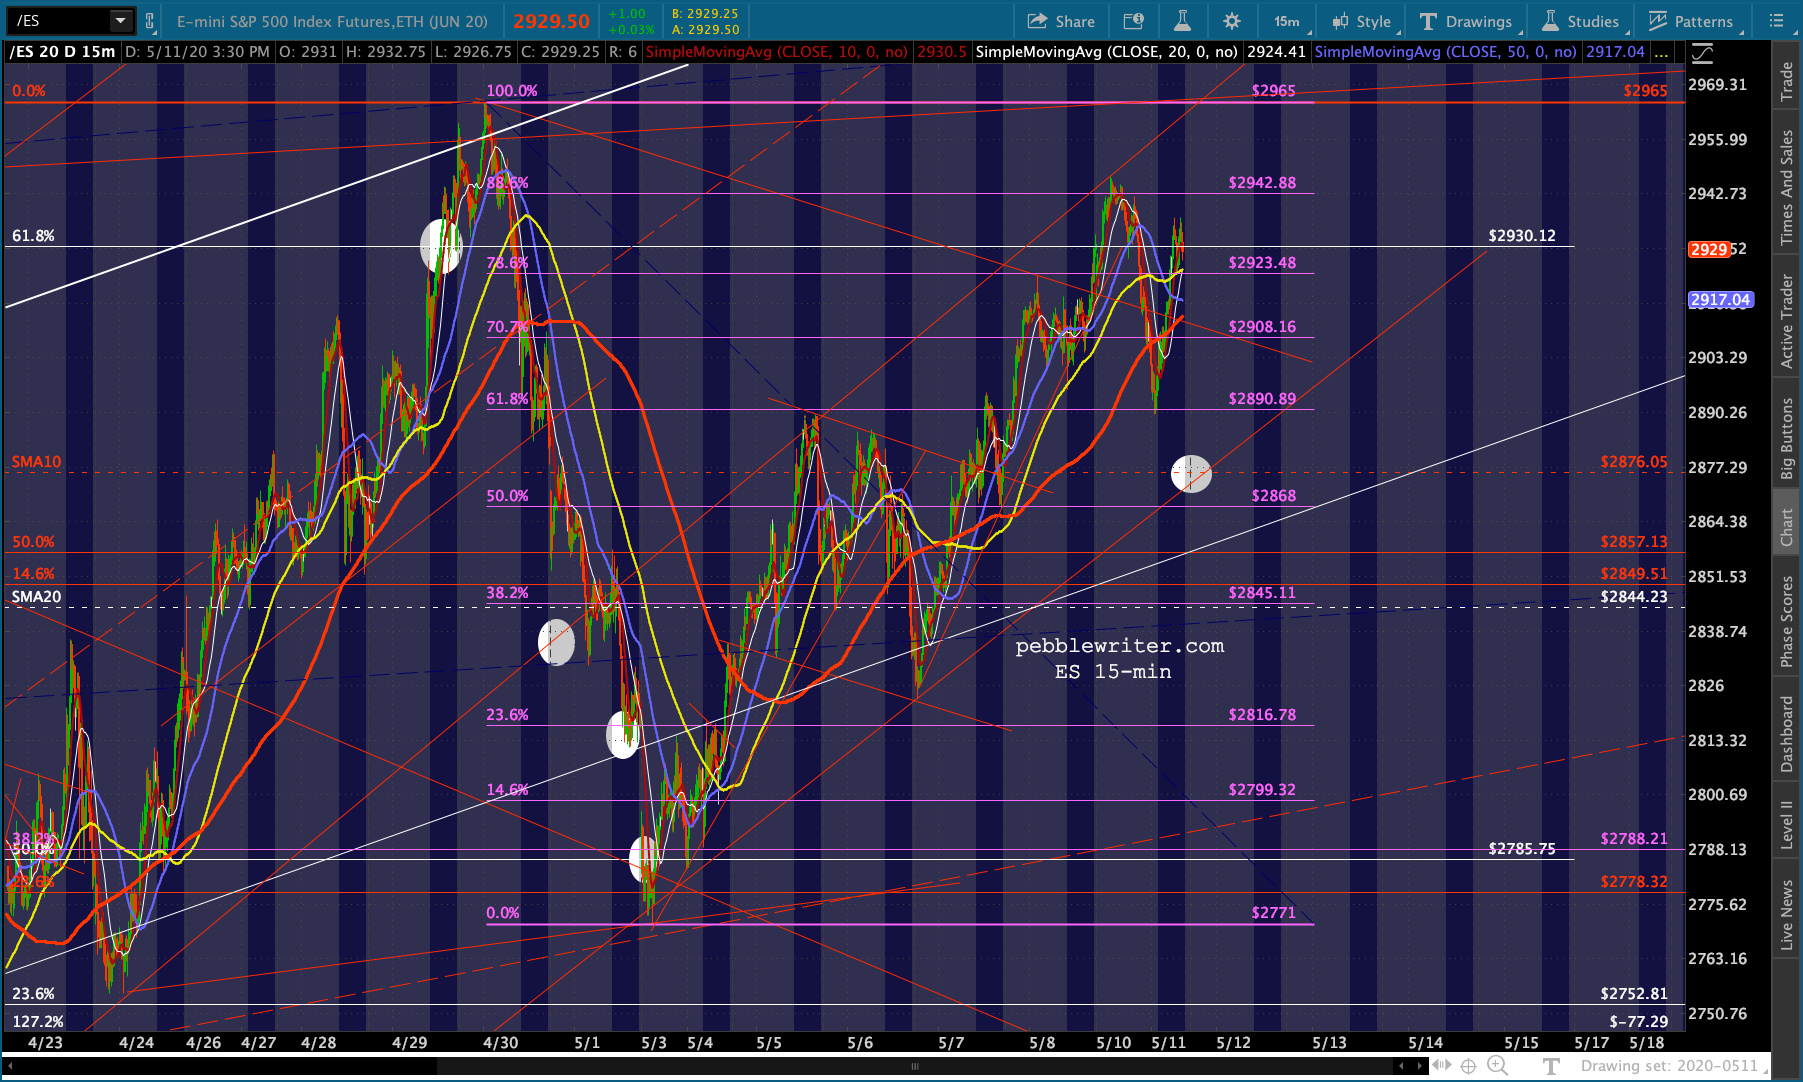
 ES has an internal TL and SMA10 to test. If it breaks down, the 2.24 still awaits at 2728.
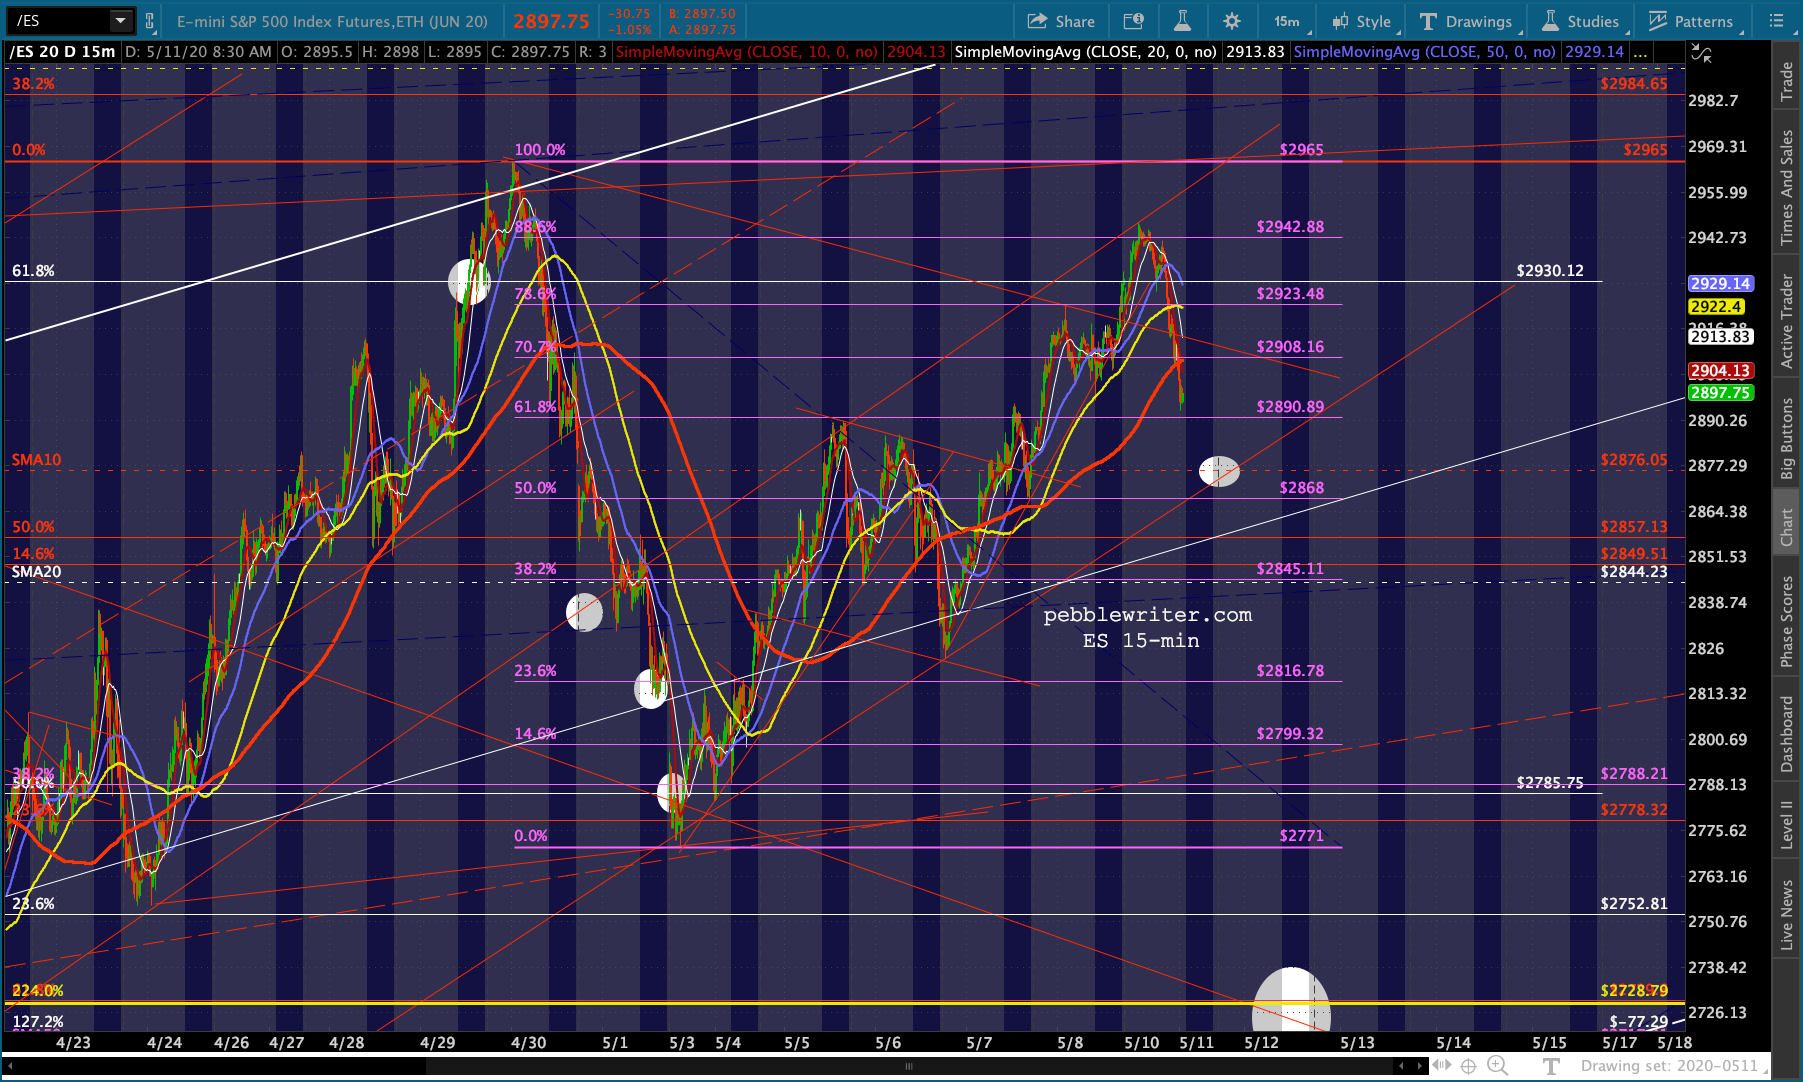
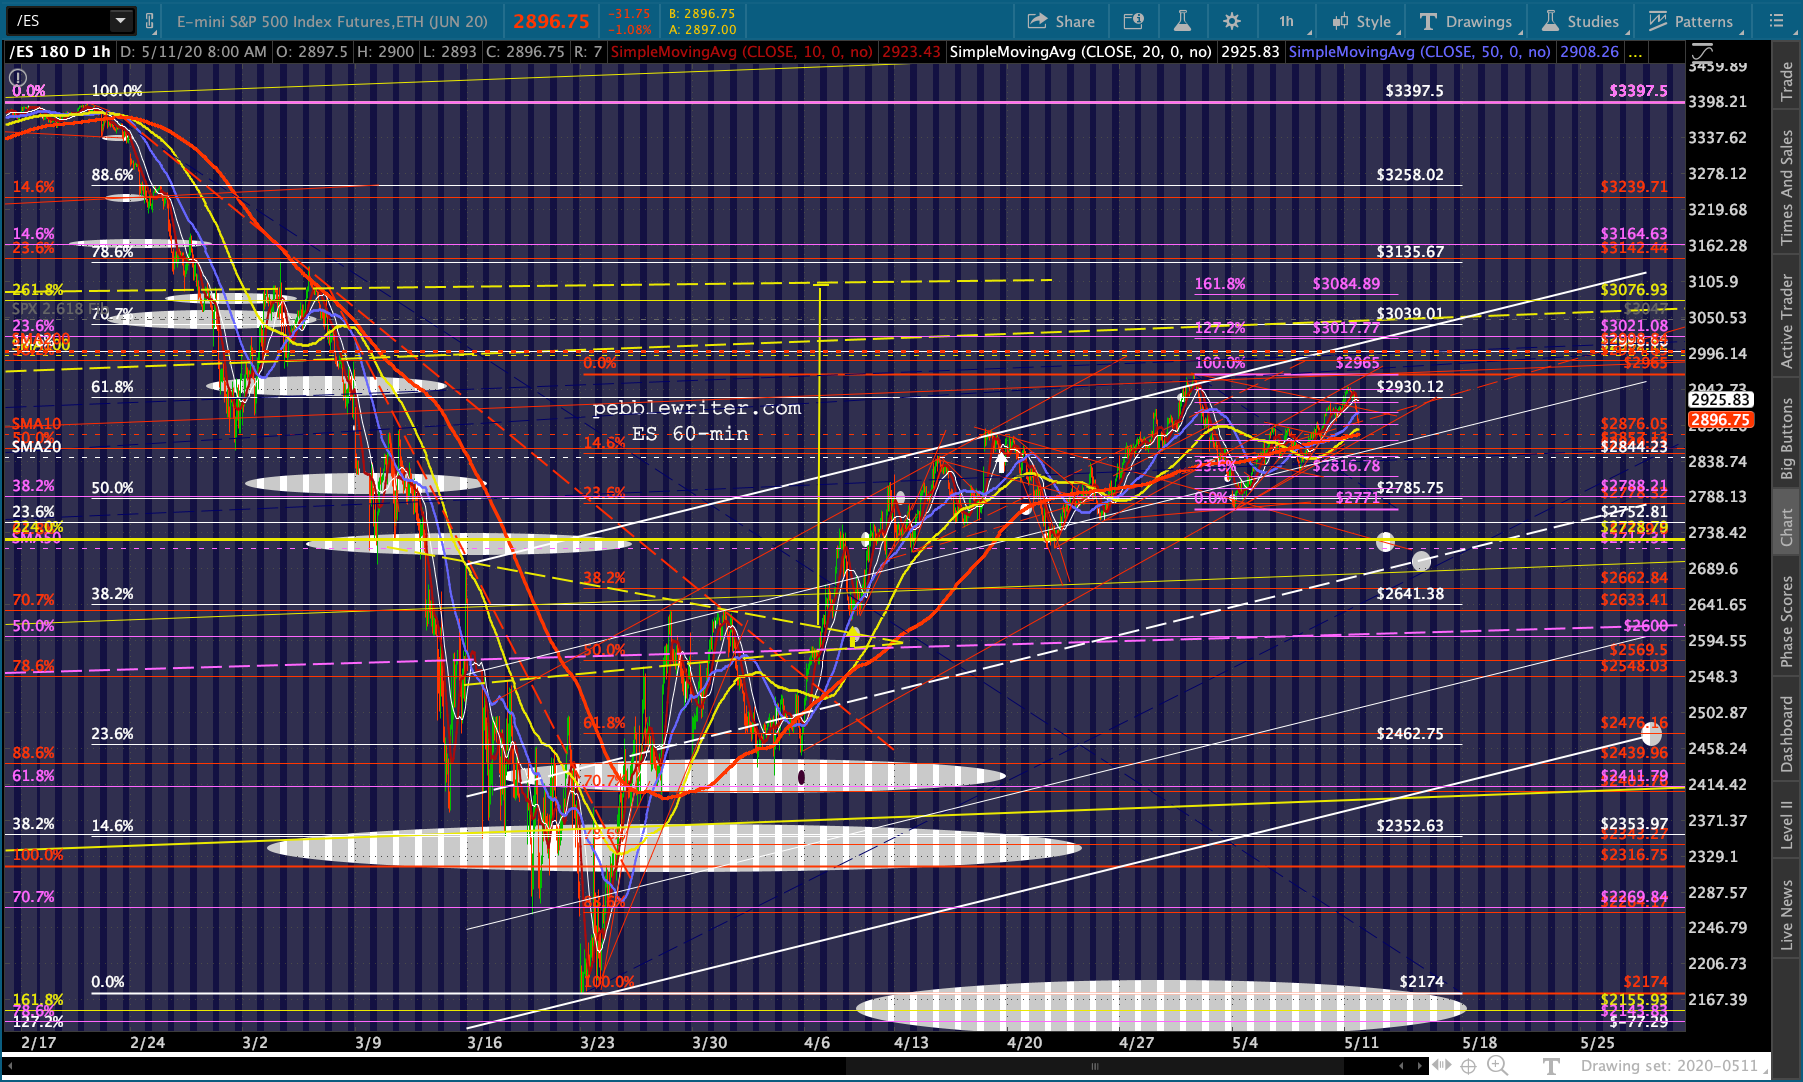
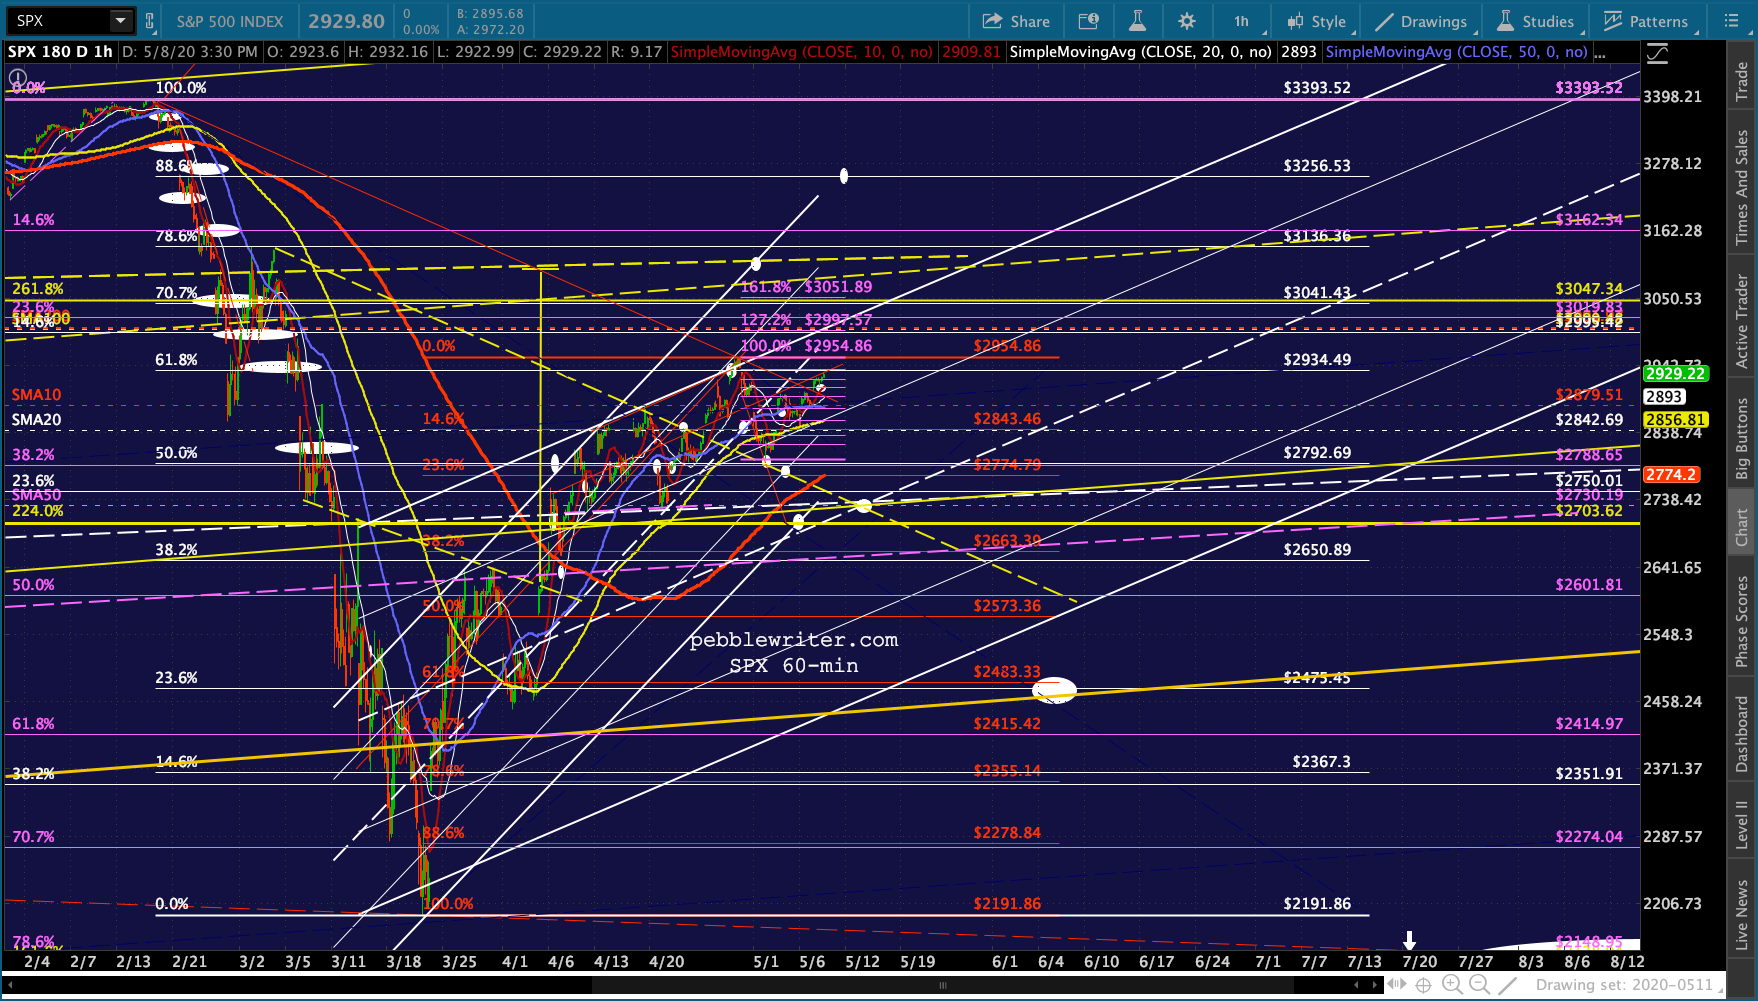
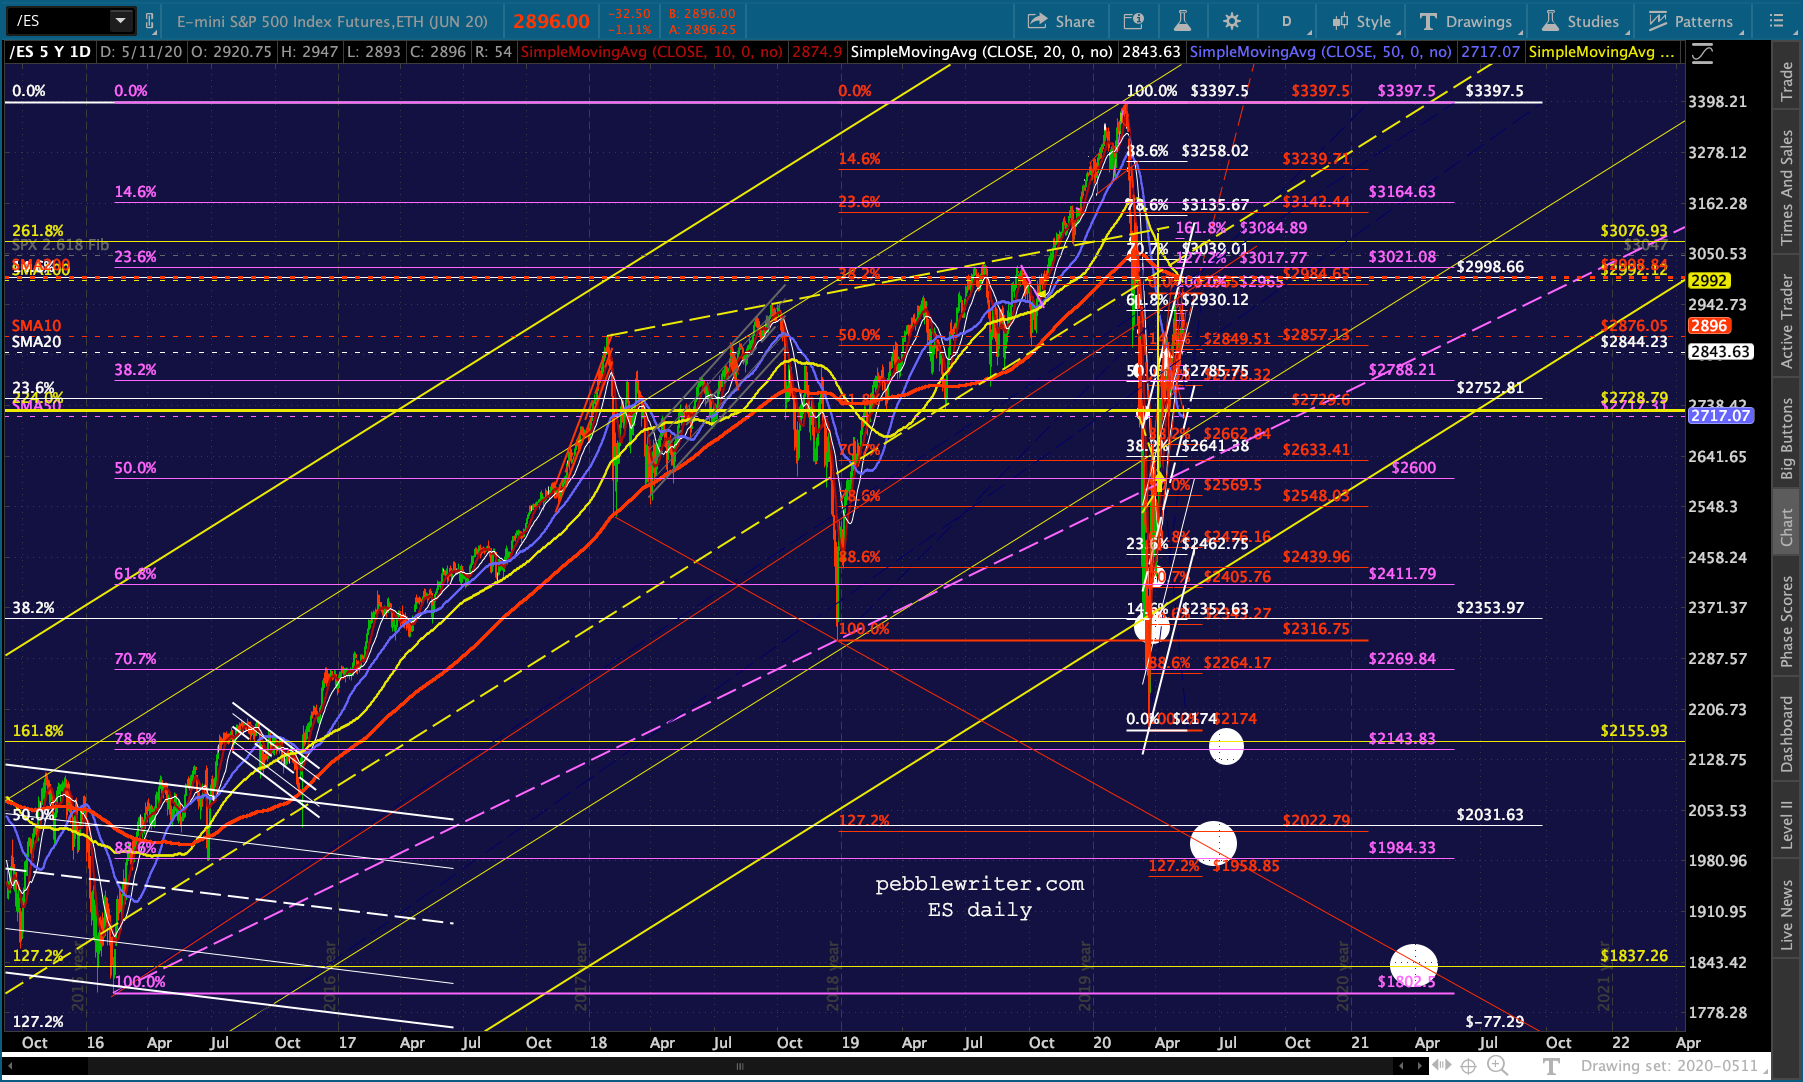 Though, as we’ve discussed many times, SPX’s 2.24 is down at 2703.
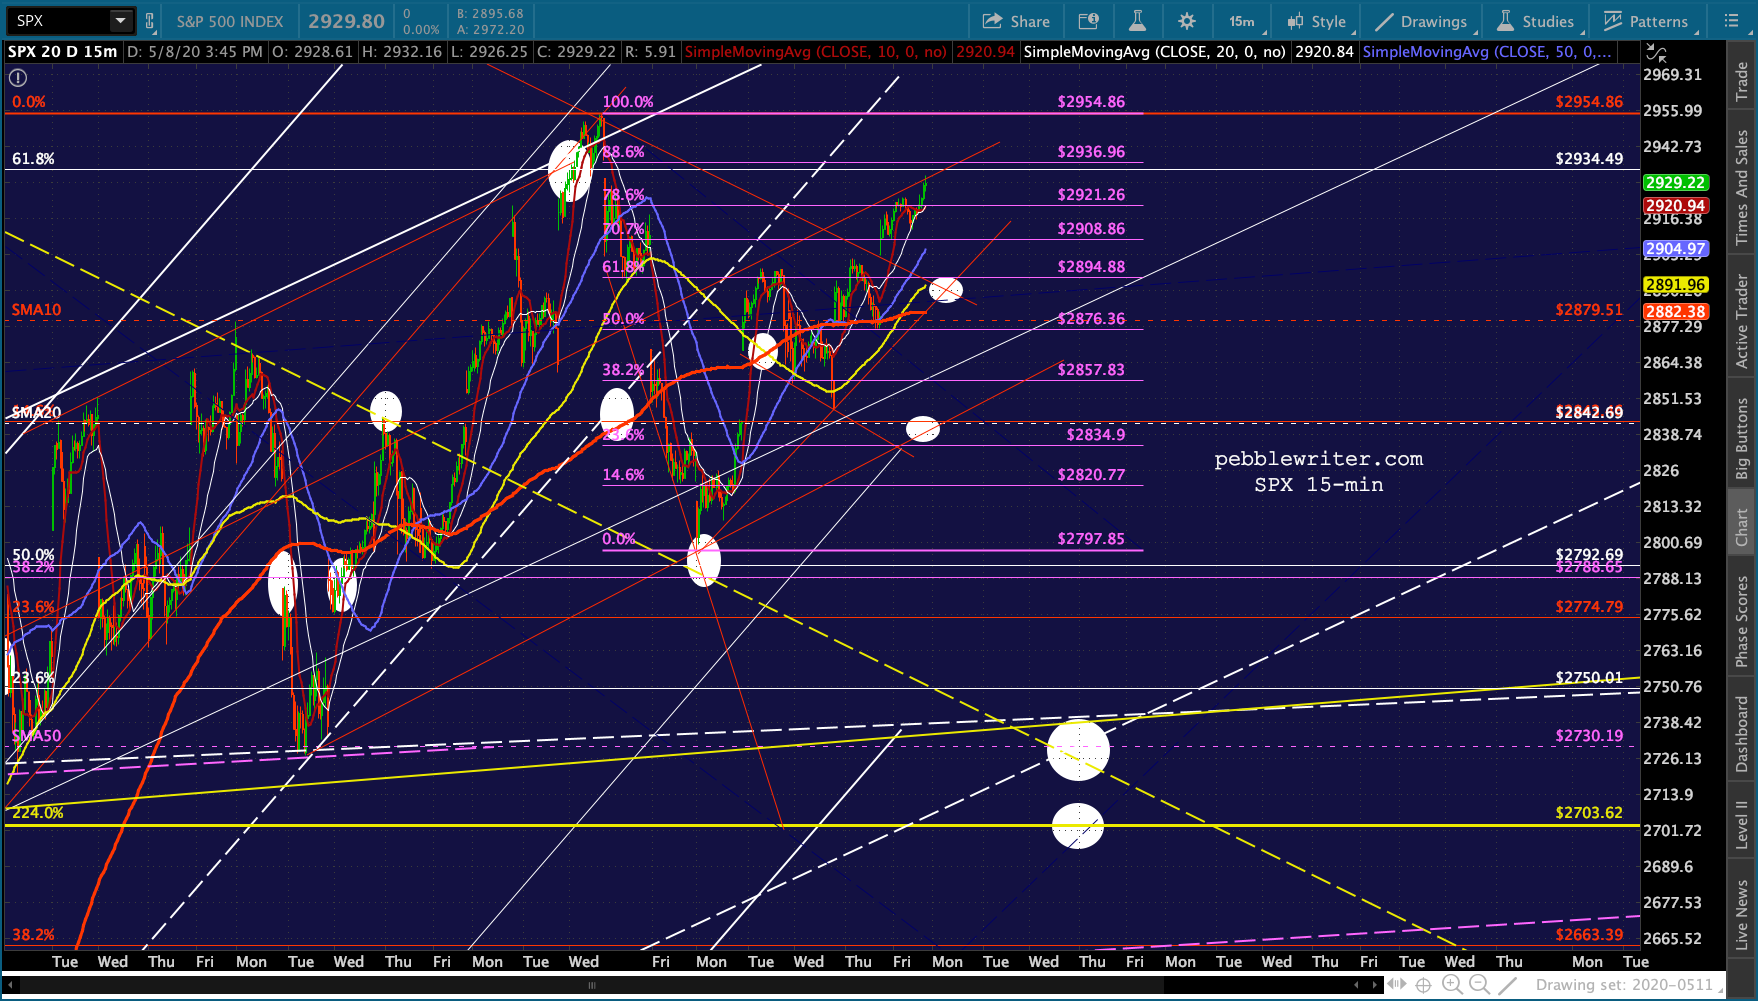
 One of the more interesting charts I looked at over the weekend involves the McClellan Oscillator (MCO.) Note that the weekly read has reached overhead resistance, much as occurred prior to past downturns.
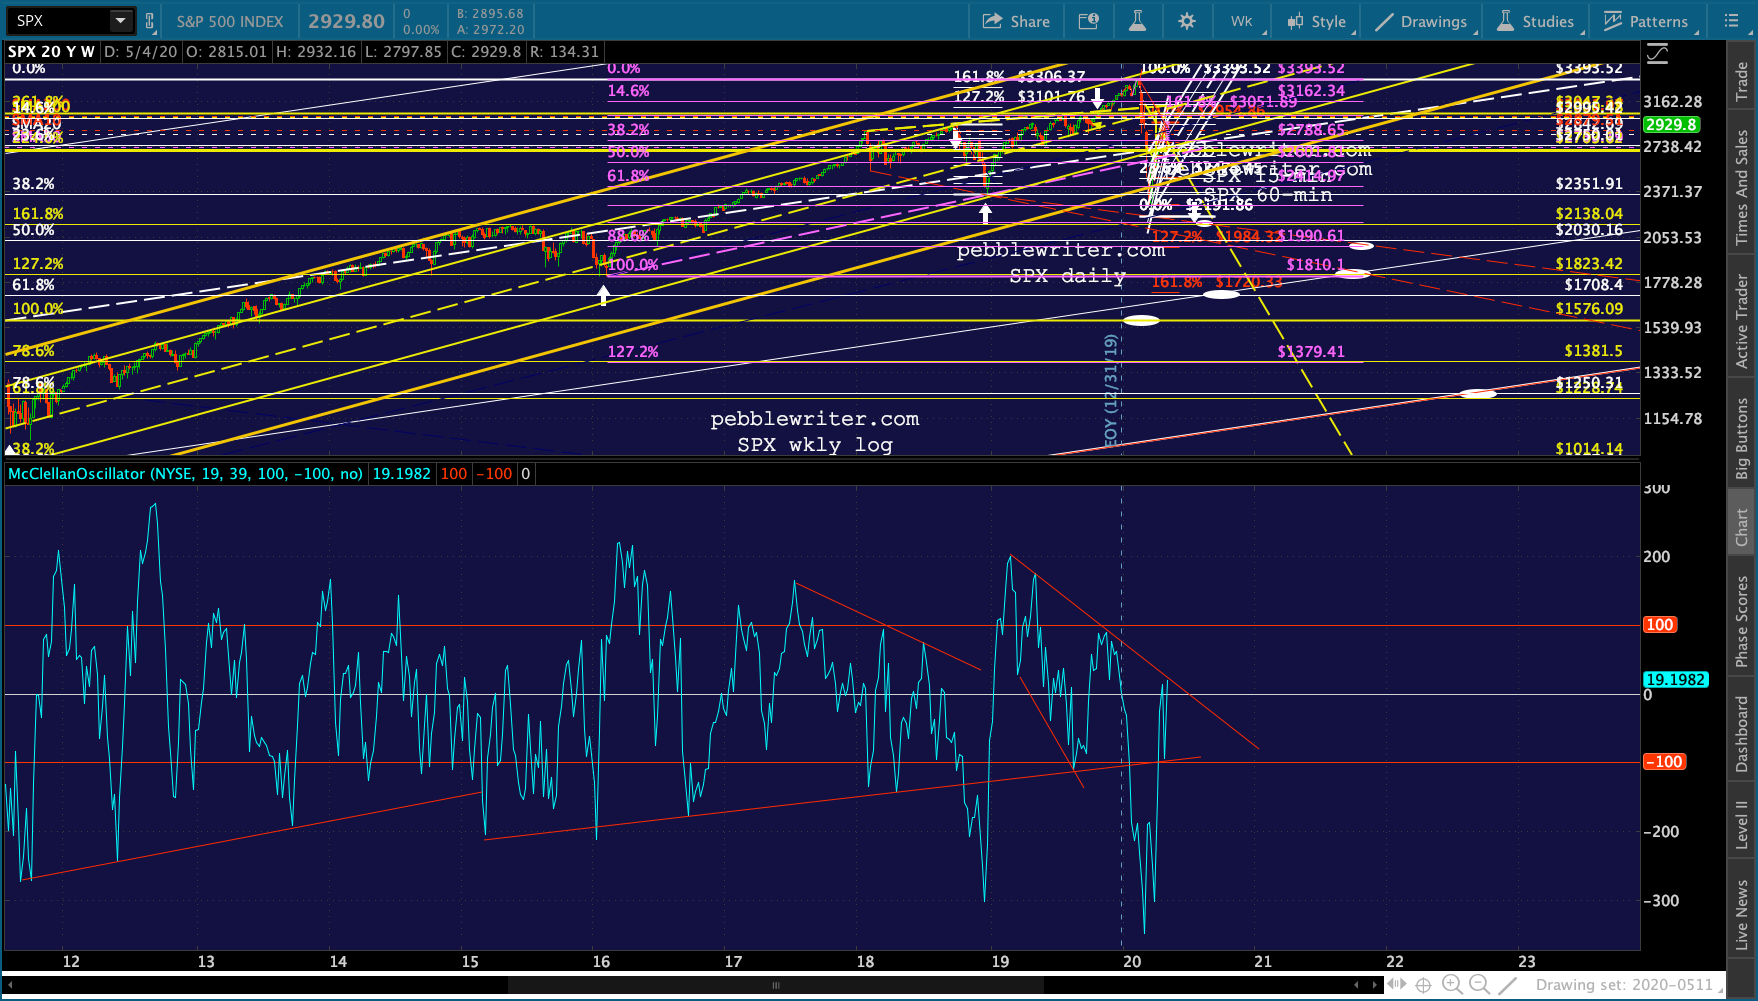 Obviously, every potential reversal and downturn is also a potential breakout.
 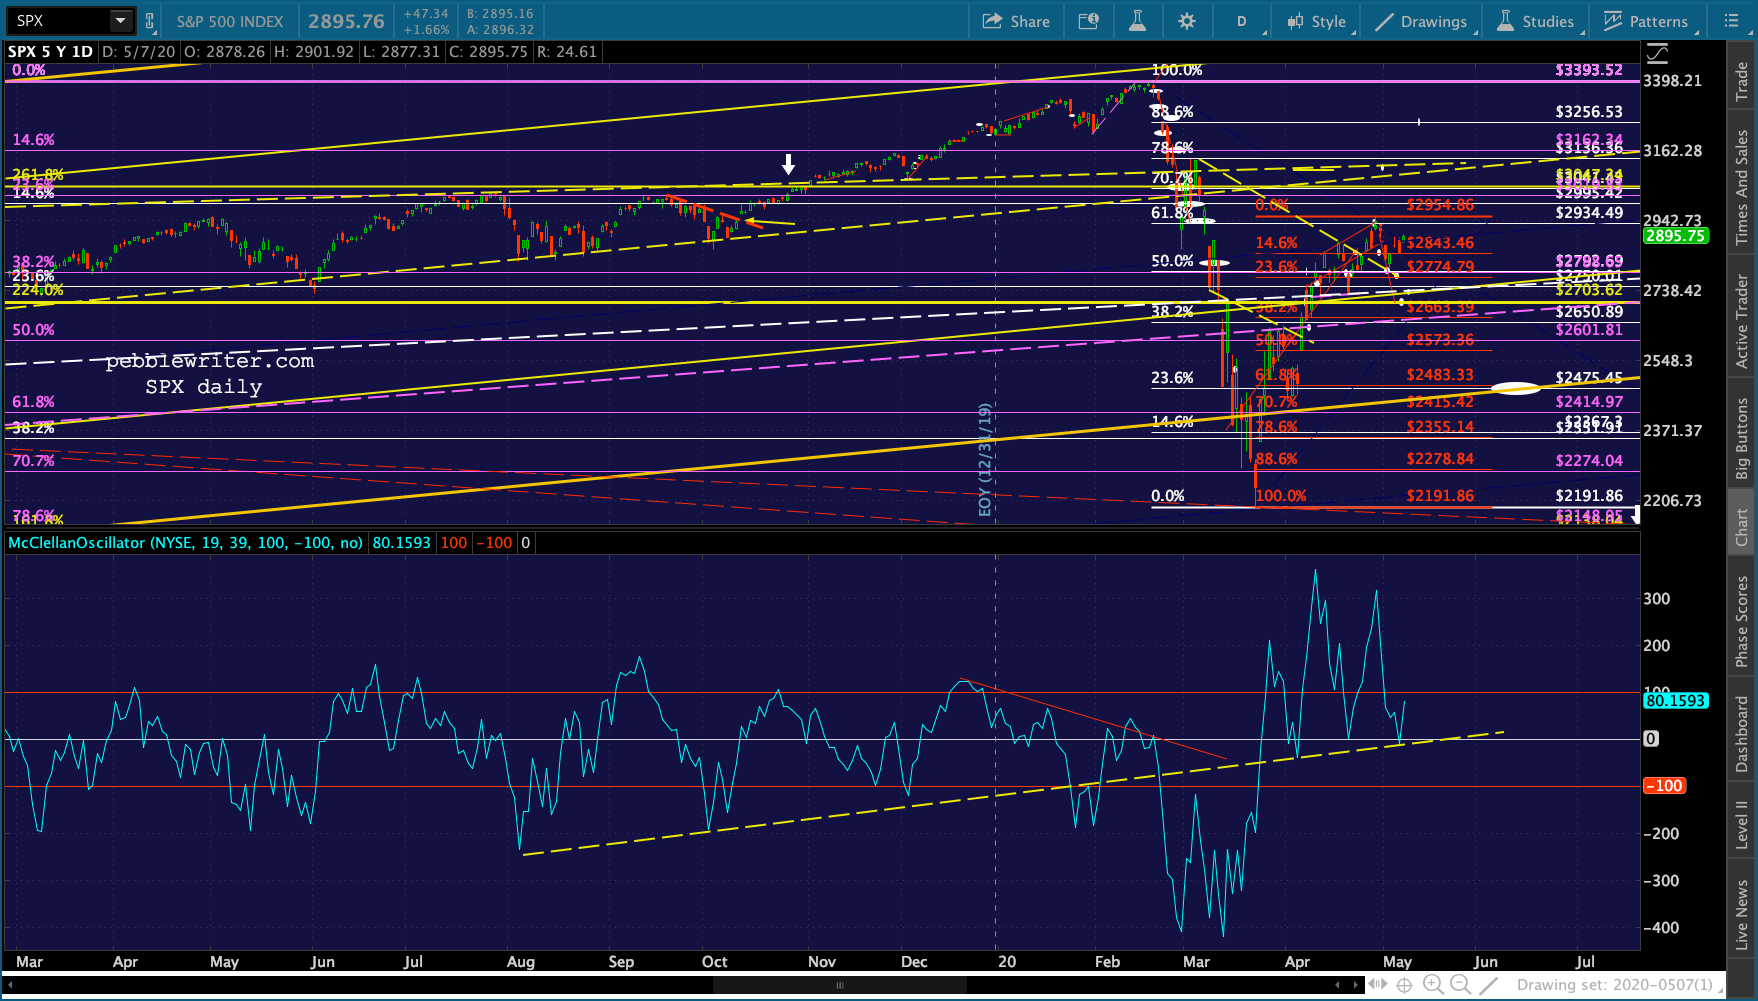 But, another chart suggests that this one won’t end well for stocks. Tom McClellan emailed this chart last week showing the level of SPY shares outstanding over the past couple of years. Though there are fundamental reasons for a year-end breakout (institutional positioning), note that the breakout (the red arrow) from the falling black channel (my addition) corresponded…
 …with SPX’s breakout above its 2.618 Fib and yellow TL in early November (the white arrow below.) SPX’s drop back below the yellow TL, the 2.618 and SMA200 in late Feb corresponded precisely with the failure of SPY’s breakout (its re-entry, marked with the vertical blue line) from that channel.
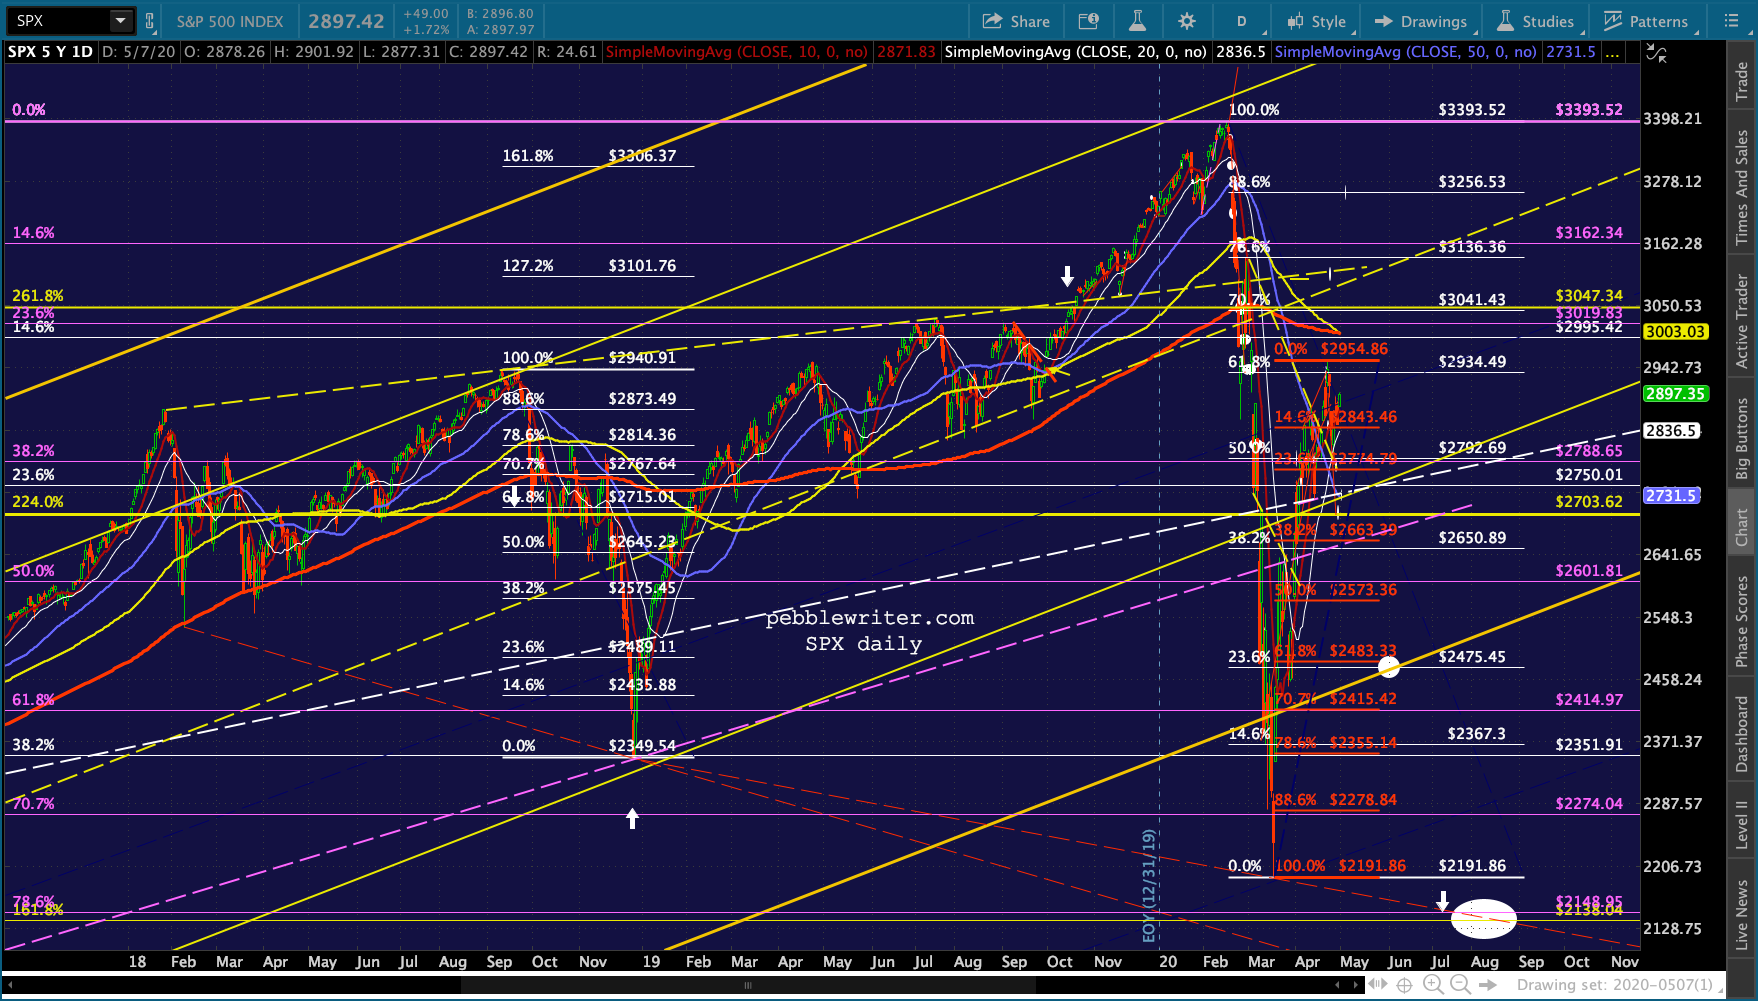 Note that SPY’s share formation bounced back out of the channel when SPX bottomed on March 23, but has since fallen back below the channel top – another re-entry. Tom and I don’t necessarily agree on the significance. But, I see the re-entry into the channel as a strong signal of another leg down for equities.
There’s another potential tell – the fact that each significant downturn for stocks was marked by a lower high in the SPY share count. These are marked with vertical red lines and represent a type of negative divergence as we often see in RSI charts. This bears watching.
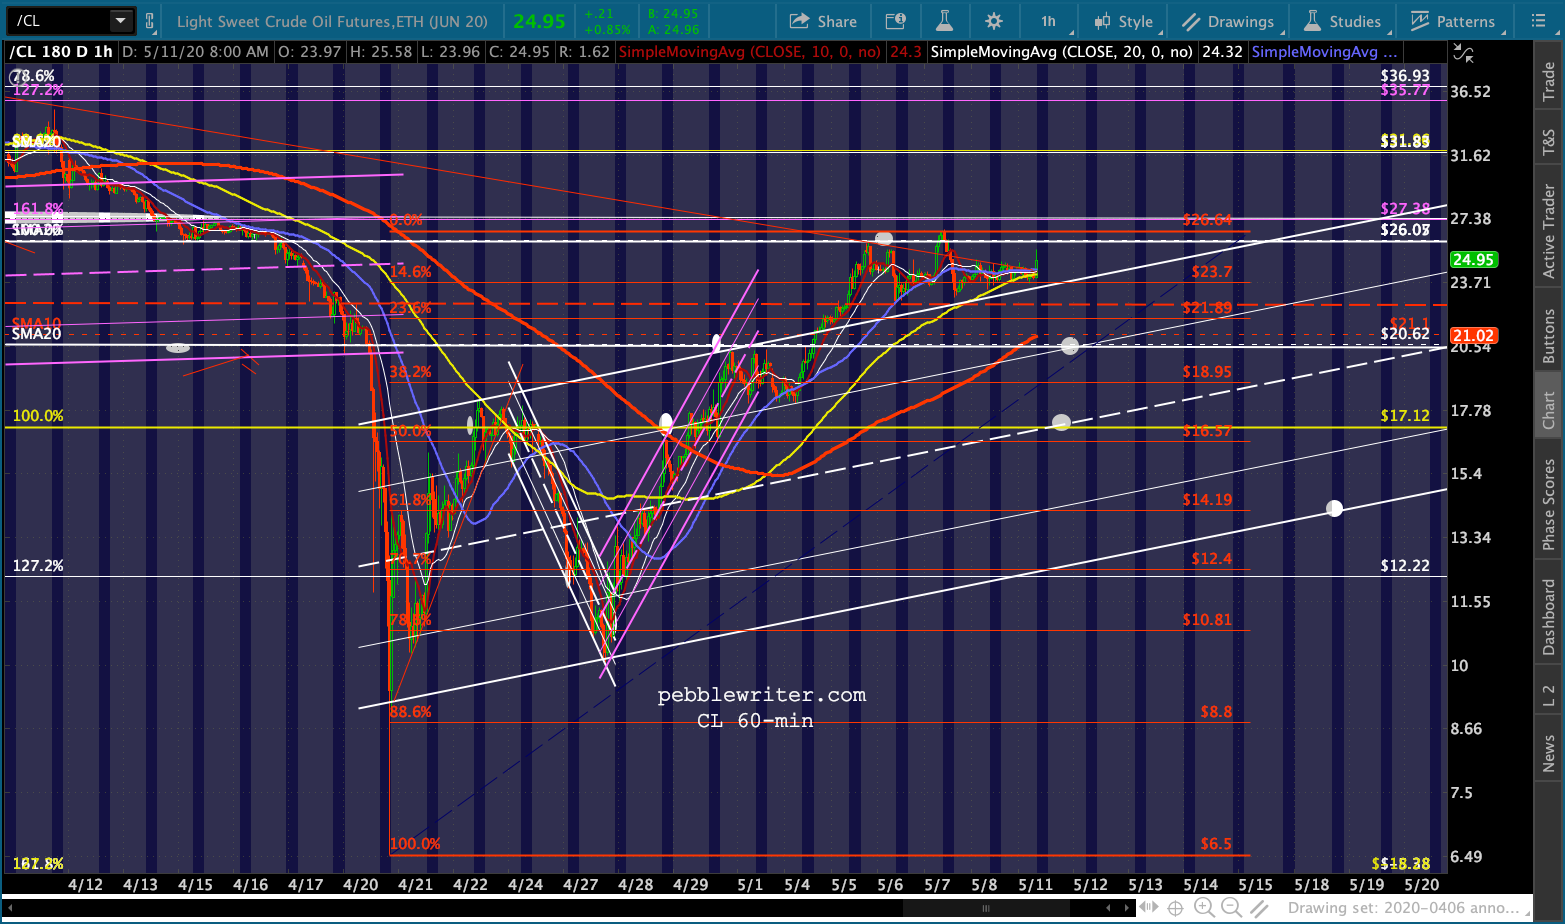
As mentioned above, CL and RB are getting a bump this morning. Saudi Arabia announced it will unilaterally cut another 1 million barrels per day.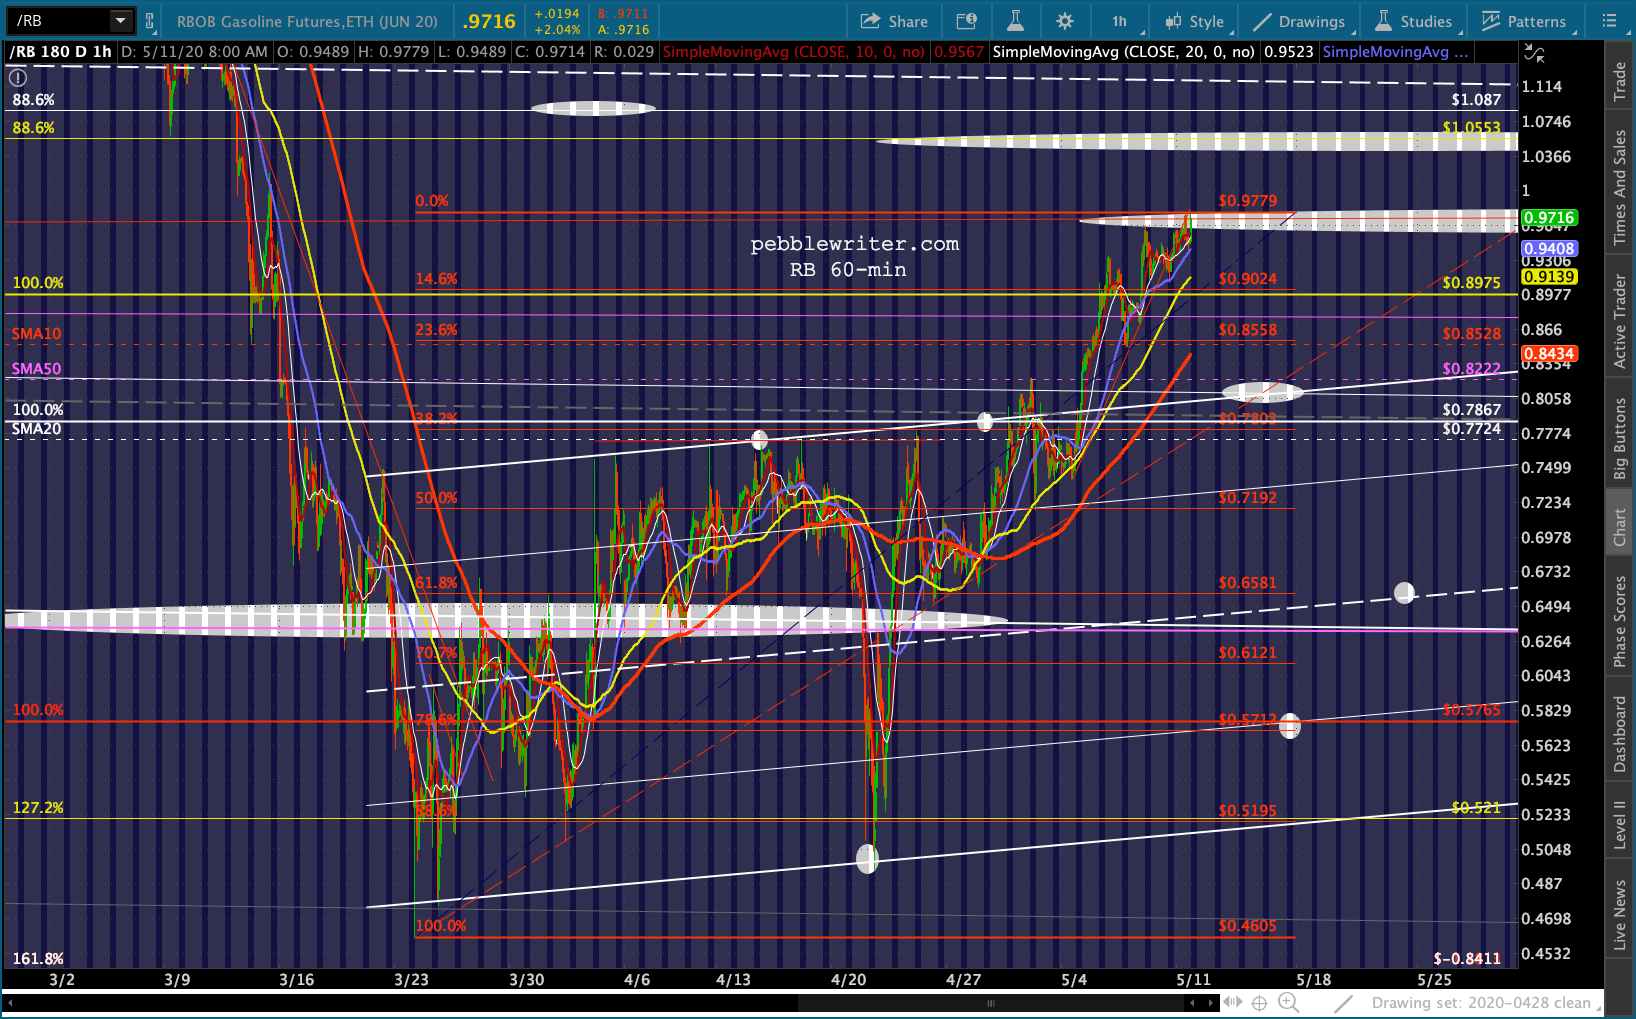
 UPDATE: 11:00 AM
This isn’t exactly a great development for bears…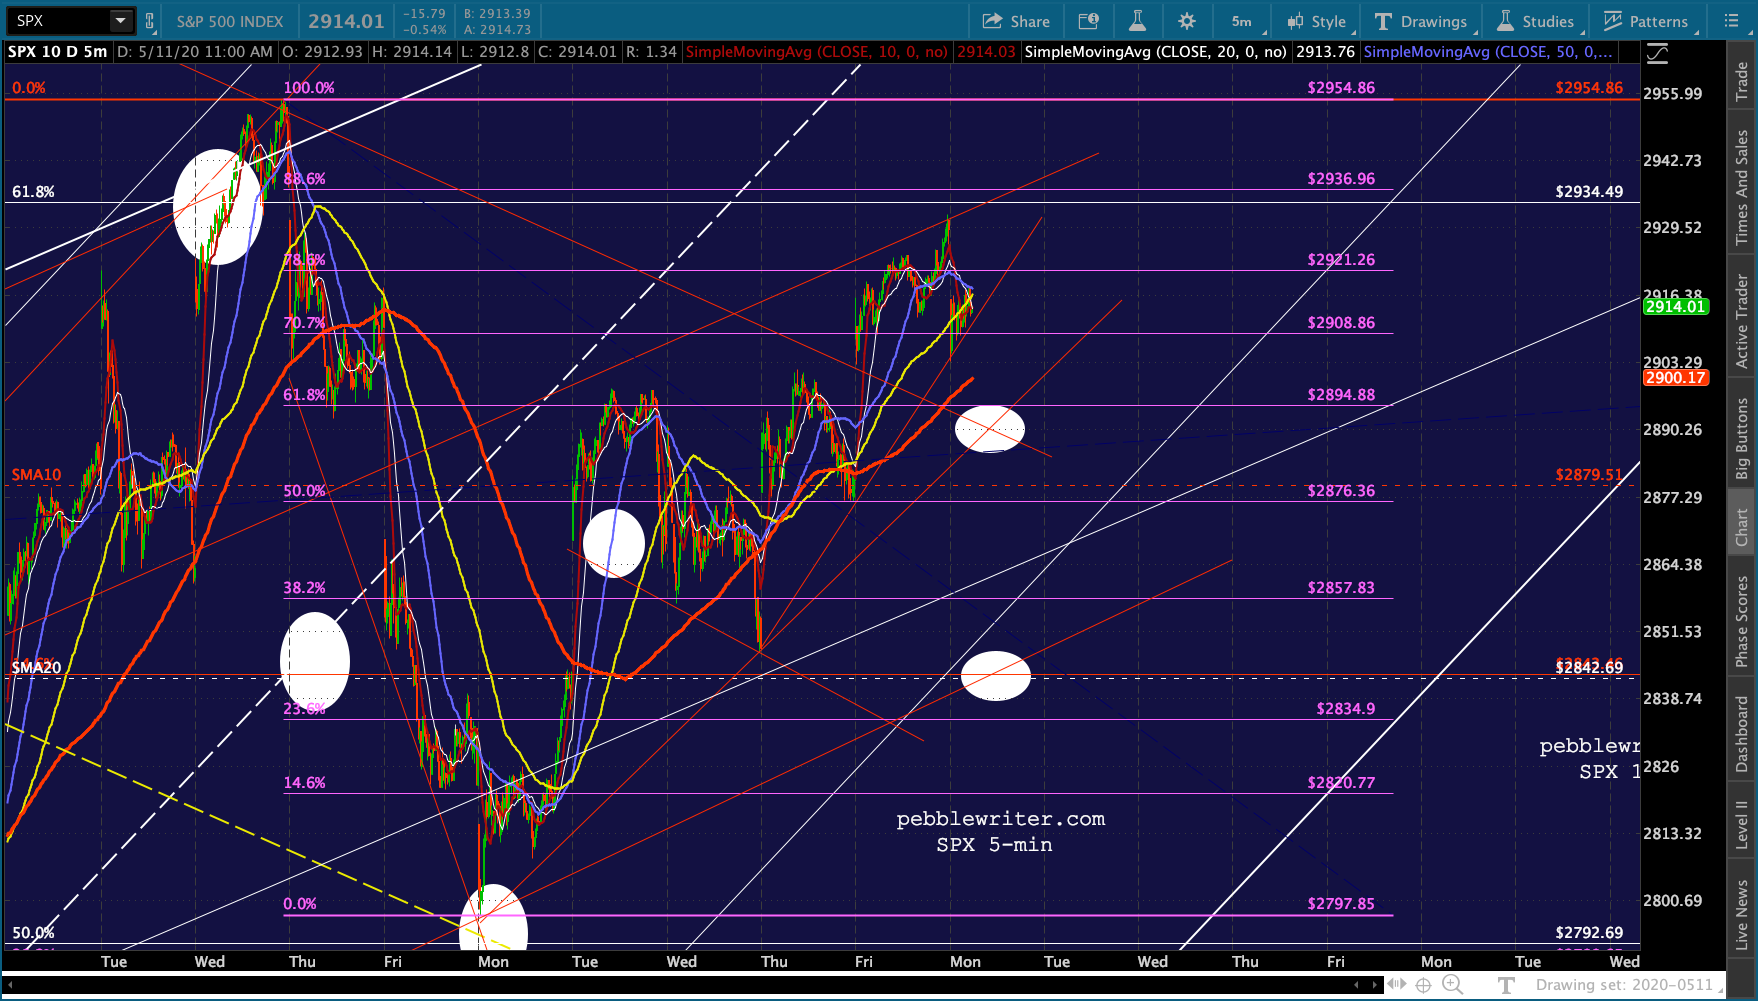 UPDATE: 12:33 PM
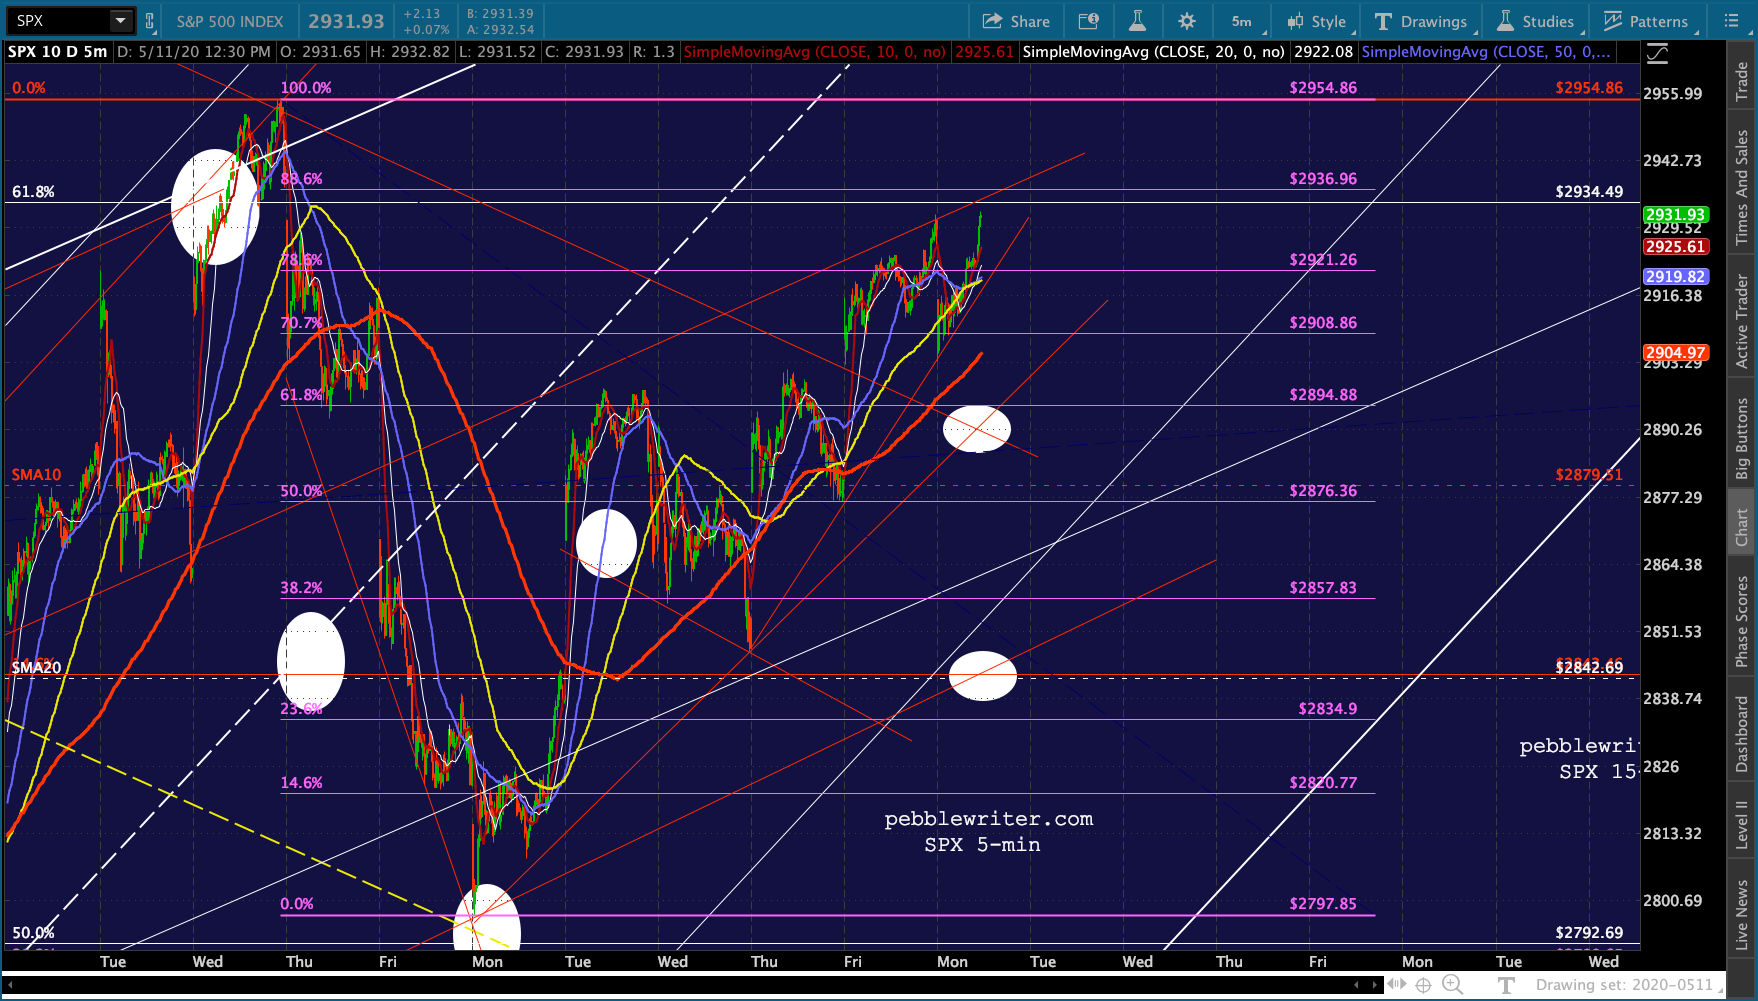
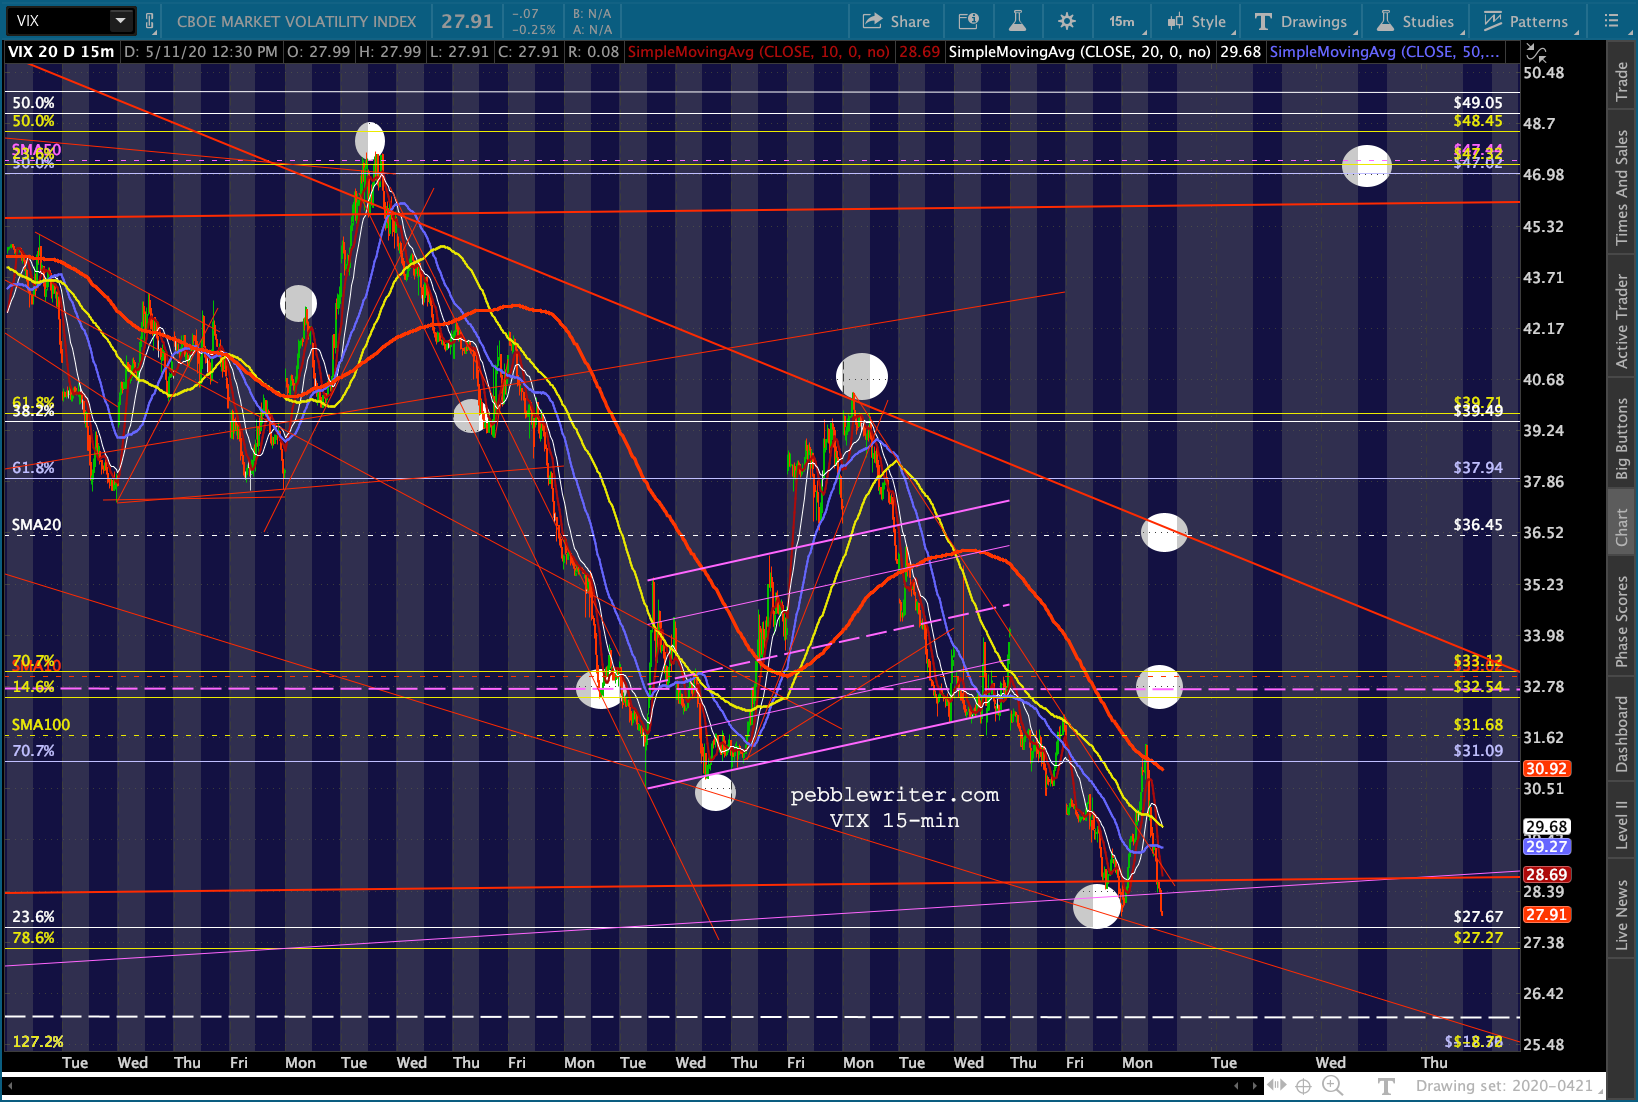
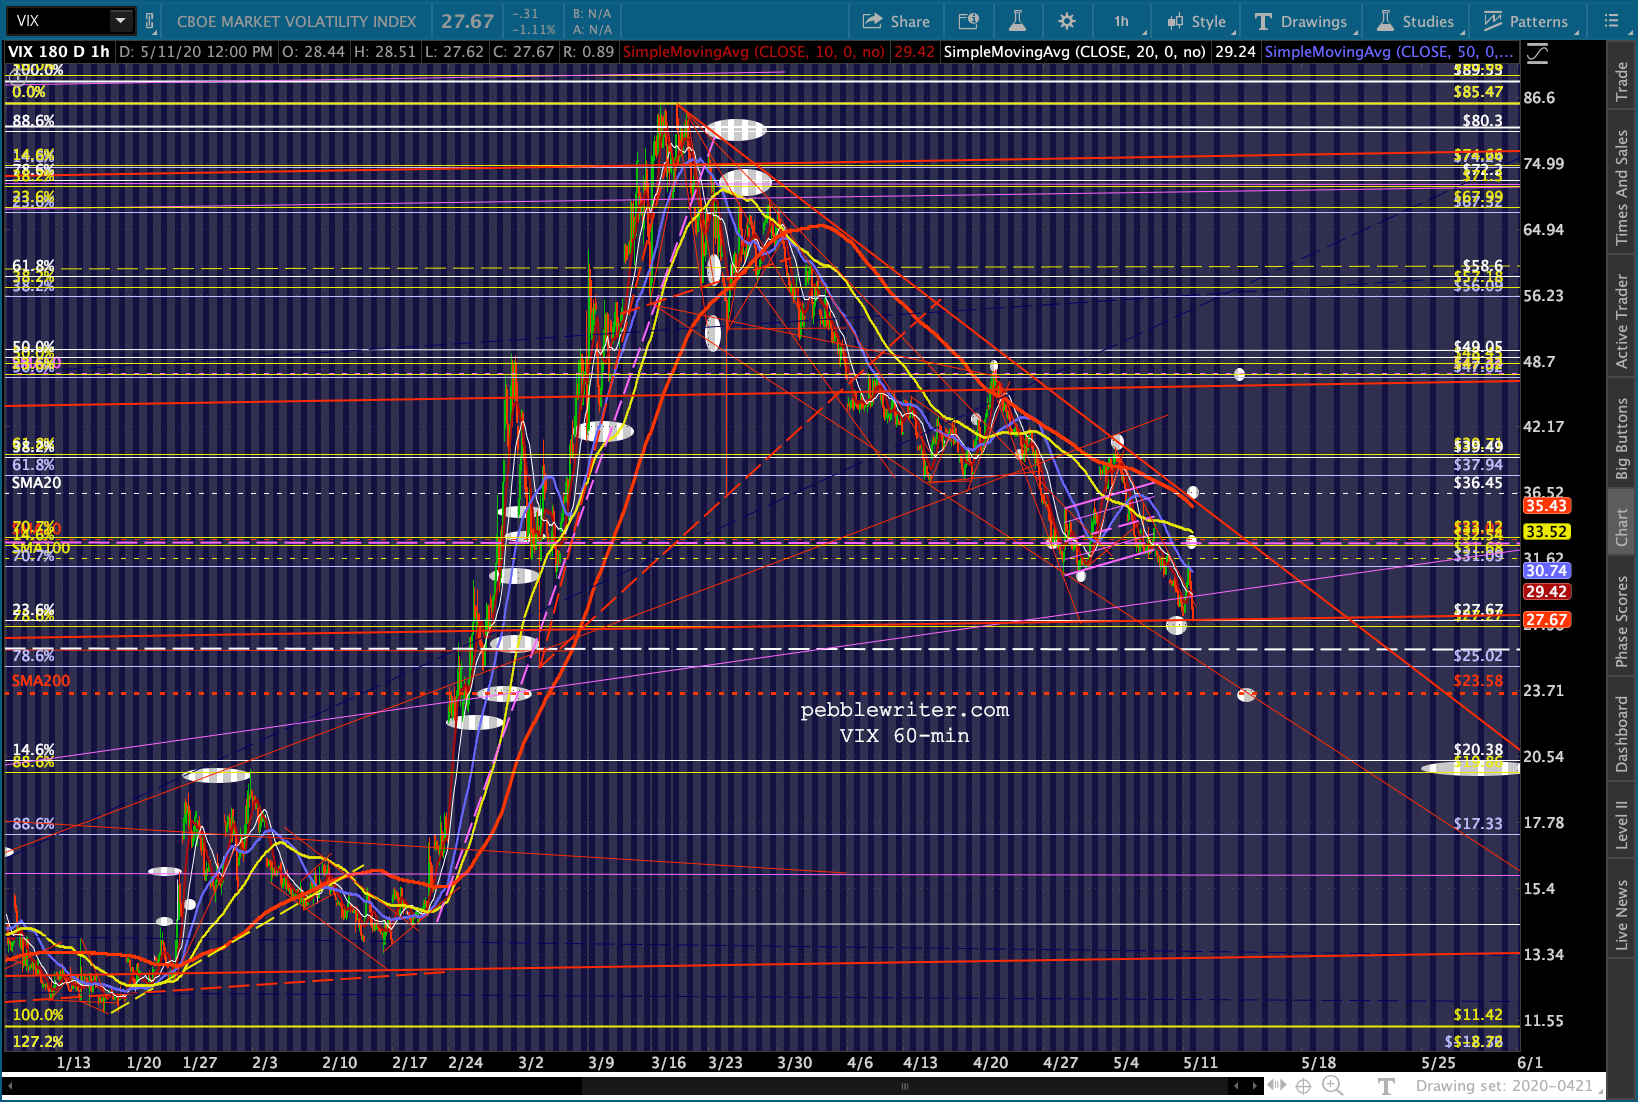
And, just like that, VIX has broken down and is back in the red and approaching the .786 at 27.27. If it breaks below the red TL at 27.63ish, that would likely drive SPX above its purple .886 at 2936.96. Otherwise, we can look for a potential reversal for SPX just like ES did last night. Do or die time for the downside case…
 To complicate things for bears, the 2Y is back above 17 bps.
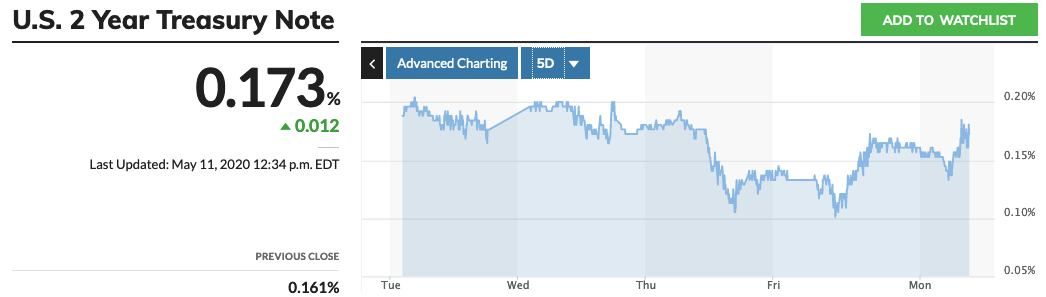 And the 10Y has also bumped higher to maintain the 54 bps 2s10s.
 UPDATE: 3:41 PM
Another exciting day here in algo-land…
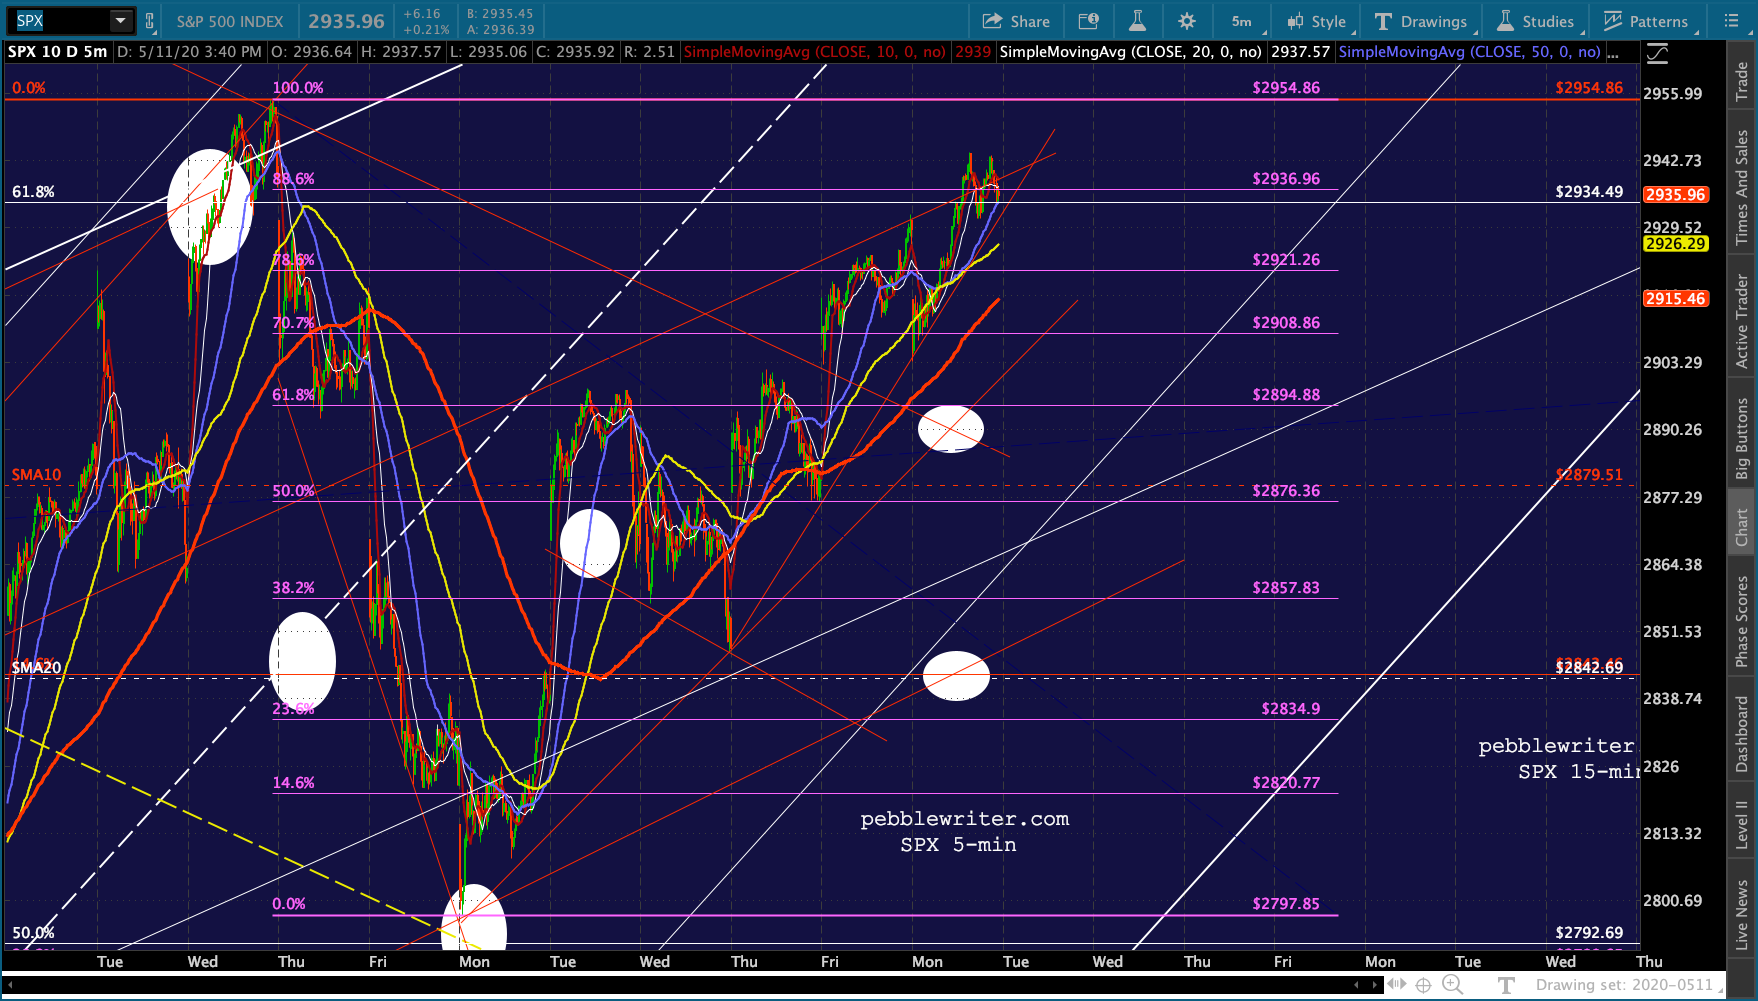
 VIX is threatening a drop through the .786. In fact, every time it dips slightly below it, SPX pushes slightly above its .886.
 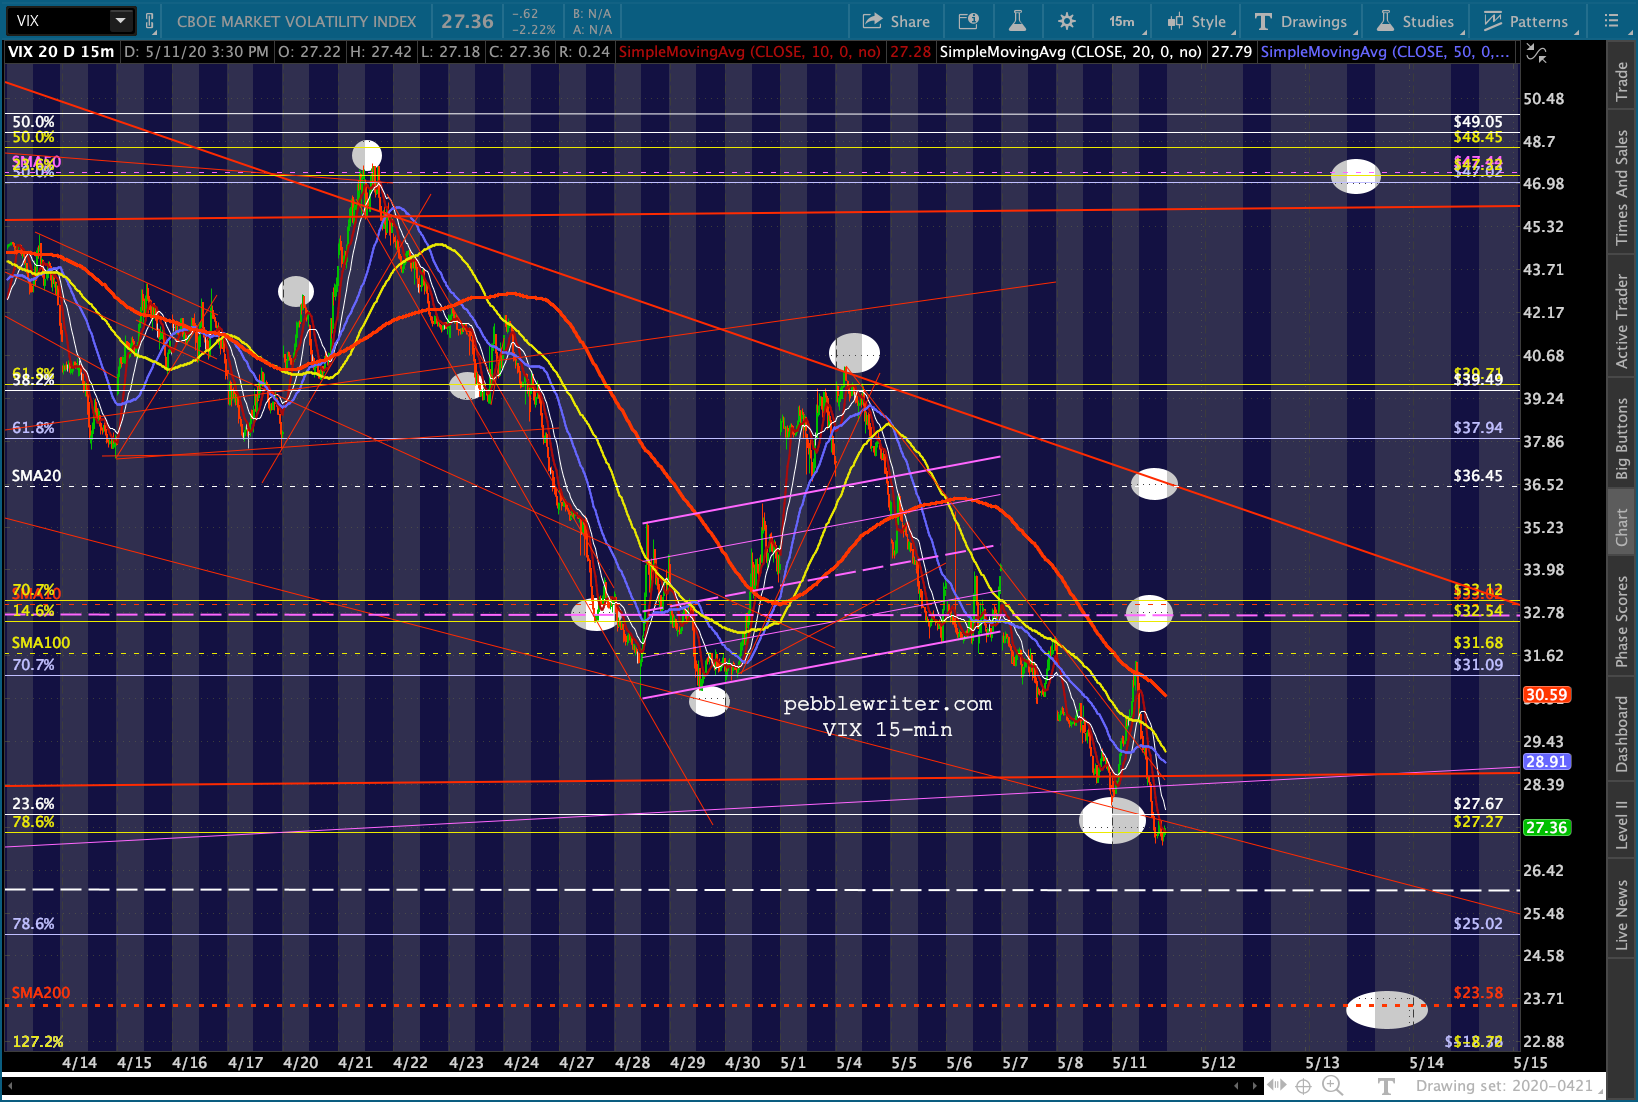 CL and RB are still threatening higher highs.
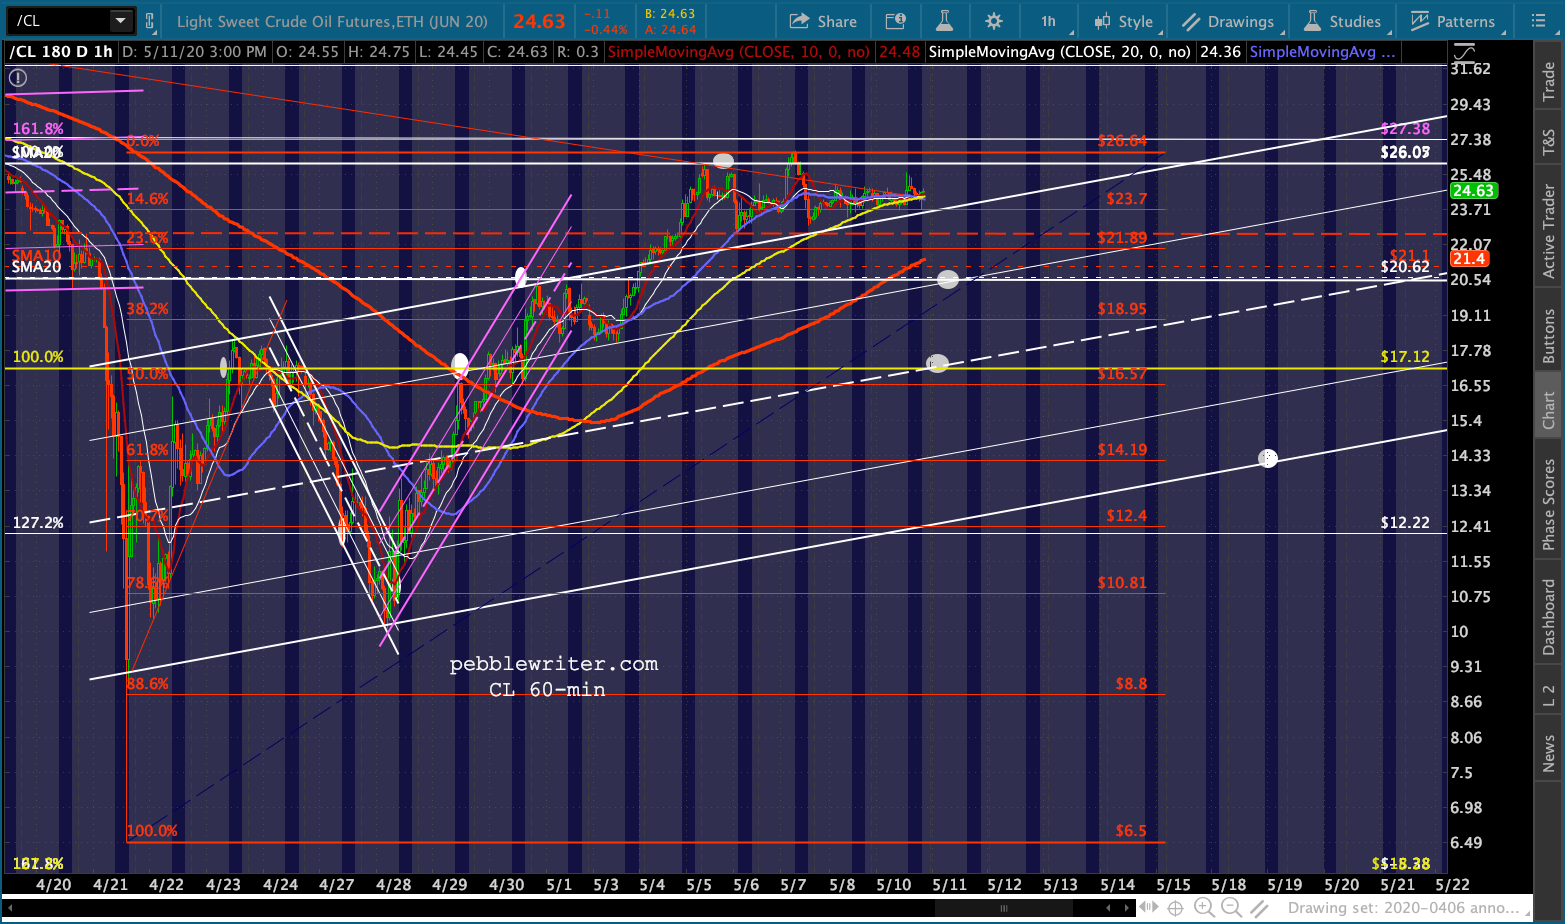
And, USDJPY certainly still looks likely to test its SMA200.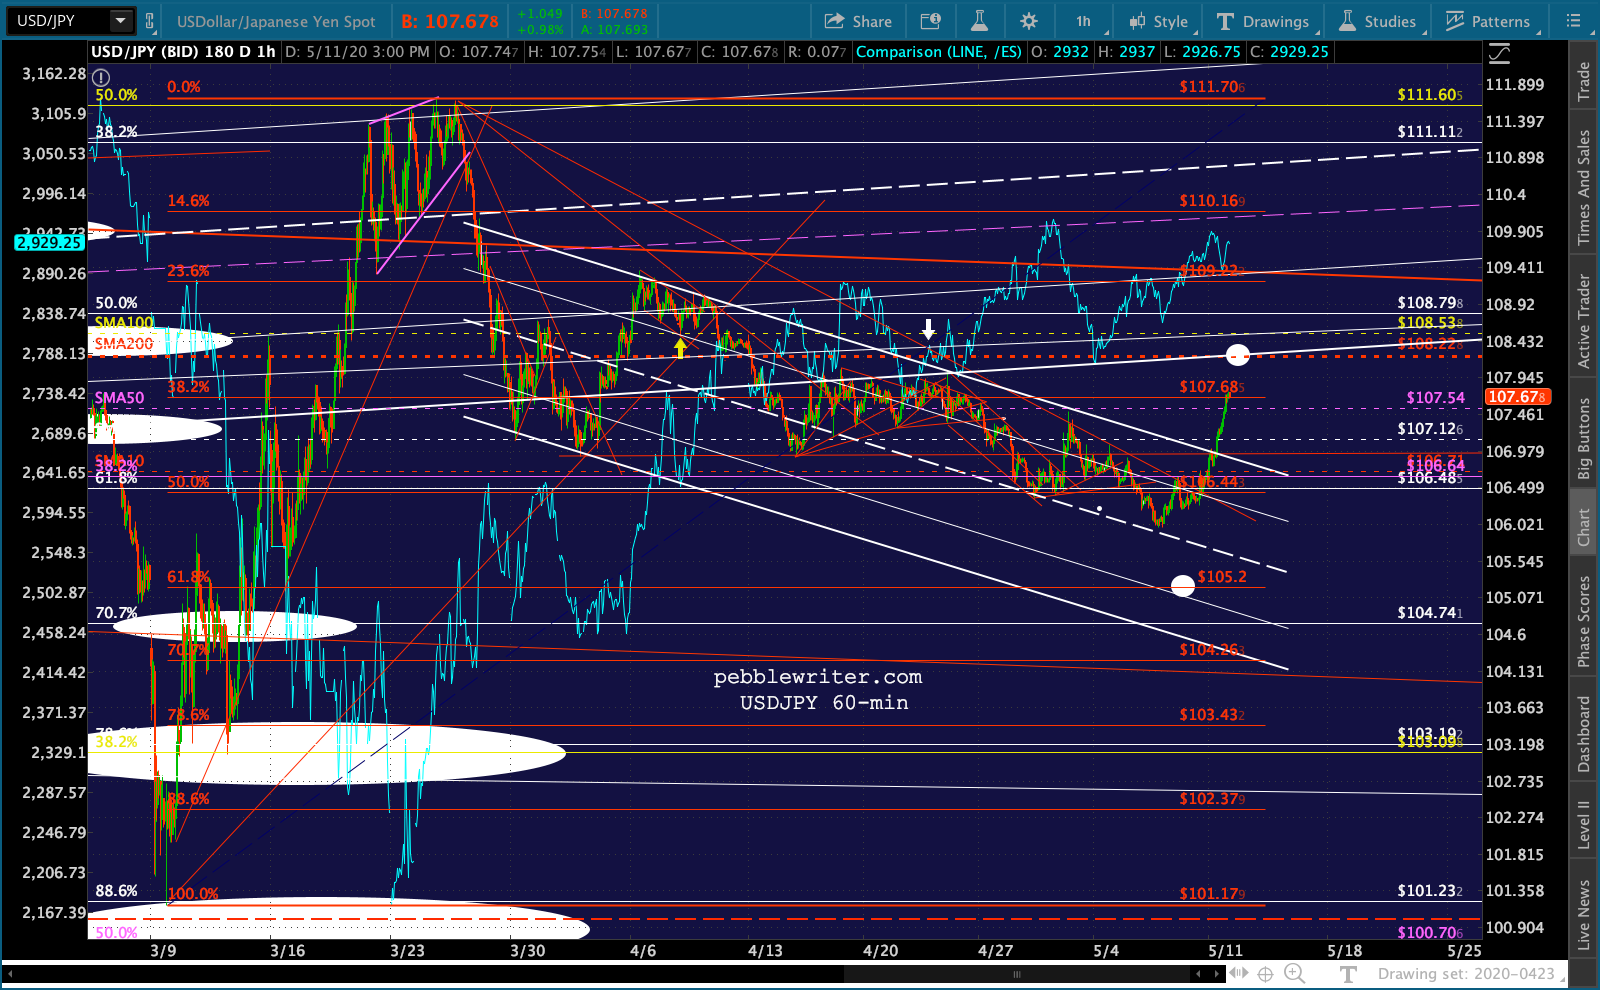 The 2Y has pushed well above the 17bps resistance, but the 10Y is keeping pace – which has allowed 2s10s to remain exactly on target at 53bps.
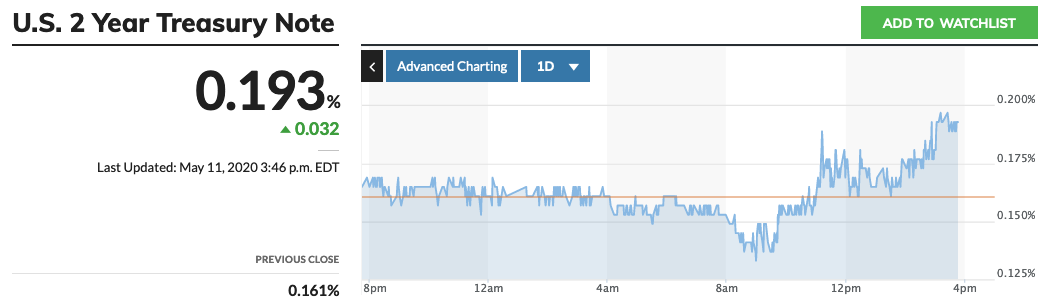
 To sum up…it would have been a great day to do anything other than trade. This feels very much like OPEX – which is this Friday. But, last week felt like this too. I’d rather be stung by a swarm of murder hornets than go through a whole week of this crap!