Posts

  • Stagflation Case Strengthens

    December retail sales disappointed, slumping 1.9% MoM and capping off a week of economic data which provided growing evidence of stagflation. The data were before nominal, meaning inflation-adjusted data were even worse. This is hardly surprising given that ever greater portions of Americans’ incomes are being consumed by rapidly rising prices.

    Futures, which were already off sharply, legged down further on the news.

    Our equity targets remain unchanged.

    continued for members(more…)

  • PPI at All-Time Highs

    If PPI is growing at 9.8% annually (a record high) while CPI is growing at 7% annually (a 39-year high), who’s eating the difference between what producers bring in and what they must pay out? Just a hypothetical, of course, as profits – like inflation – apparently aren’t that important. Futures are higher on the news.

    Meanwhile, DXY is breaking down – which will add fuel to the inflationary fires.continued for members(more…)

  • New Highs for CPI

    December headline CPI rose at 7.0% annually, its fastest rate since June 1982 when the 10Y yielded 14.44%.

    The index for all items less food and energy rose at 5.5% annually, its largest increase since February 1991.  Both indices showed broad-based increases with almost all categories – most of which are sticky and not prone to declines – registering multiples of the Fed’s traditional 2% target.

    Energy continues to lead the charge, though as expected, its YoY increase continues to ebb.

    Algos, driven by the usual well-timed collapse in vol and a bump in oil/gas, are up moderately even after data that does nothing to alter the Fed’s taper and rate hike plans.

    continued for members(more…)

  • Charts I’m Watching: Jan 11, 2022

    The broader markets reversed sharply yesterday as soon as COMP reached our downside target – just below its 200-day moving average. Yet, the futures are having trouble moving back above their 50-day. Long a source of support, it is now overhead resistance. Tighten your seat belts.

    continued for members(more…)

  • Update on COMP: Jan 10, 2022

    In a world of overpriced equities, the NASDAQ Composite has stood head and shoulders above the other indices.  It rallied 244% from its March 2020 lows, finally topping in November 2021 before running out of steam. Note that it hasn’t tagged its 200-DMA since April 21, 2020.

    This morning, it tagged our 14,575 target [see: Jan 6 COMP Update], an ignominious drop of 10.4% so far.As I wrote last week, the bulls had better hope it holds.

    continued for members(more…)

  • 10Y Breaks Out

    If this were NASA instead of the FOMC, we’d say they’ve screwed the pooch. The 10Y’s breakout suggests the Fed has lost control not only of the bond market but the entire narrative surrounding inflation. As we discussed last week [see: The 10Y’s Warning] this development will have significant repercussions for stocks.

    Futures continue their slide, with CPI due out on Wednesday.Our downside targets remain in force.

    continued for members(more…)

  • The 10Y’s Warning

    10Y yields briefly poked above the Mar 2021 highs, adding to the drama surrounding next week’s CPI report.

    Meanwhile, December NFP came in at +199K, less than half consensus, while the unemployment rate dipped to 3.9% and wages continued to strengthen.  Remember, this was all pre-omicron.

    Futures were not amused. While ES held its 50-DMA yet again, we get the sense it won’t be for long. continued for members(more…)

  • One Way or Another

    There are lots of reasons for interest rates to decline. Inflation expectations could fall. Economic growth could slow. A central bank could pump trillions of dollars into buying up debt.  They’re all effective, but they all take time and involve nasty consequences.

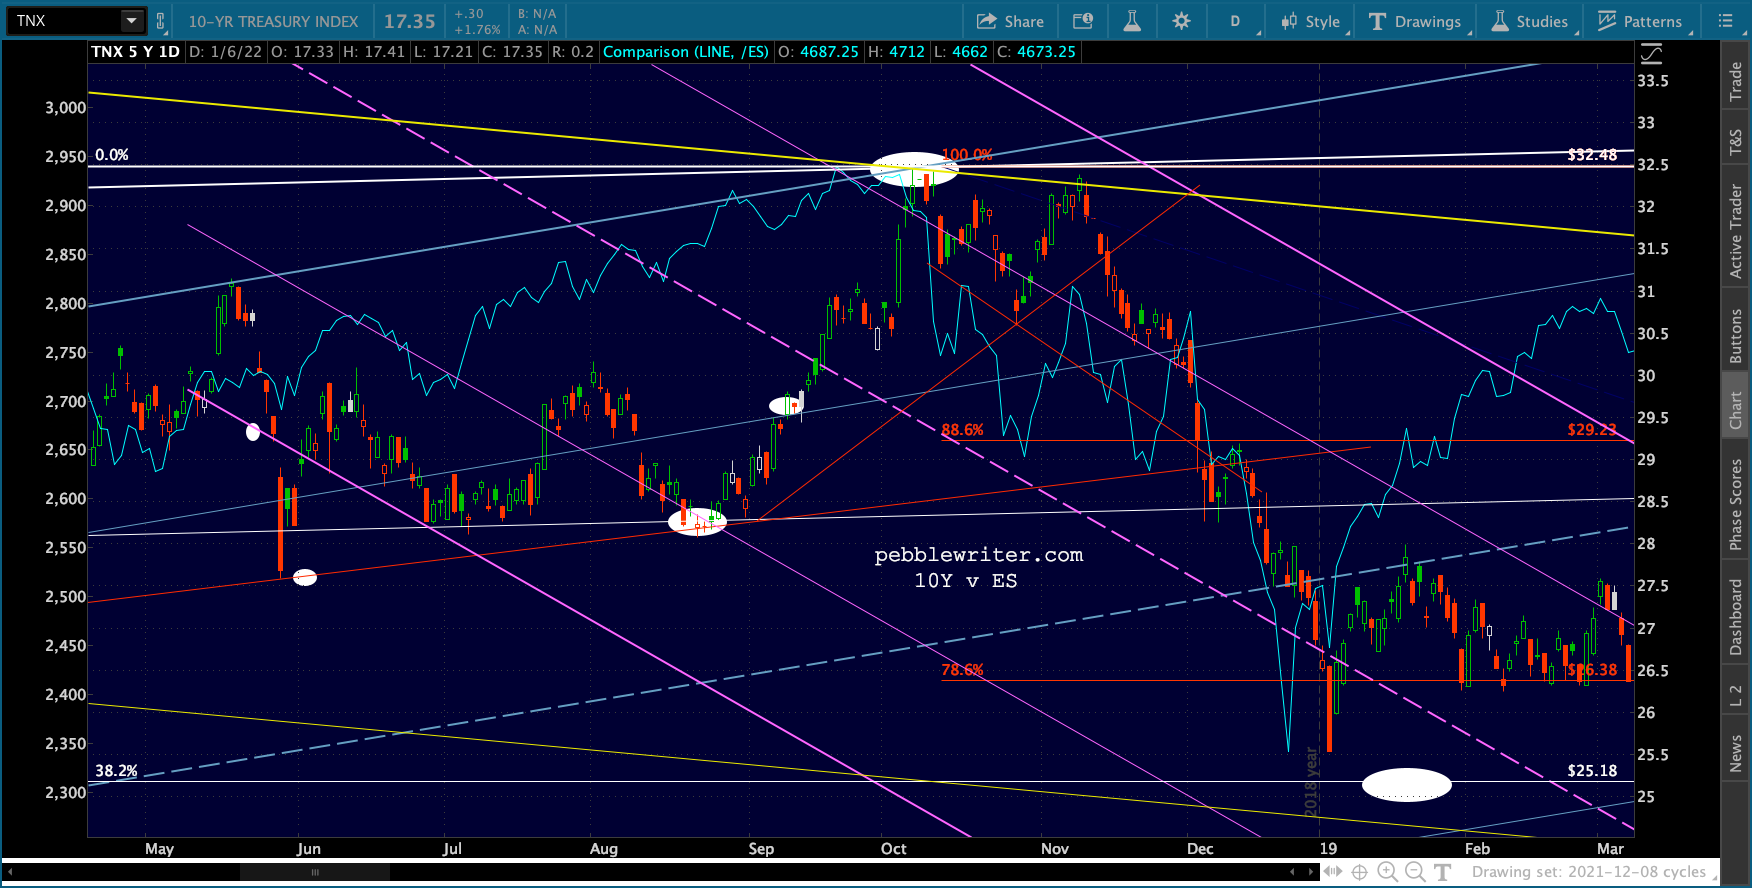
    When it comes to a rapid response, nothing can hold a candle to an equity correction – the scarier the better – that sends equity investors running for the fixed-income hills. We saw this occur at the end of 2018 and in early 2020 – the scene of 21% and 35% corrections respectively.

    In the first case, the 10Y fell from 3.25% to 2.55% during roughly the same period. In 2020, the 10Y plunged from 1.64% to 0.4% in less than a month.

    Following the 2020 plunge, economic activity was thought to be low enough to keep inflation expectations in the cellar. But, it’s difficult to distinguish between inflation expectations and the doubling of the Fed’s balance sheet from $4.3 to $8.6 trillion (as of Dec 2021.)

    The 10Y followed rebounding inflation until topping out at 1.765% in March 2021 – about the same time the Fed began pounding the “transitory” drum.  Since then, the 10Y has slumped as low as 1.13% before clawing its way back to today’s high of 1.74%.Conventional wisdom has it that rates will continue going higher, perhaps much higher, as the Fed employs its “tools” to combat inflation. This is a reasonable assumption, particularly since the Fed’s taper impacts its ability to buy up treasuries.

    And, a timely decline in inflation such as we saw in late 2018 is thought to be unlikely [more a shortage of volunteer journalists rather than supply constraints.] Even if oil prices were to crash, it’s unclear whether other, stickier components of inflation would respond very quickly, if at all.

    That leaves us with the interesting prospect of a market correction that’s scary enough to bring rates down off the ledge, but not so scary that real damage is done. The current taper schedule means QE will end in March. So, there’s plenty of time to to put such a plan into place before the Fed would be expected to start raising rates significantly.

    Stay tuned.


  • Update on COMP: Jan 6, 2022

    In our last update on the NASDAQ Composite [see: Nov 4 Update] we called a top and forecast a drop to the 200-day moving average, then at 14,181.

    If this channel holds, then the push past the 3.618 will reverse itself and the index would be susceptible to significant downside. I suspect COMP is going through the same exercise as SPX, DJIA, etc: Don’t tag the SMA200 until it represents a higher low than the last one. In this case, that would be the Oct 4 low of 14181.

    As it turned out, we were two weeks and 1.5% early. During those two weeks, the 200-DMA’s rose from 14,210 to 14,661. But, it remains our next downside target – a 9.6% drop rather than the 11.2% one originally anticipated. The bulls had better hope it holds.

    continued for members(more…)

  • FOMC: No Way Home

    Markets are mixed as investors await the Fed’s December minutes due out this afternoon. Bulls, fingers crossed, are hopeful the minutes will shed light on the Fed’s plan to reduce inflation (aka the Grinch who stole QE) without ravaging stocks. Bears, fresh off their it-ain’t-transitory victory lap, are wondering whether their time has finally come.

    To understand where the rubber meets the road, we turn to the 10Y.  Easily subdued over the past year by the Fed’s trillions in hush money, it might soon become reacquainted with the concept of price discovery – if the Fed doesn’t lose its nerve.

    We know the Fed is nervous because they are finally speaking out about that pesky second mandate: price stability.  Founded in 1913, the Fed had no such mandate until the 1977 Reform Act, passed in response to debilitating stagflation, called into question the conduct of monetary policy.

    The act directed the Fed to ”maintain long run growth of the monetary and credit aggregates commensurate with the economy’s long run potential to increase production, so as to promote the goals of maximum employment, stable prices, and moderate long-term interest rates.”

    Pretending that inflation wasn’t rising didn’t go over so well. Neither did replacing the 2% PCE target with a target range. And, assuring folks that inflation was transitory (a term Powell never actually defined) has literally failed the test of time.

    The problem, of course, is that if price discovery rears its ugly head interest rates might recouple with inflation. This wouldn’t matter so much if we only had a few trillion in debt. But, with debt slated to top $30 trillion in the next few months, the Fed faces a very big problem.

    continued for members(more…)