December headline CPI rose at 7.0% annually, its fastest rate since June 1982 when the 10Y yielded 14.44%.
 The index for all items less food and energy rose at 5.5% annually, its largest increase since February 1991. Both indices showed broad-based increases with almost all categories – most of which are sticky and not prone to declines – registering multiples of the Fed’s traditional 2% target.
 Energy continues to lead the charge, though as expected, its YoY increase continues to ebb.
 Algos, driven by the usual well-timed collapse in vol and a bump in oil/gas, are up moderately even after data that does nothing to alter the Fed’s taper and rate hike plans.
 continued for members…
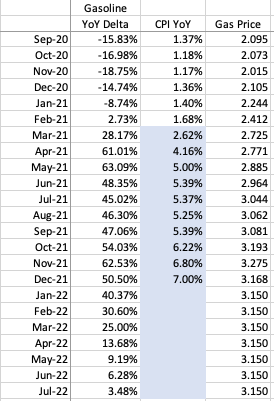
I must emphasize that even with the recent rise in oil/gas prices, the YoY increase in gas prices in particular continue to fall. If, as we expect, prices were to stabilize in this range, energy would theoretically lead inflation lower over the coming months. The chart below assumes that regular gas prices hold steady at the January average of 3.15 per gallon.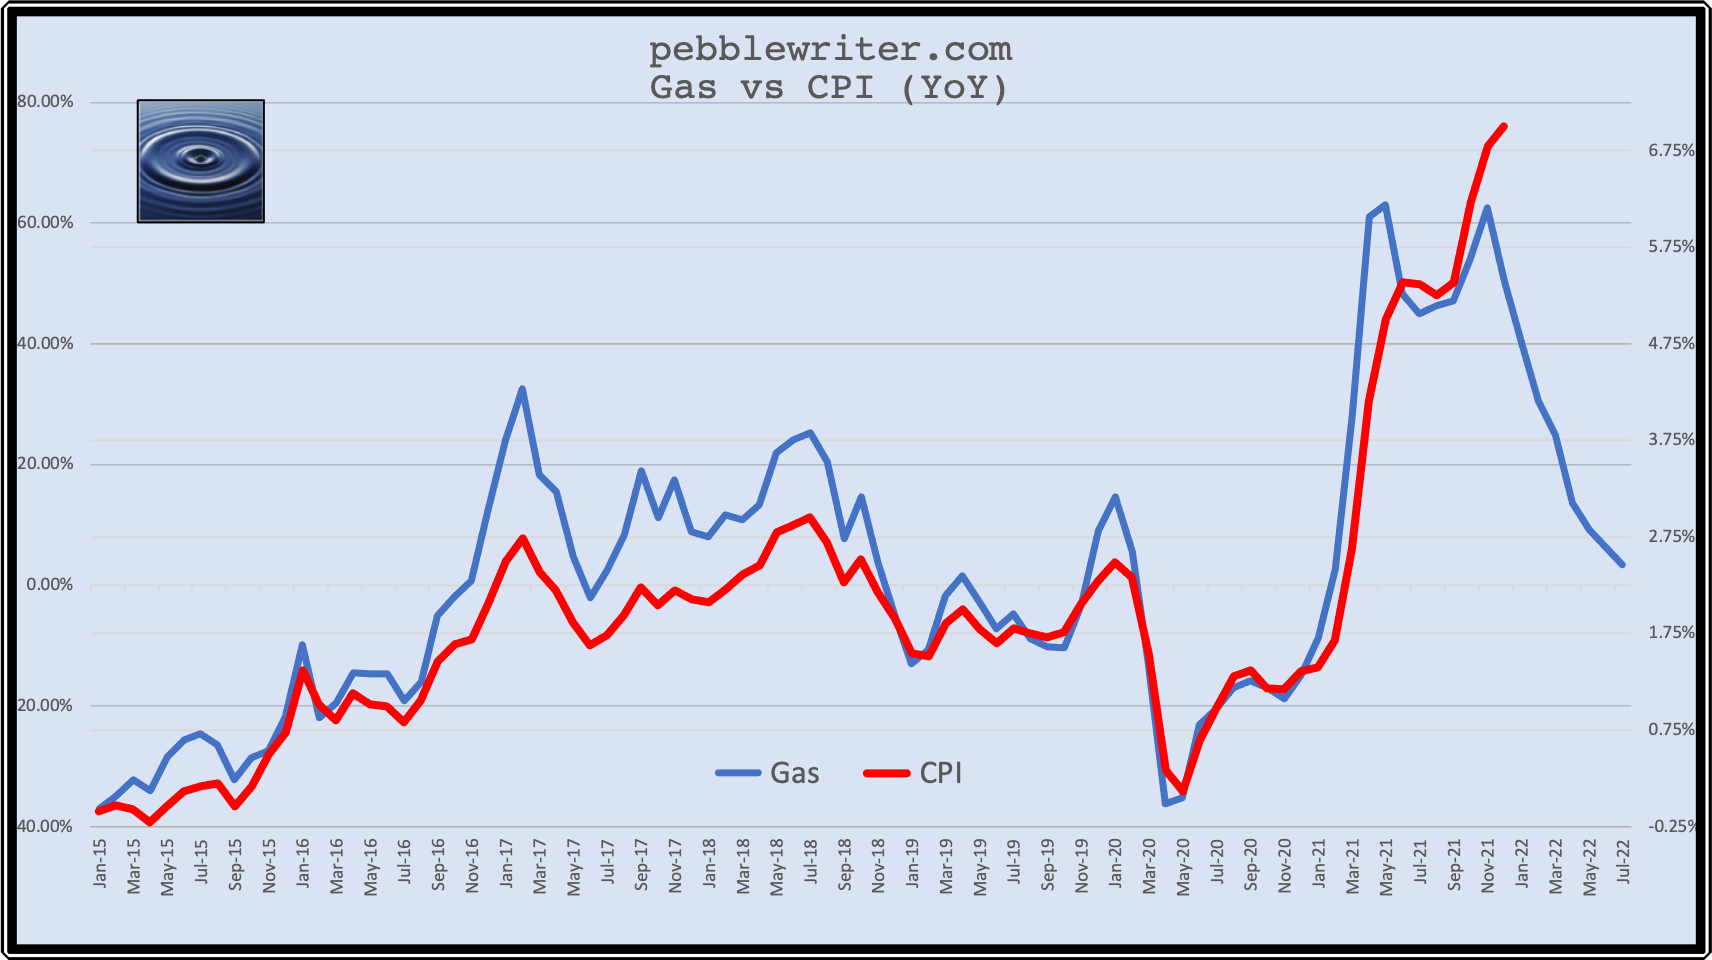 A decline in oil and gas alone, however, will not cause a commensurate decline in CPI. As the chart above illustrates, the very close correlation of the past 5 years changed in November when the gas delta peaked at 62.5% and the EIA’s reported average monthly price peaked at 3.275.
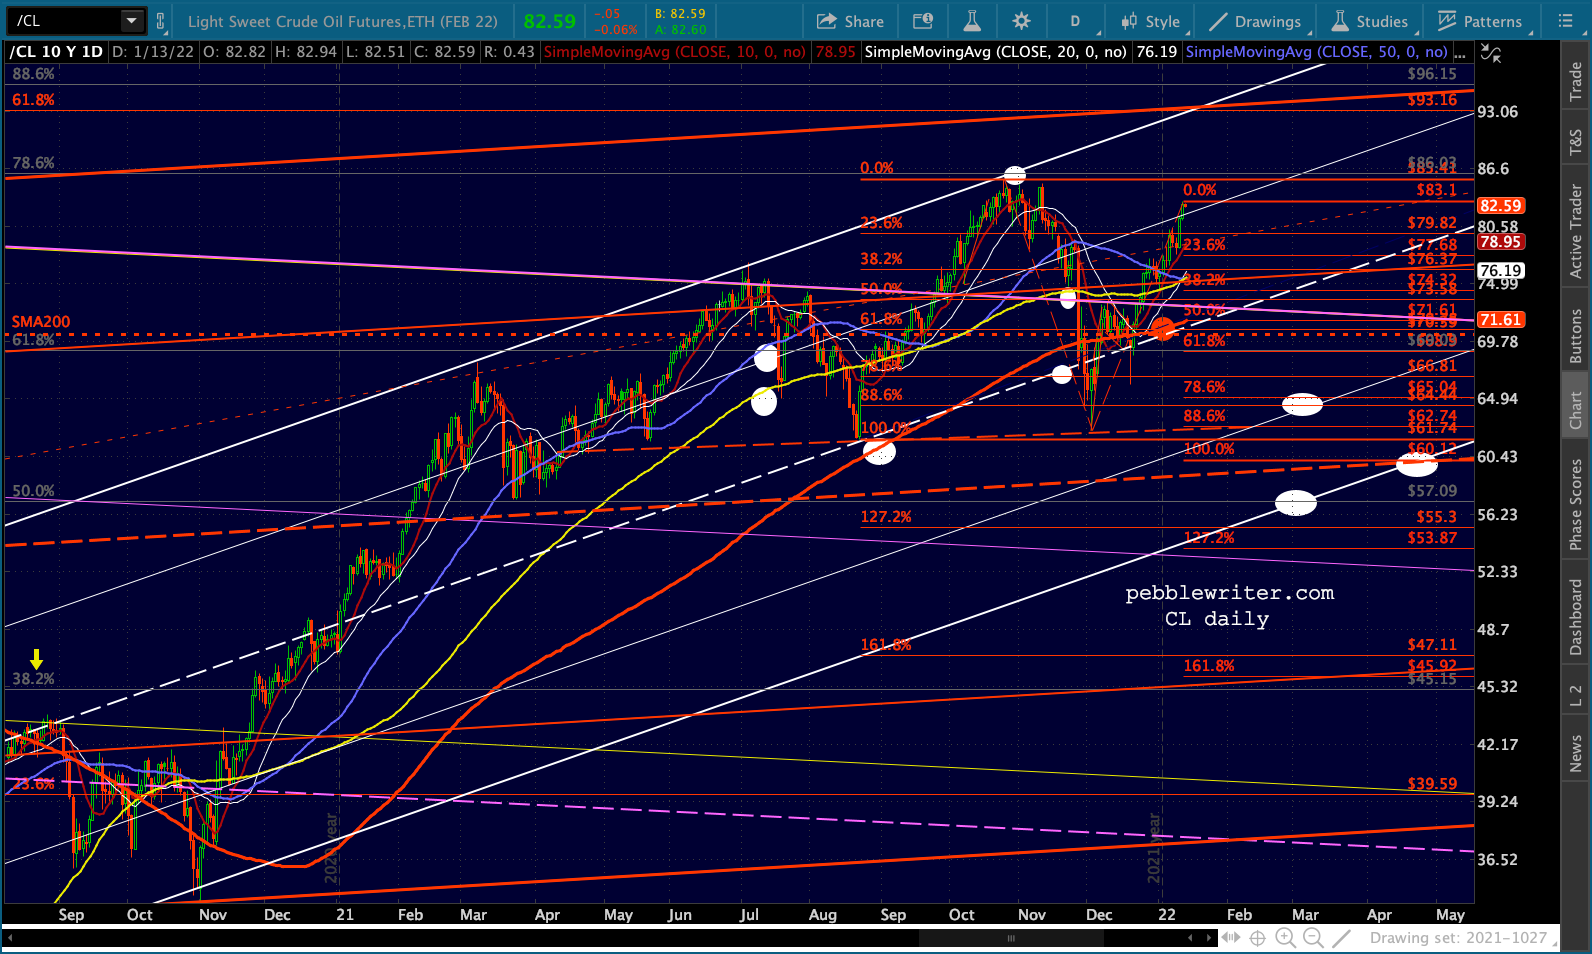
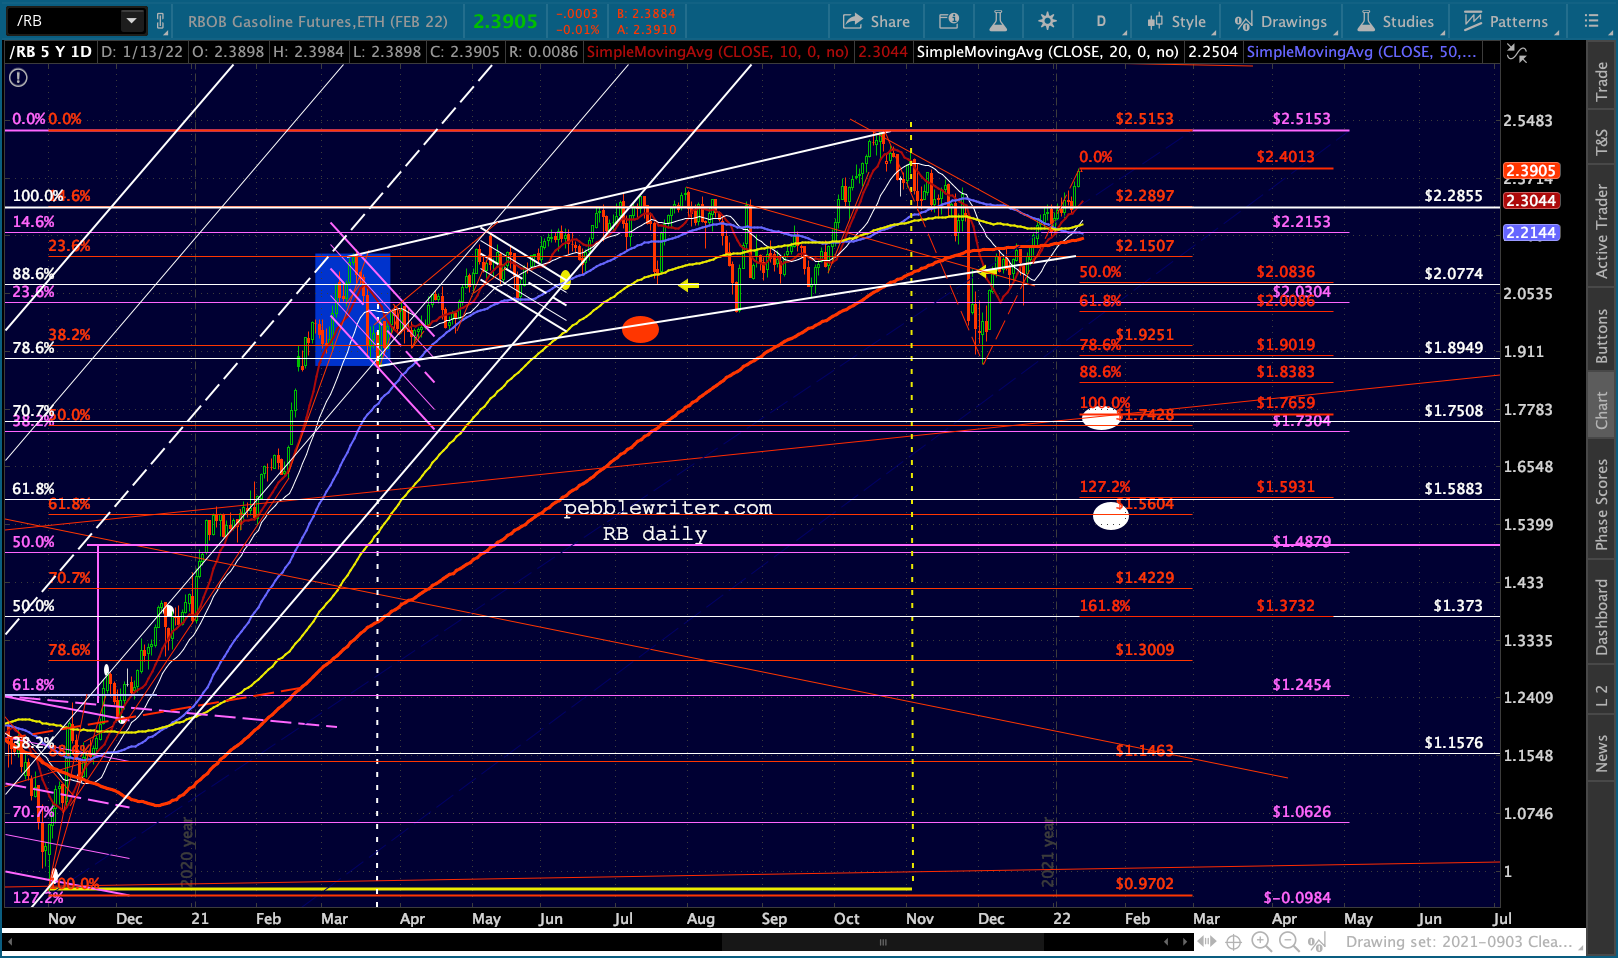
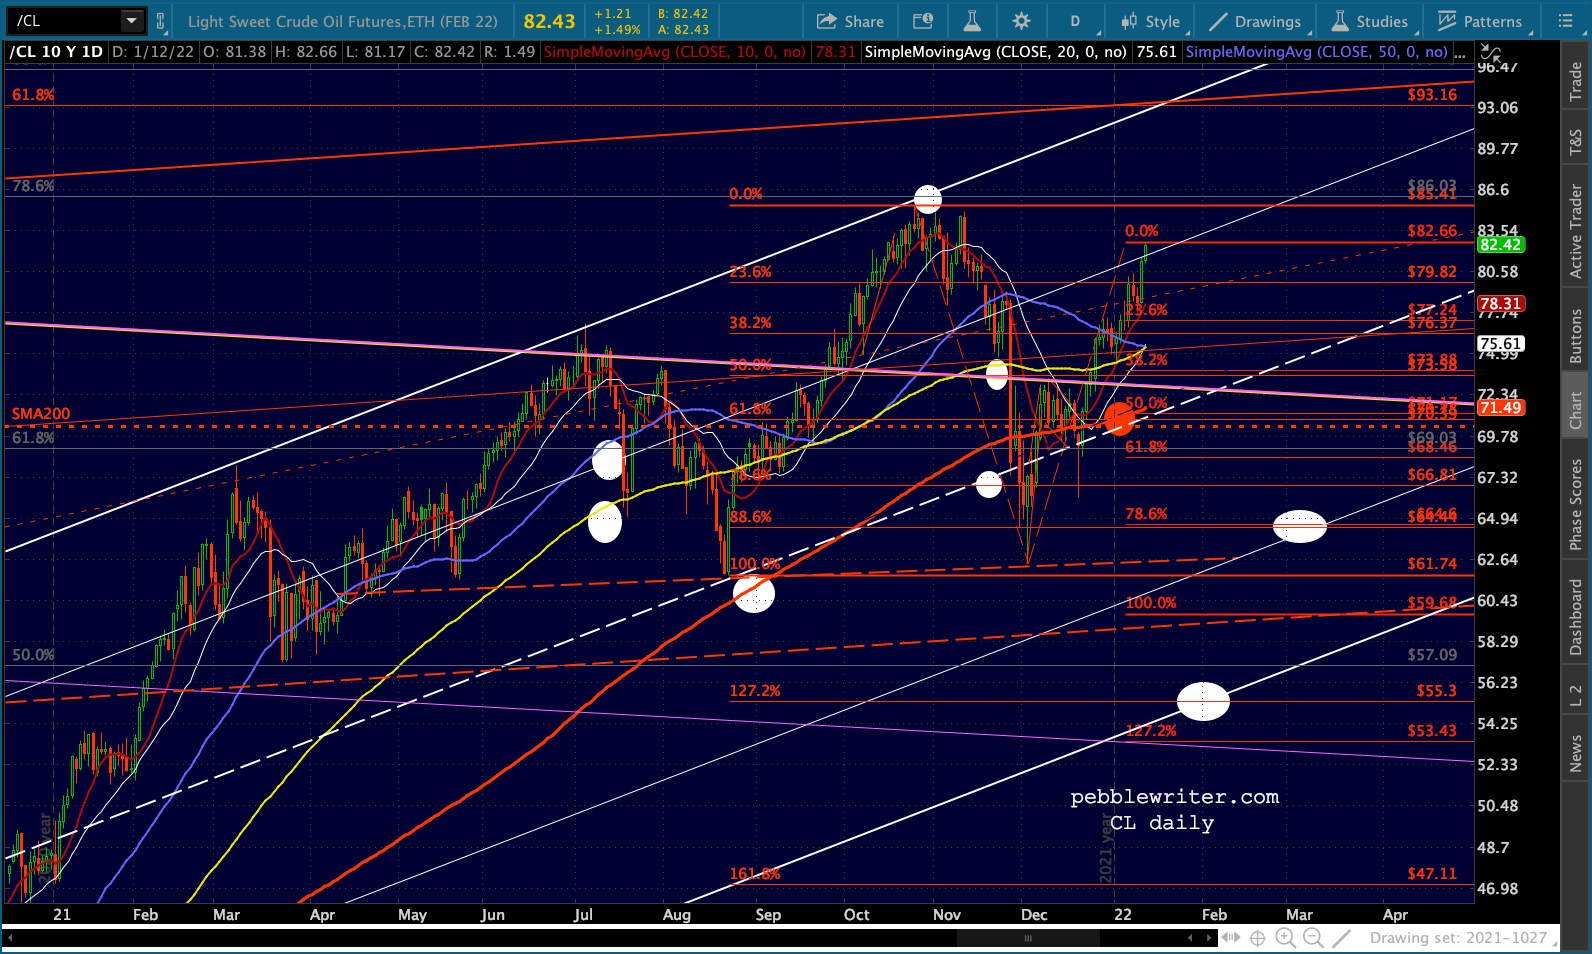
 I continue to expect CL and RB to level off in order to effect the above scenario. Though, as we’ve seen, it wouldn’t surprise me if we continue to see large swings that reflect the uncertainties in the fundamental picture and the periodic need to boost stocks.
 This divergence opens up a nasty can of worms for the Fed, which has always been able to rely on a decline in oil/gas prices to reduce inflation and interest rates. This time, of course, they have had to rely on their own treasury purchases which send rates lower at a time when they should be soaring.
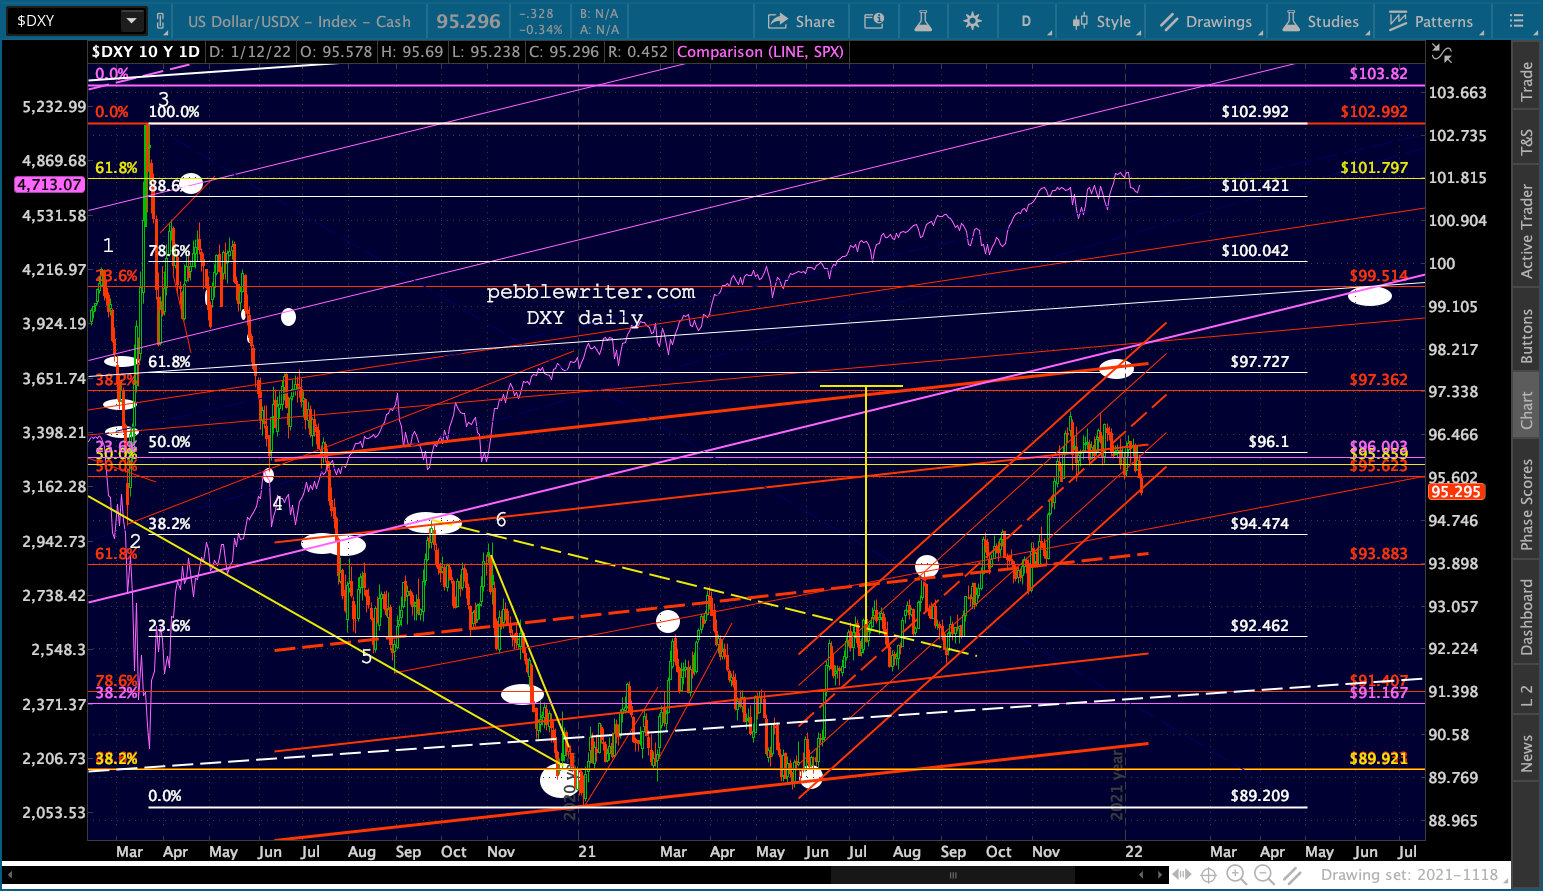
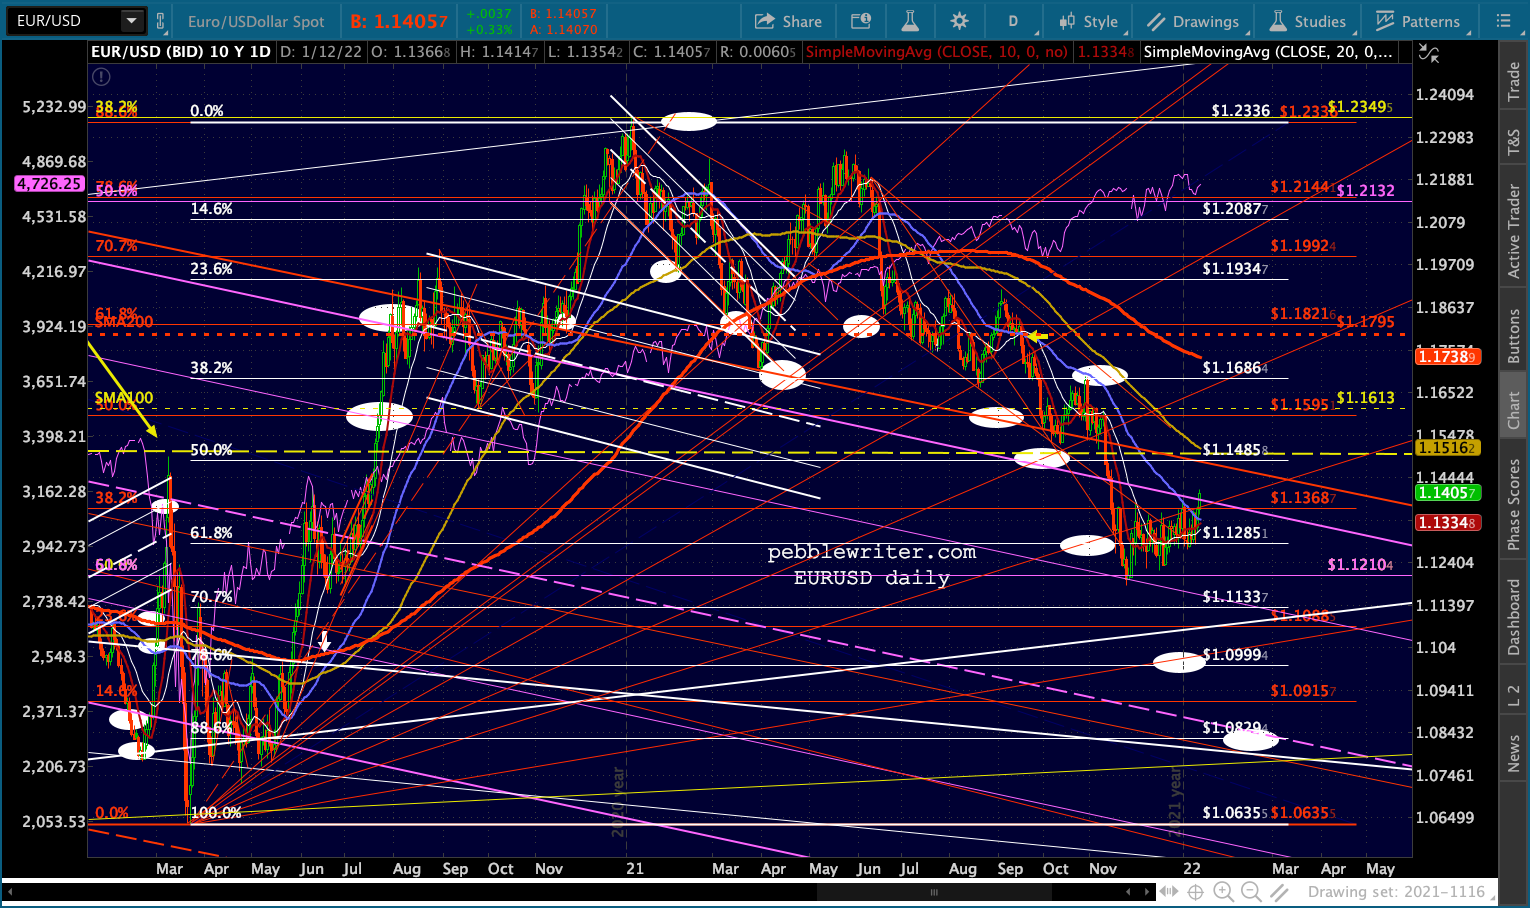
This morning’s action is yet another example. Despite the highest inflation in 40 years, the 10Y yields are ticking lower. It’s hard to imagine anyone other than the Fed doing whatever purchasing is going on.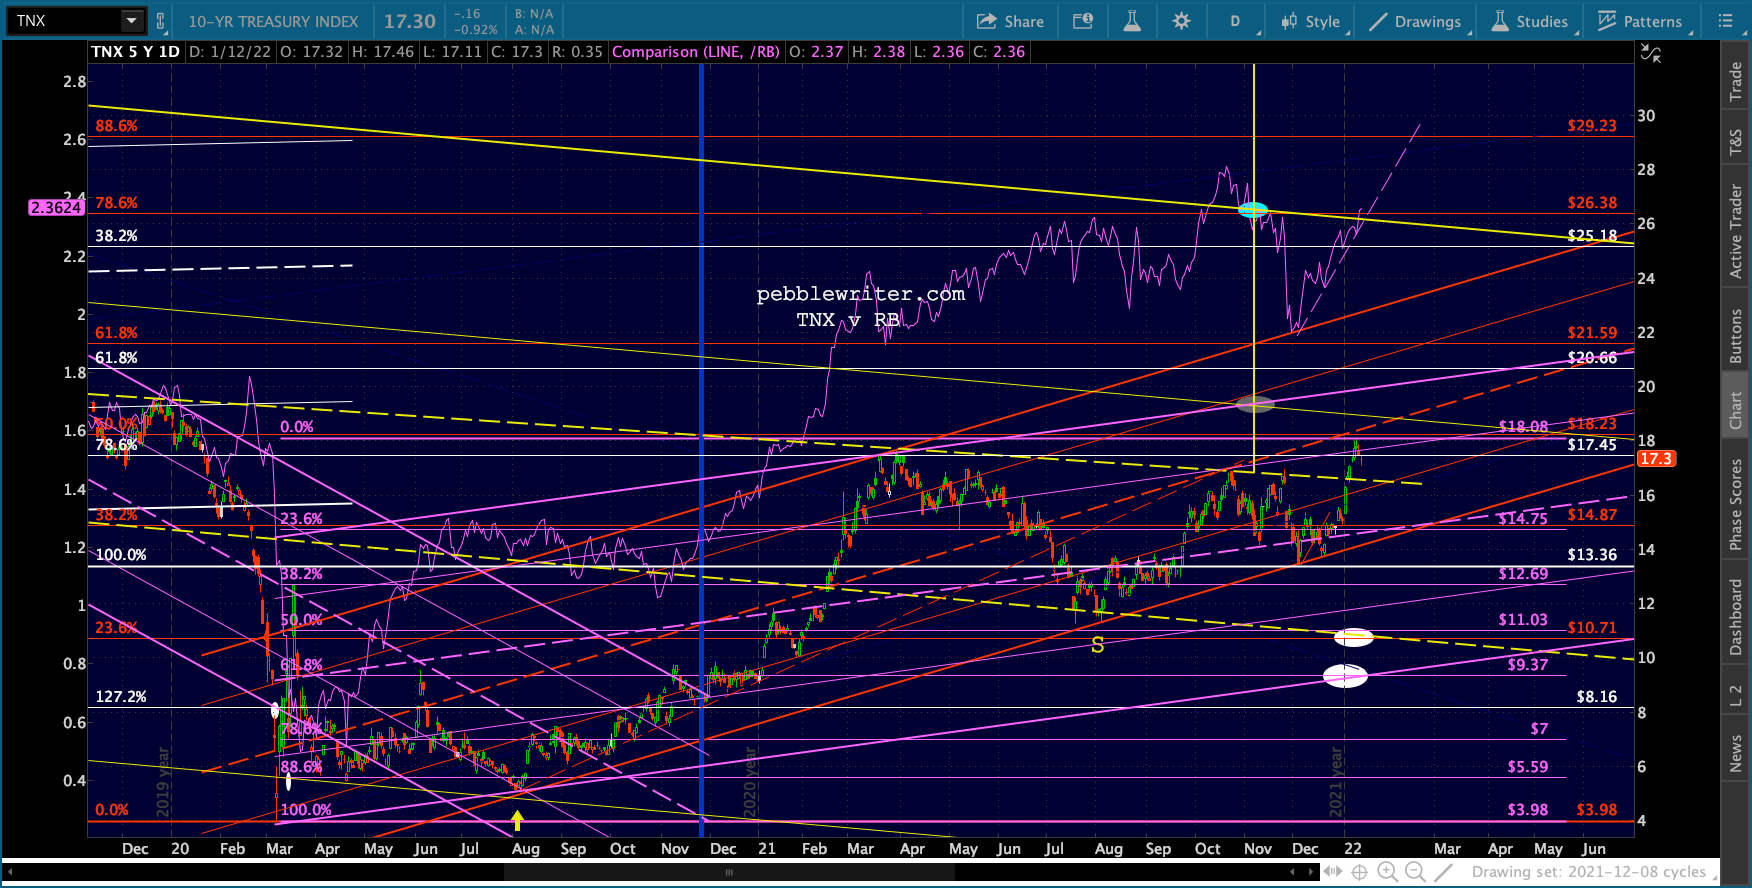 The whole point, of course, is to keep pressure on the dollar so that stocks continue their climb. While good for the stock market, the falling DXY and rising EURUSD exacerbates the inflation problem as it increases the price of imported goods. In other words, this decline can’t last any more than the oil/gas rally can.
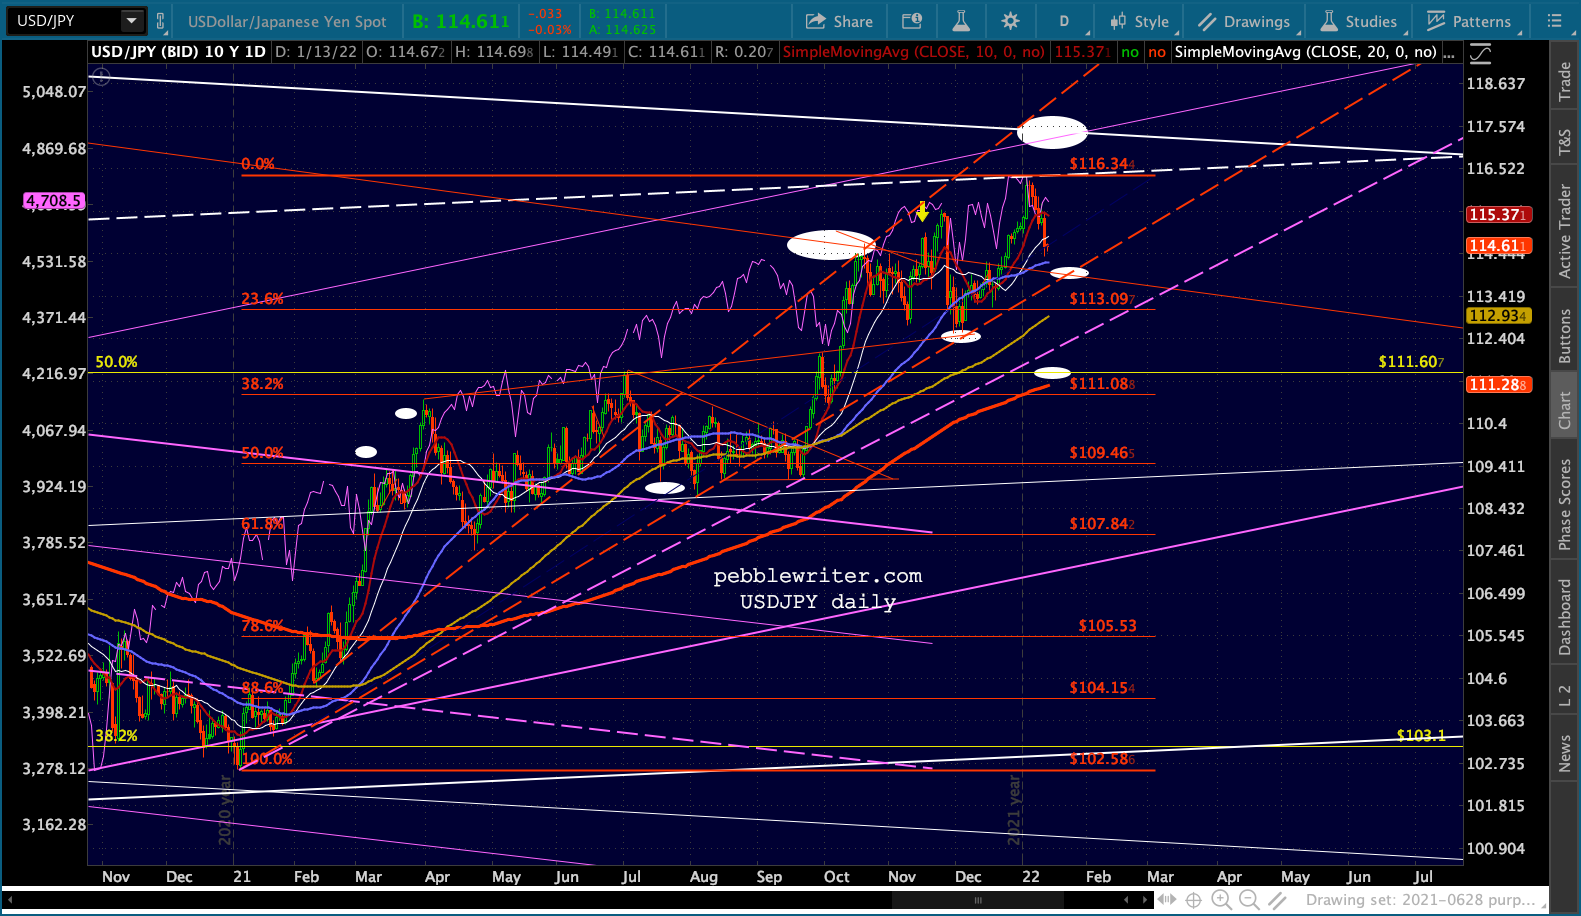
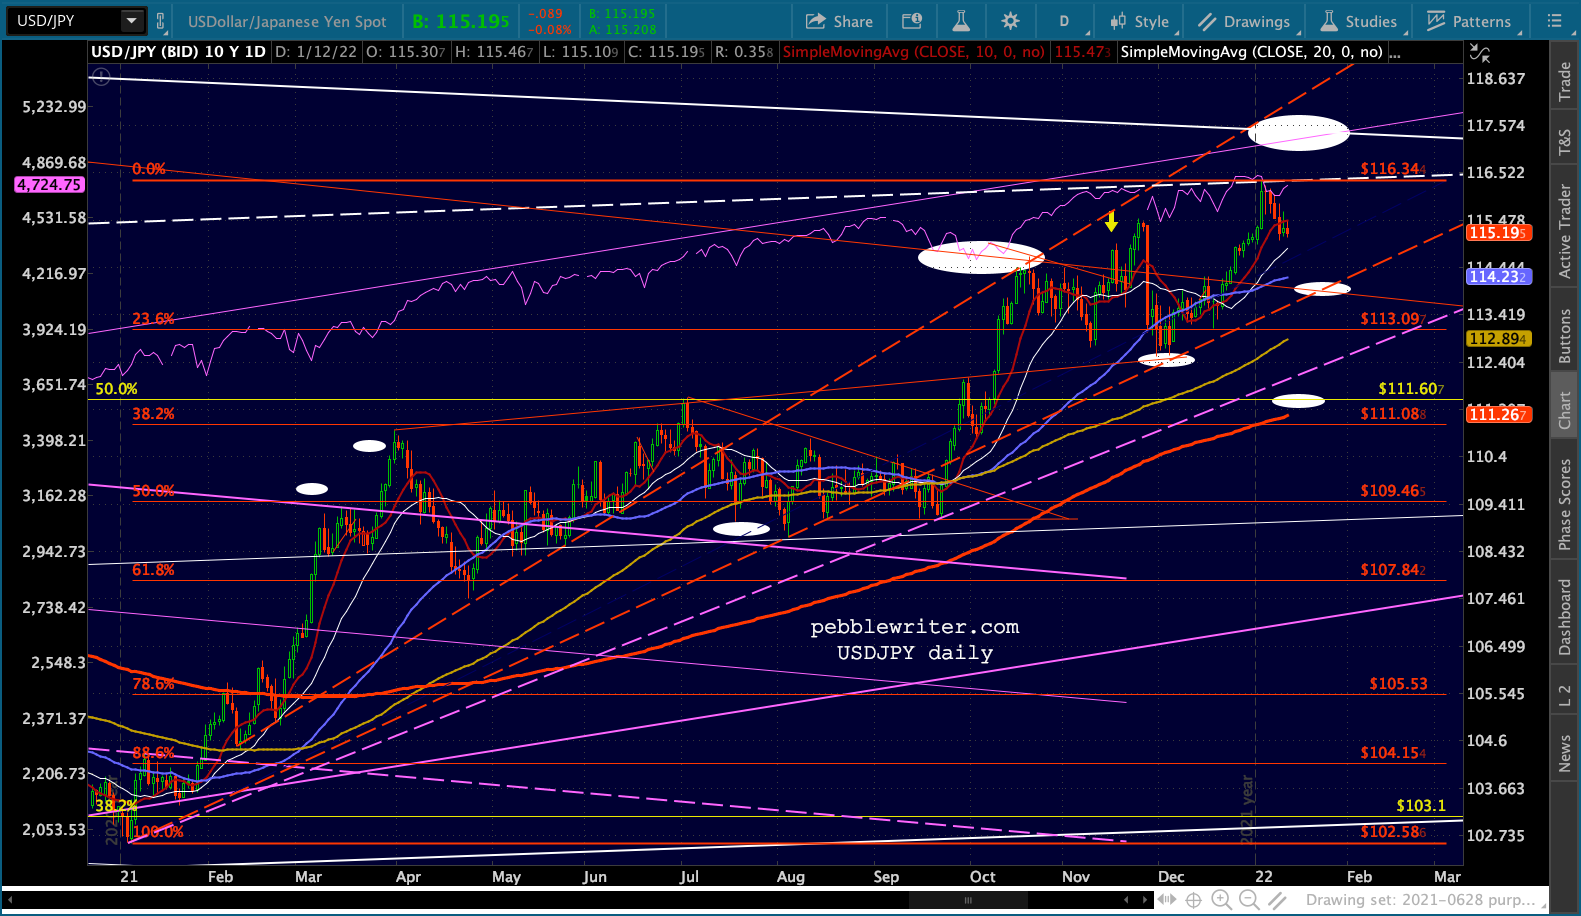
 The rising USDJPY has it right, though a sharp drop is still in the cards if/when an equity correction ramps up.
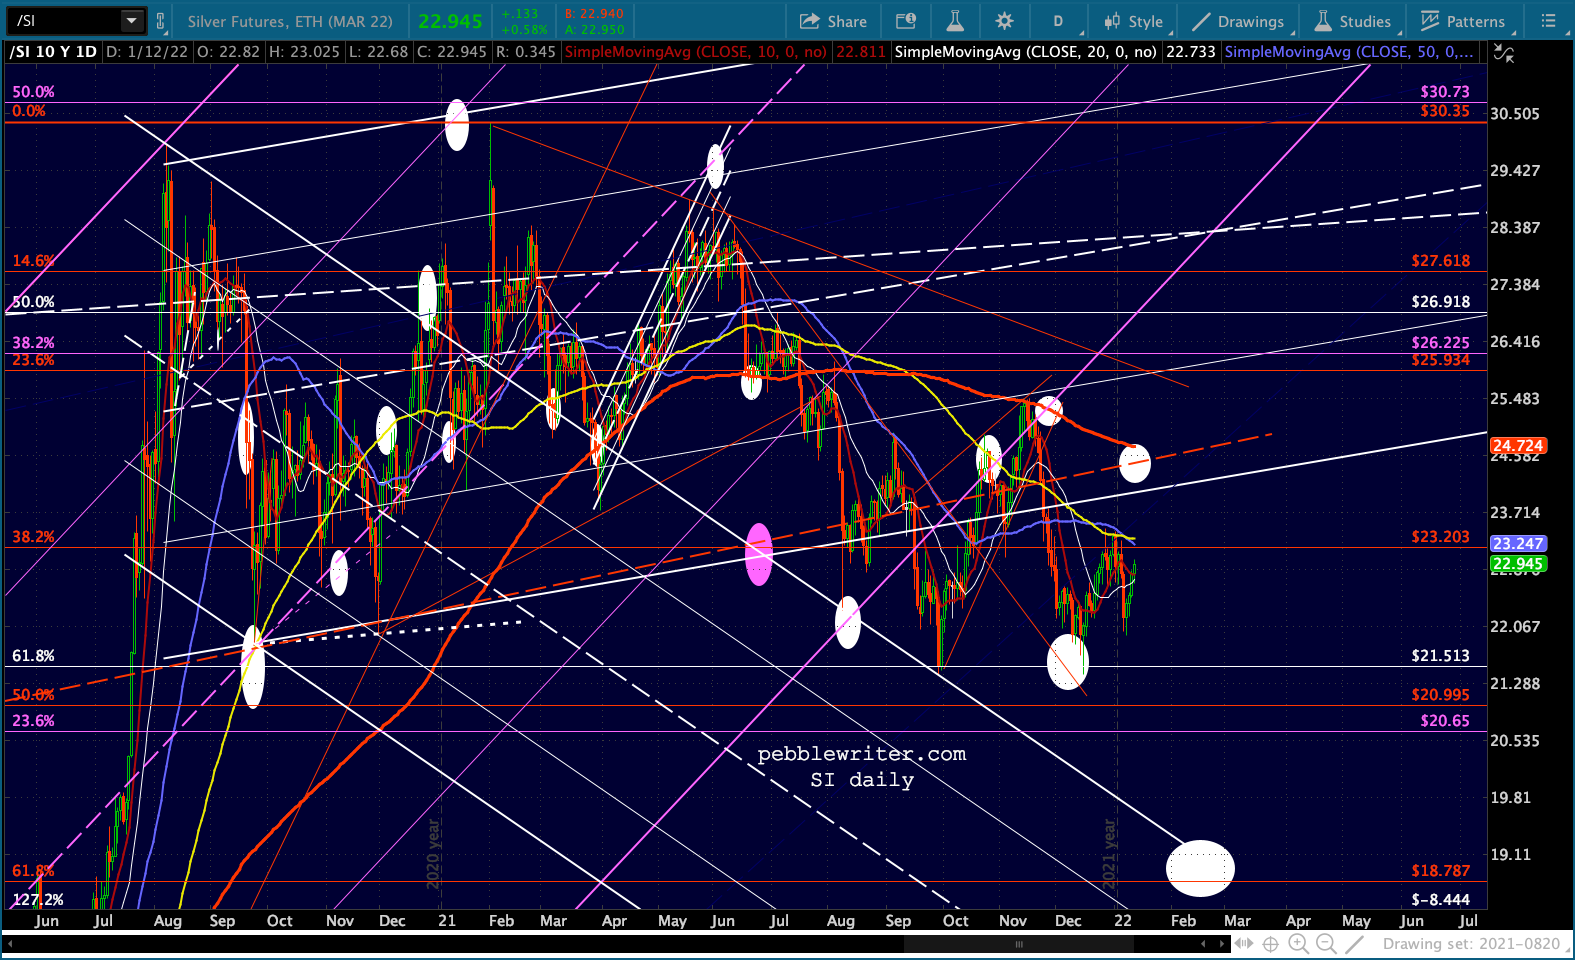
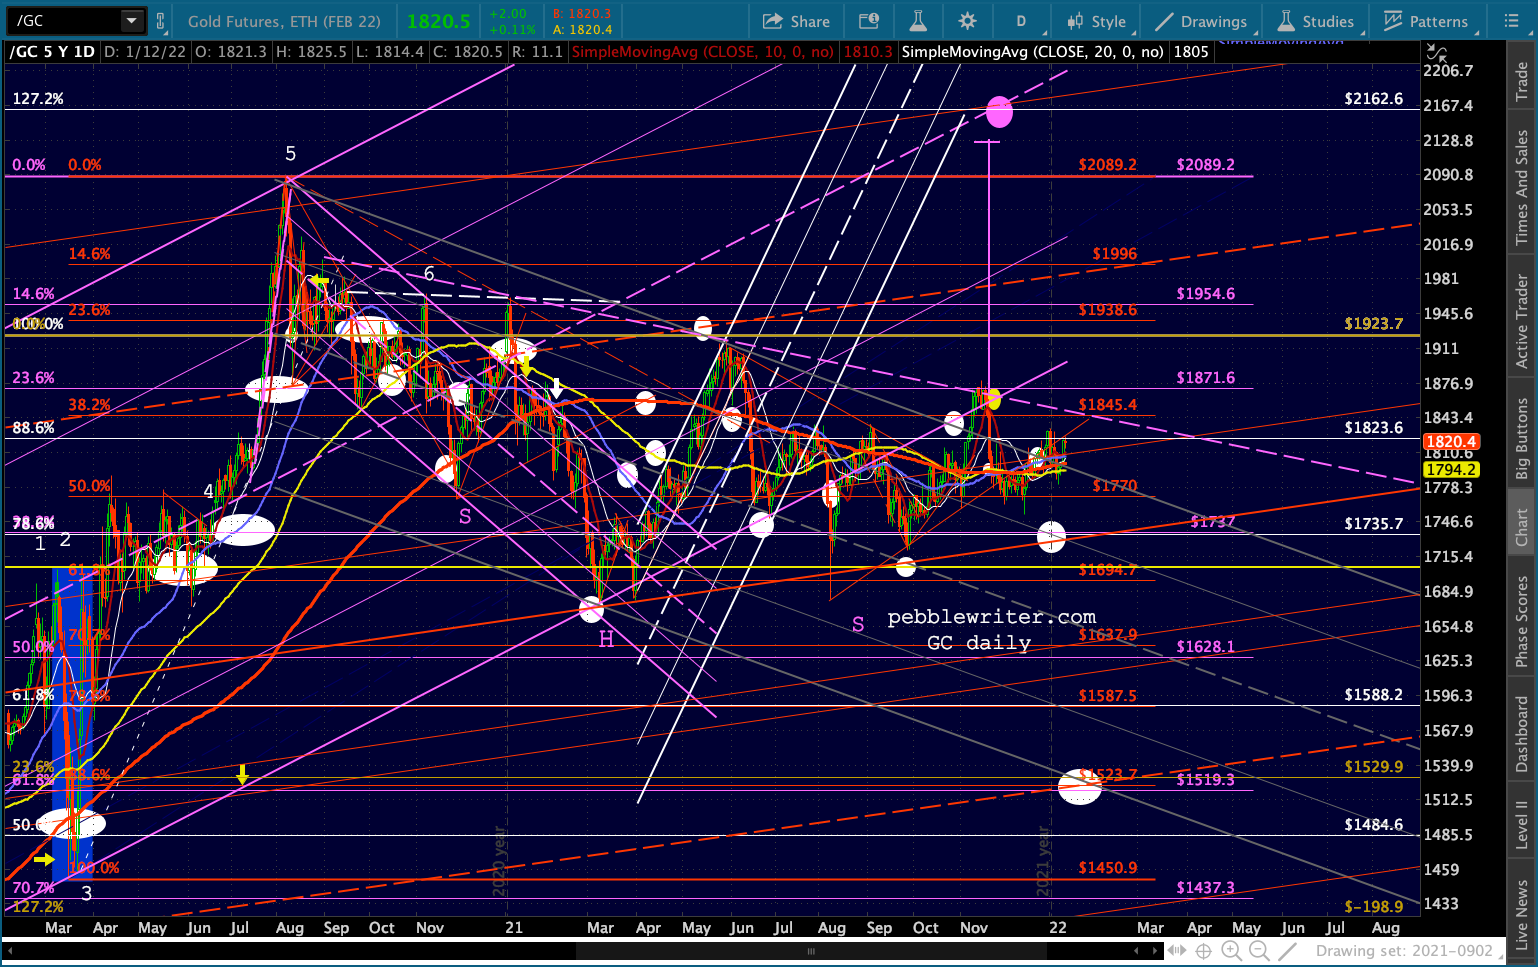
 Gold and silver are getting a nice bump this morning, with SI approaching a potential bullish 10/20 cross (GC’s began on Dec 20.)
 BTC is backtesting its SMA10 and channel line.
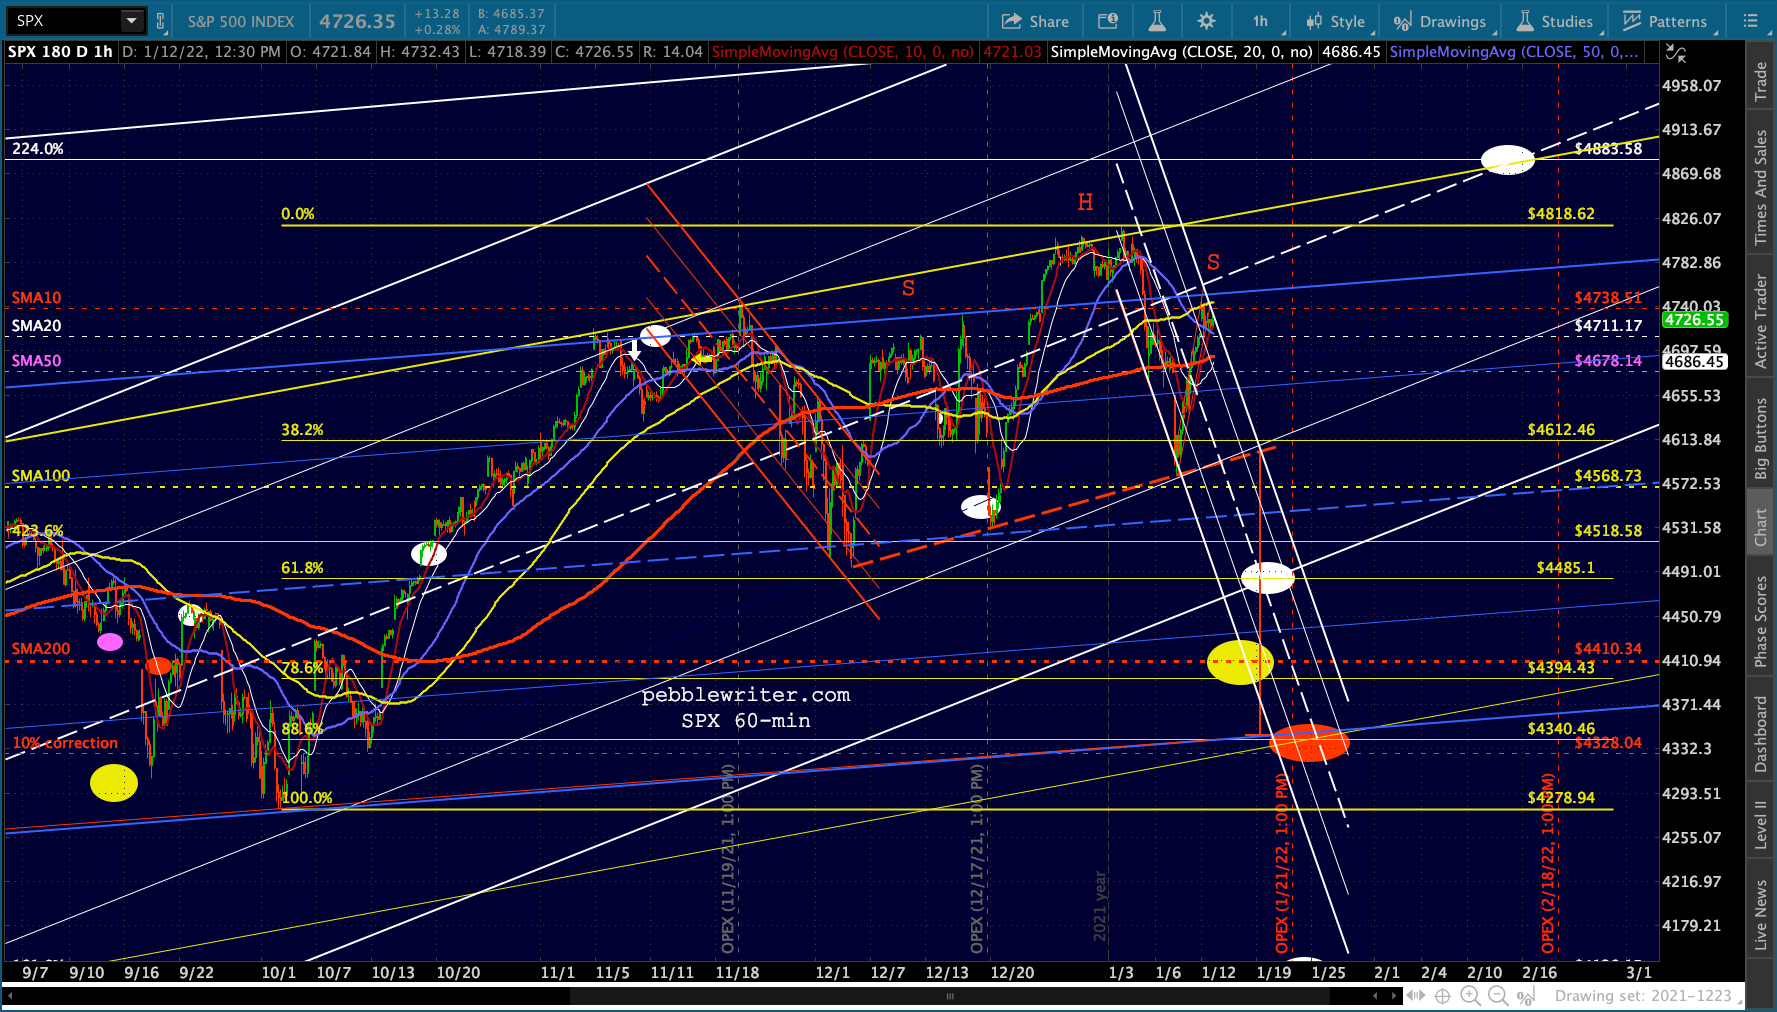
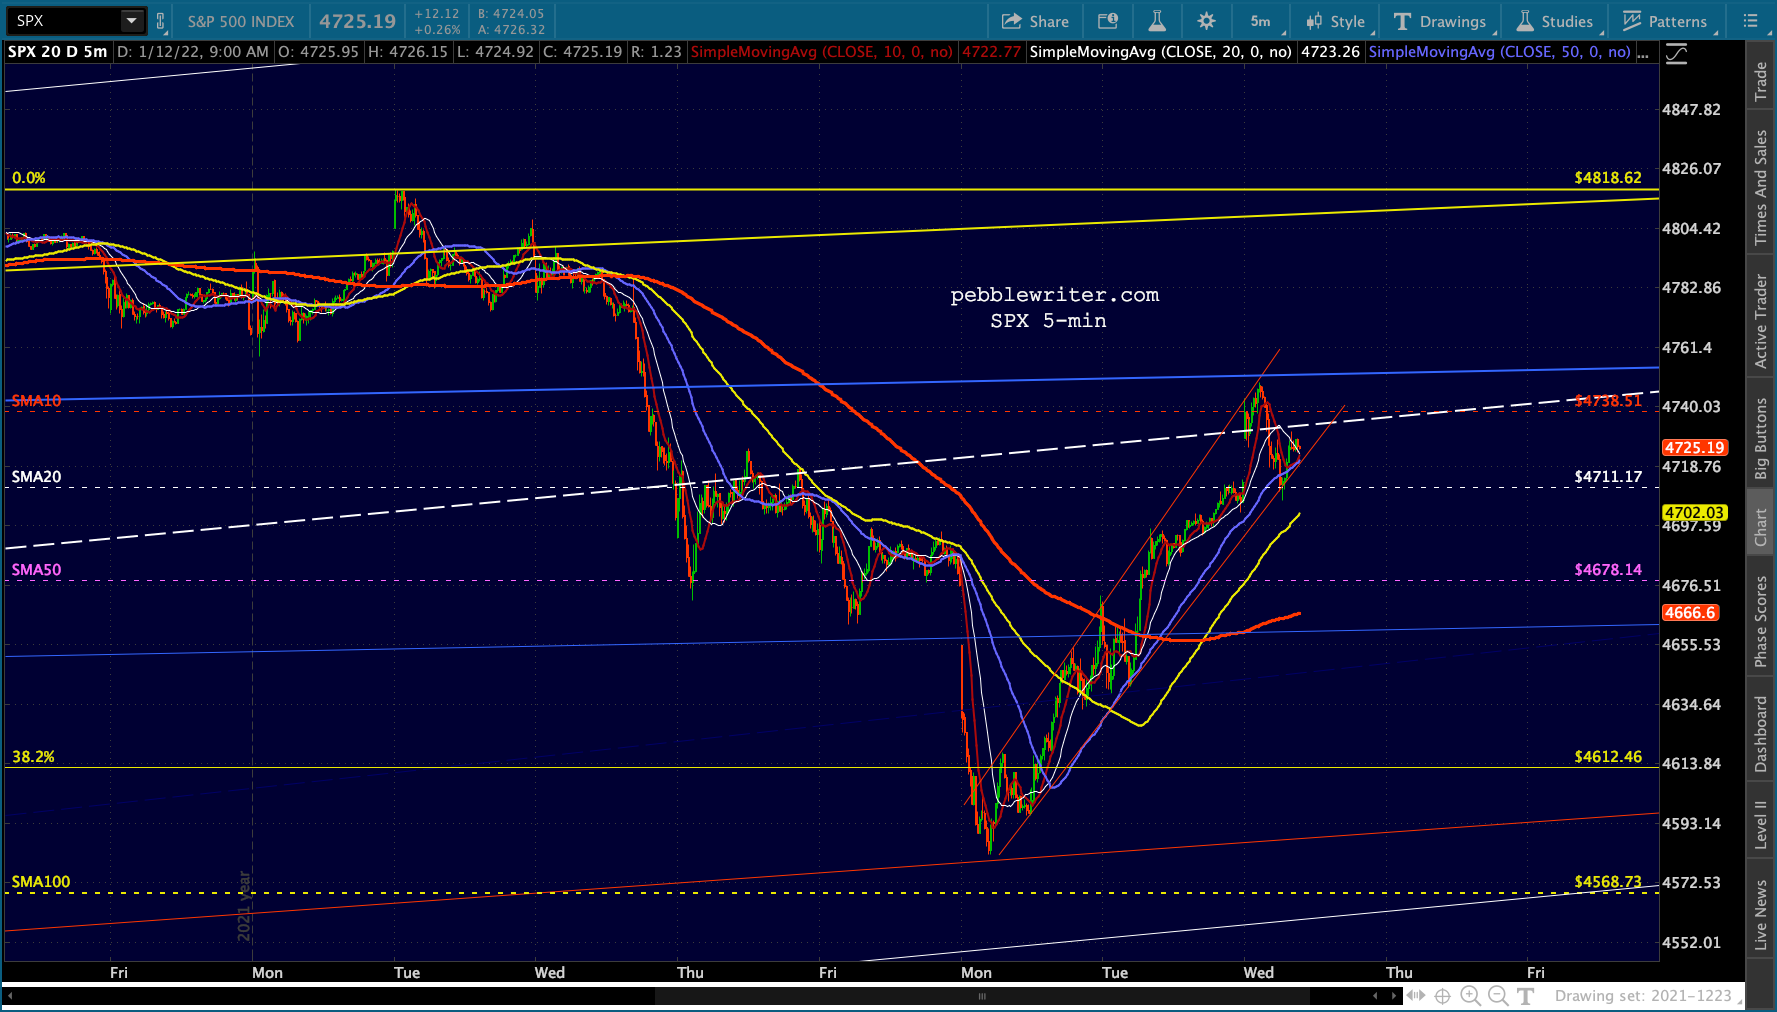
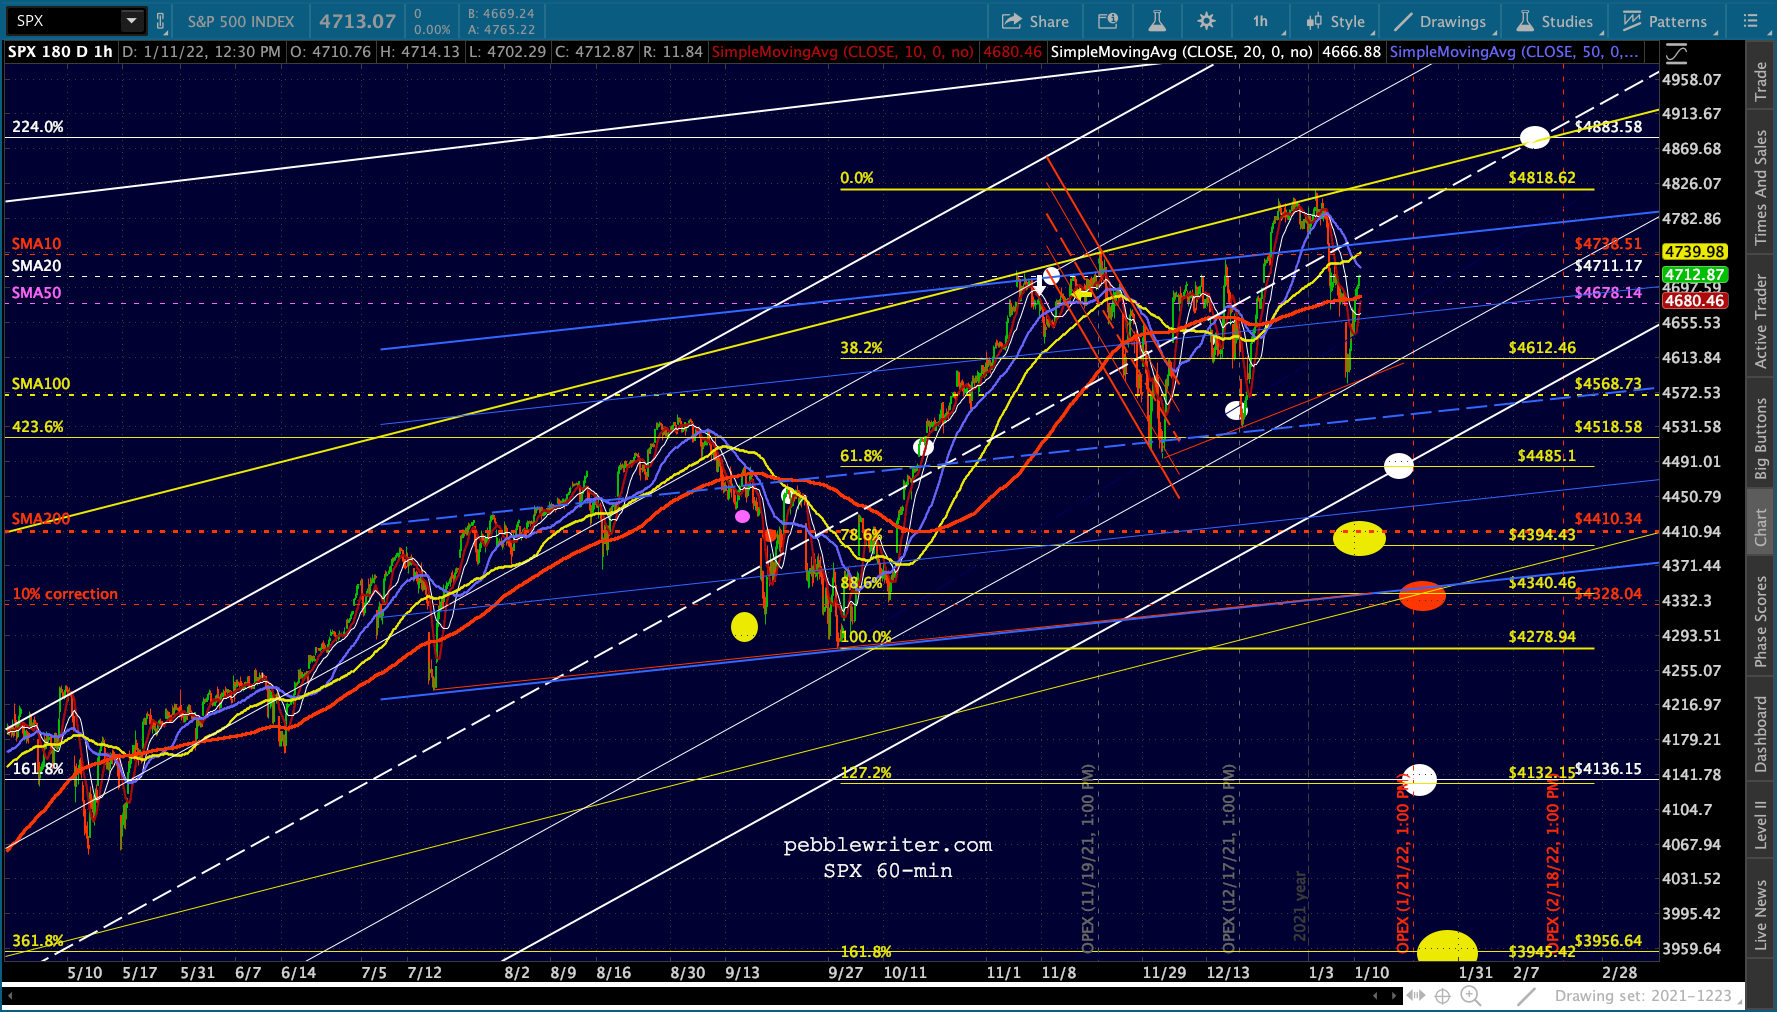
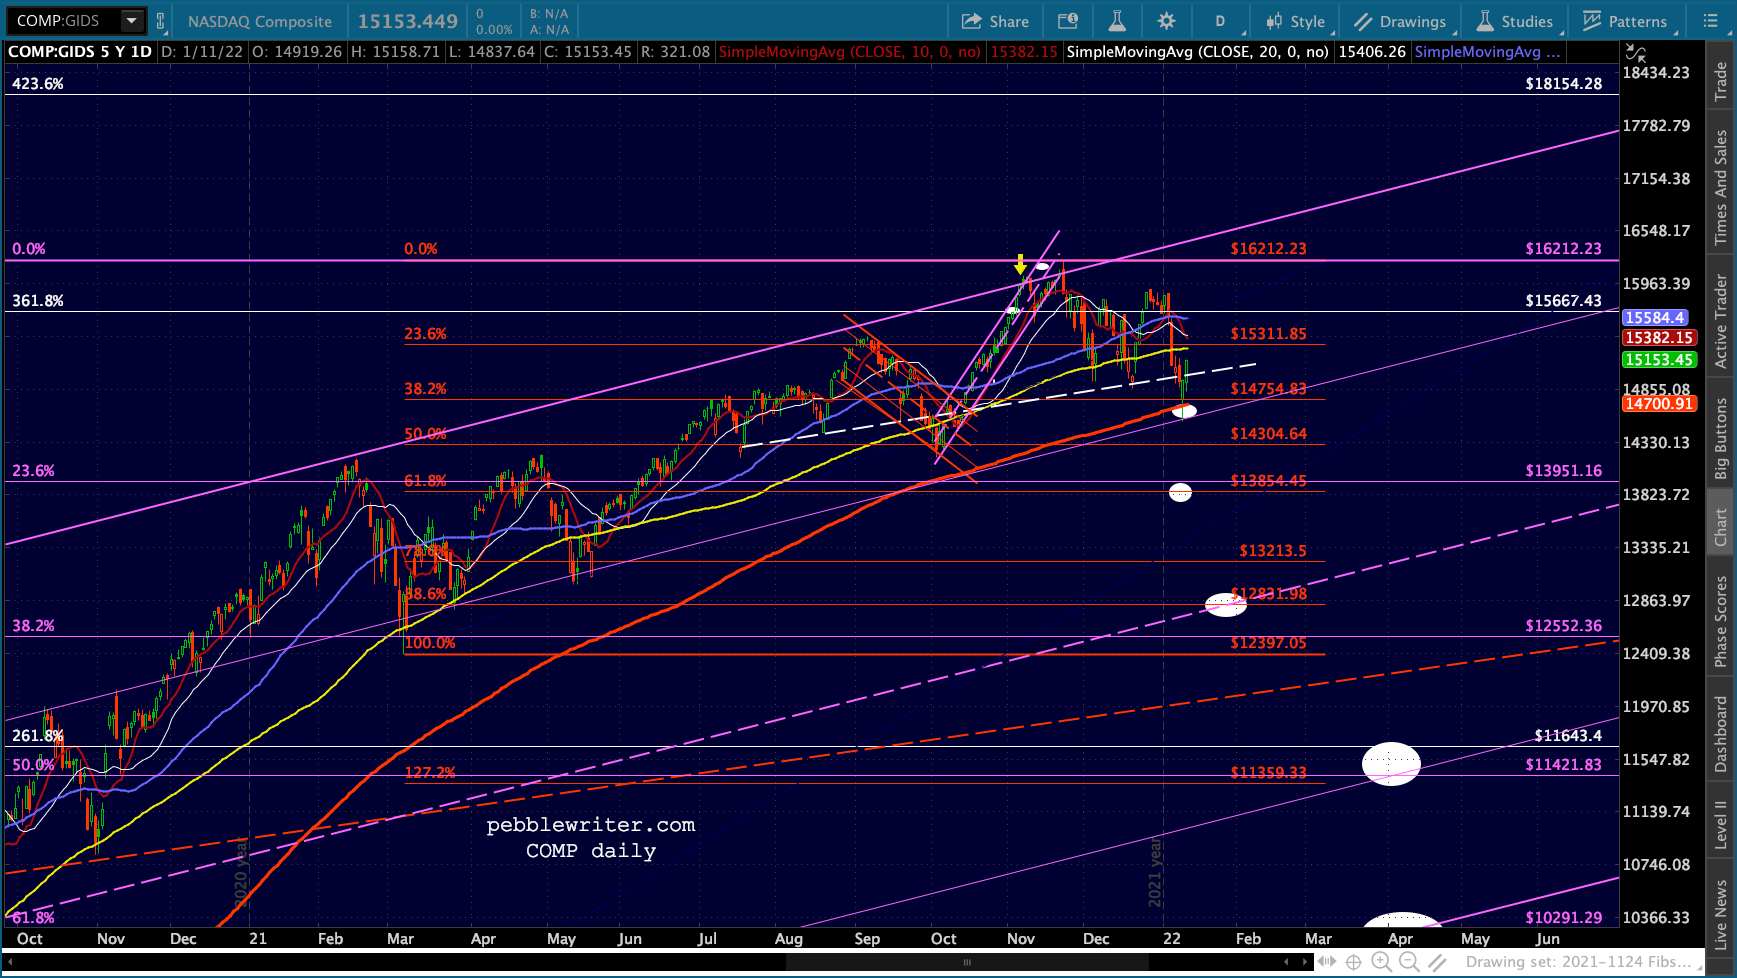
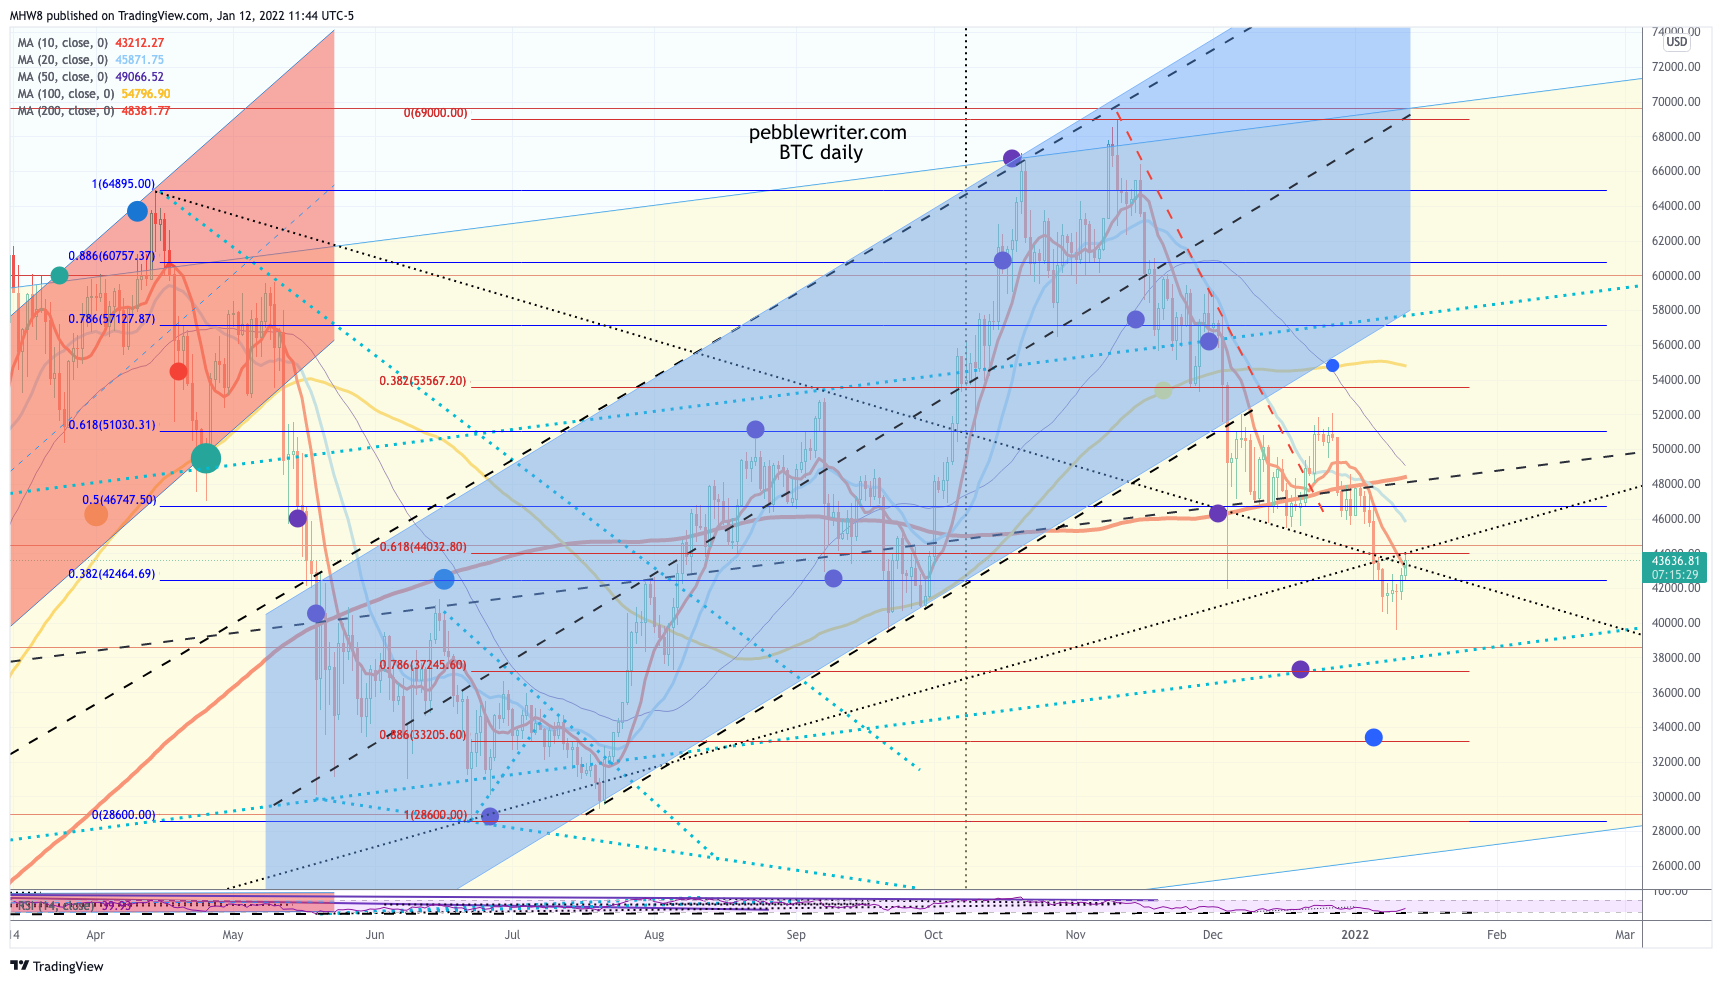 Stocks, having pushed back above the SMA50 in yesterday’s ramp job, are doing the Fed right by “shrugging off” the implications of the Fed’s disastrous inflation numbers. In other words, the Fed is putting on a nice little show of how little these things should matter. Otherwise, we’d never ever see a “rally” like this one.
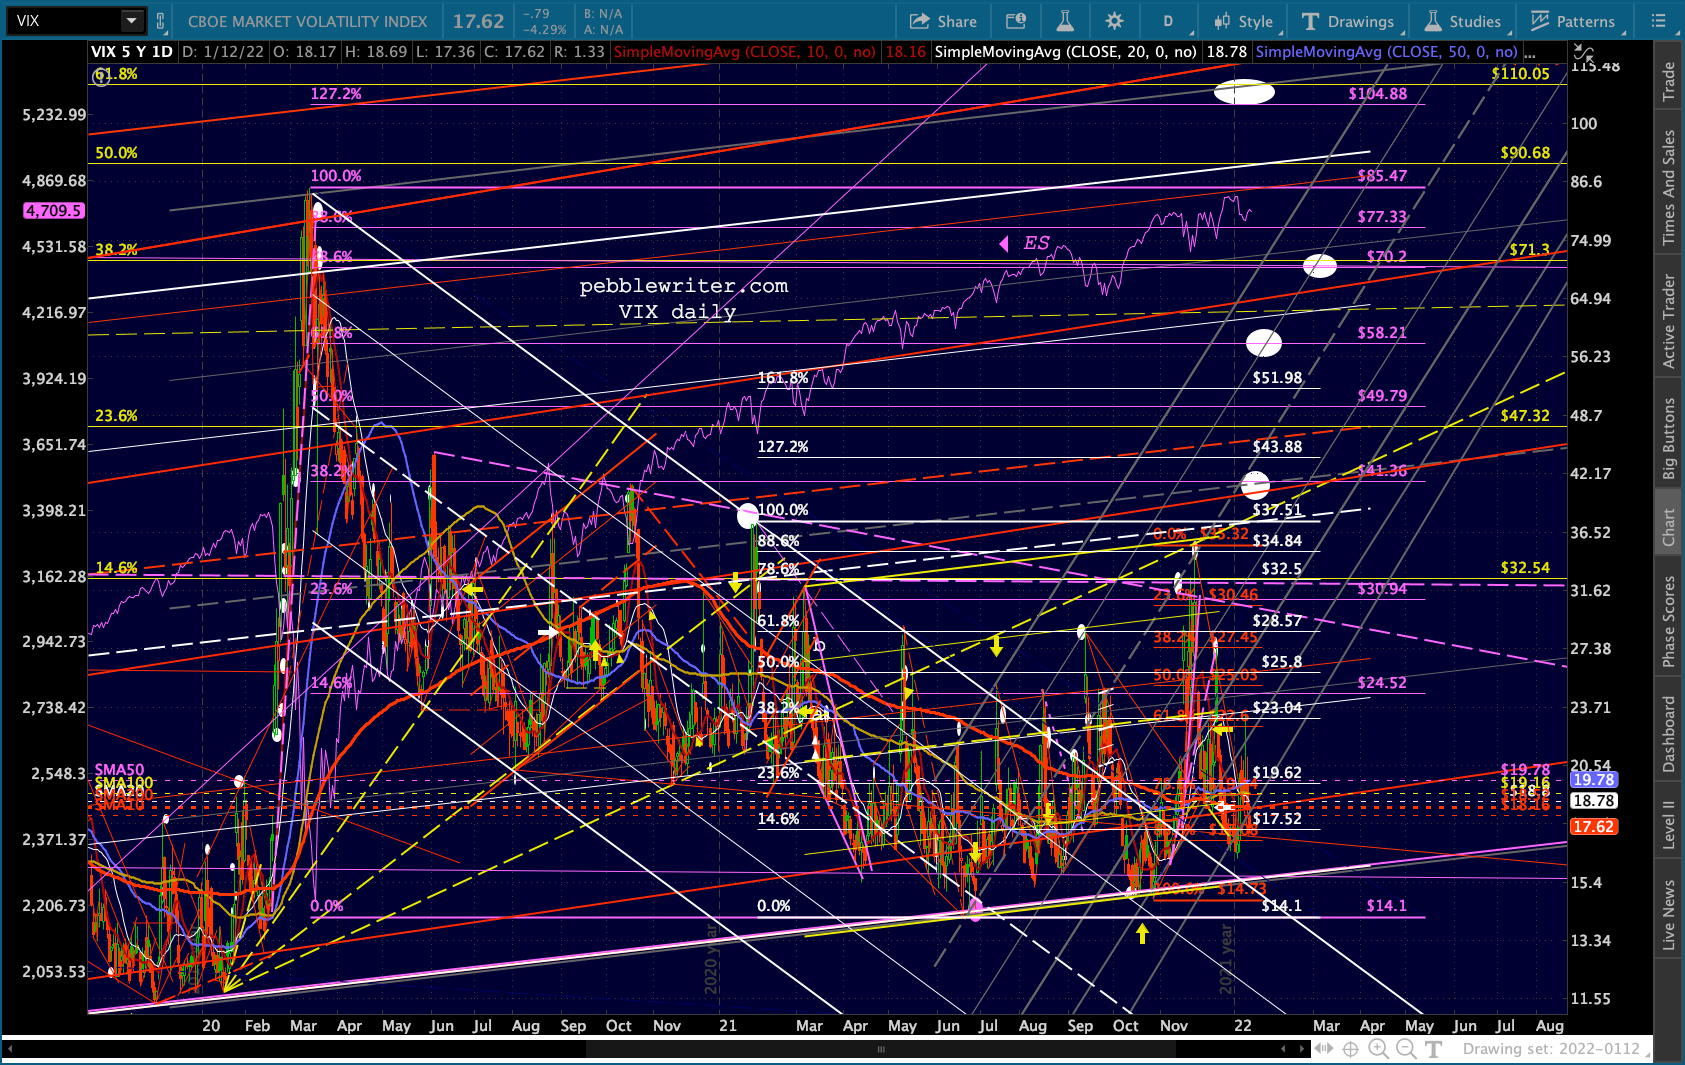
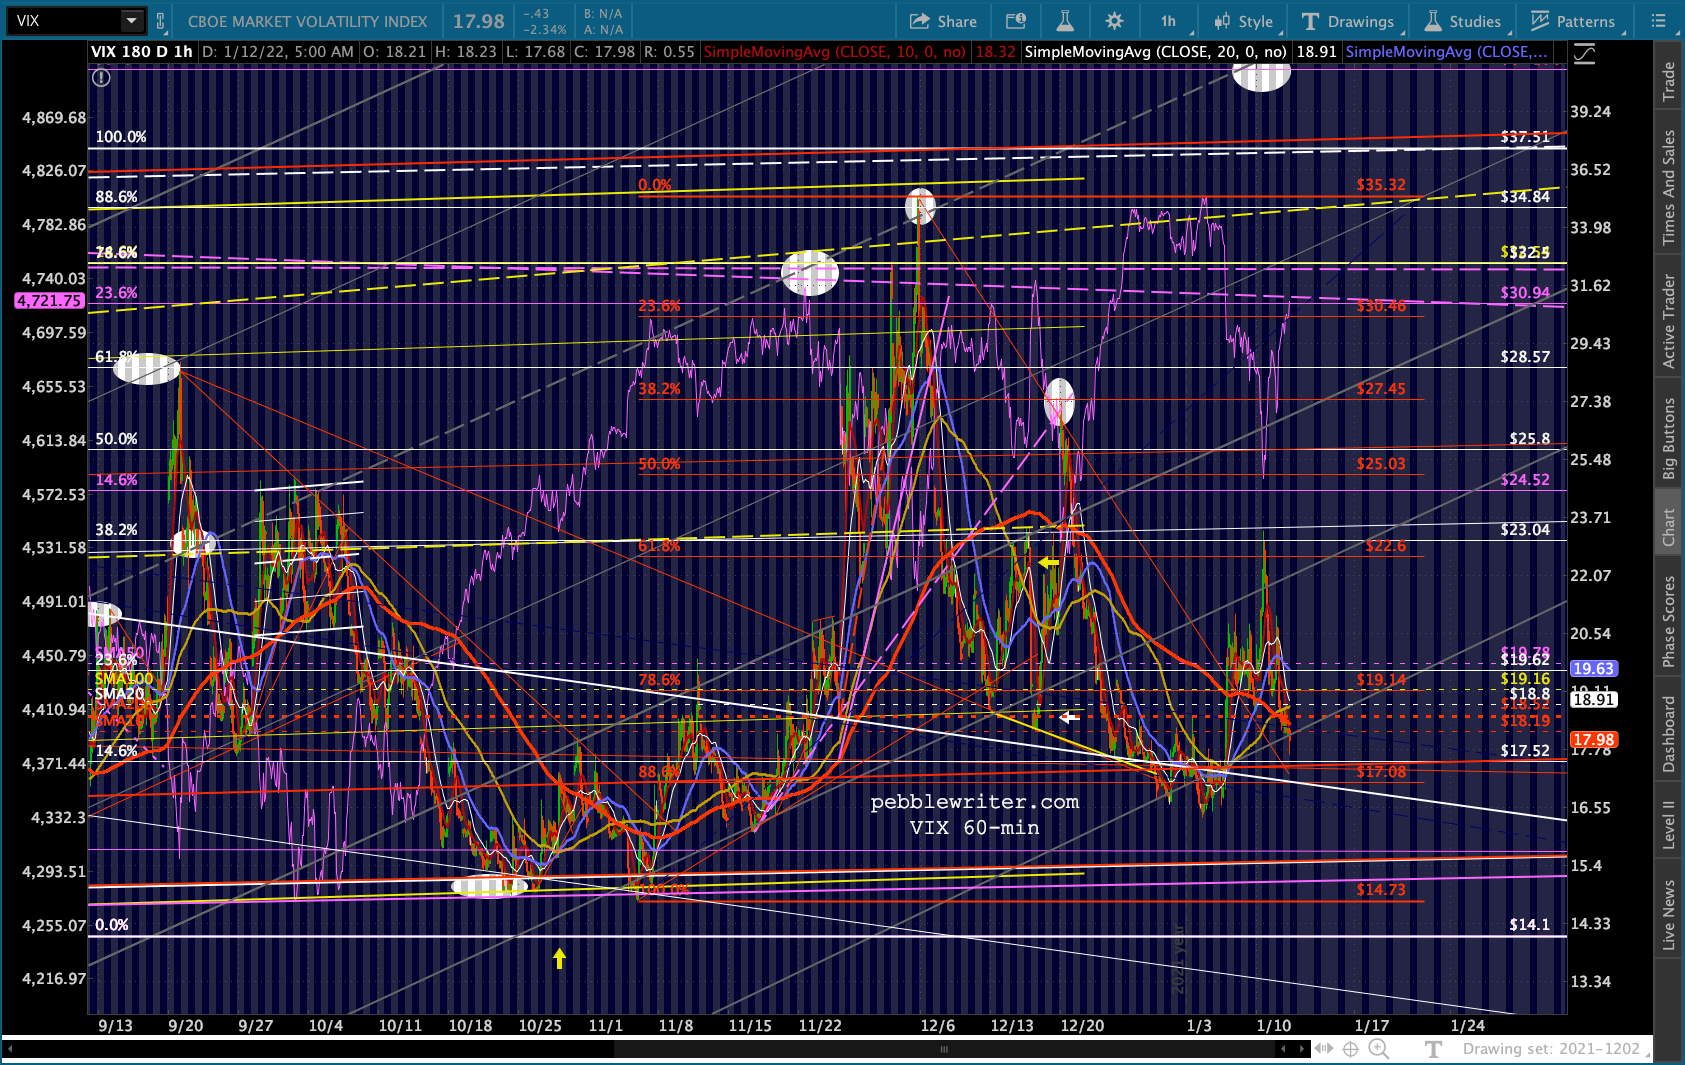
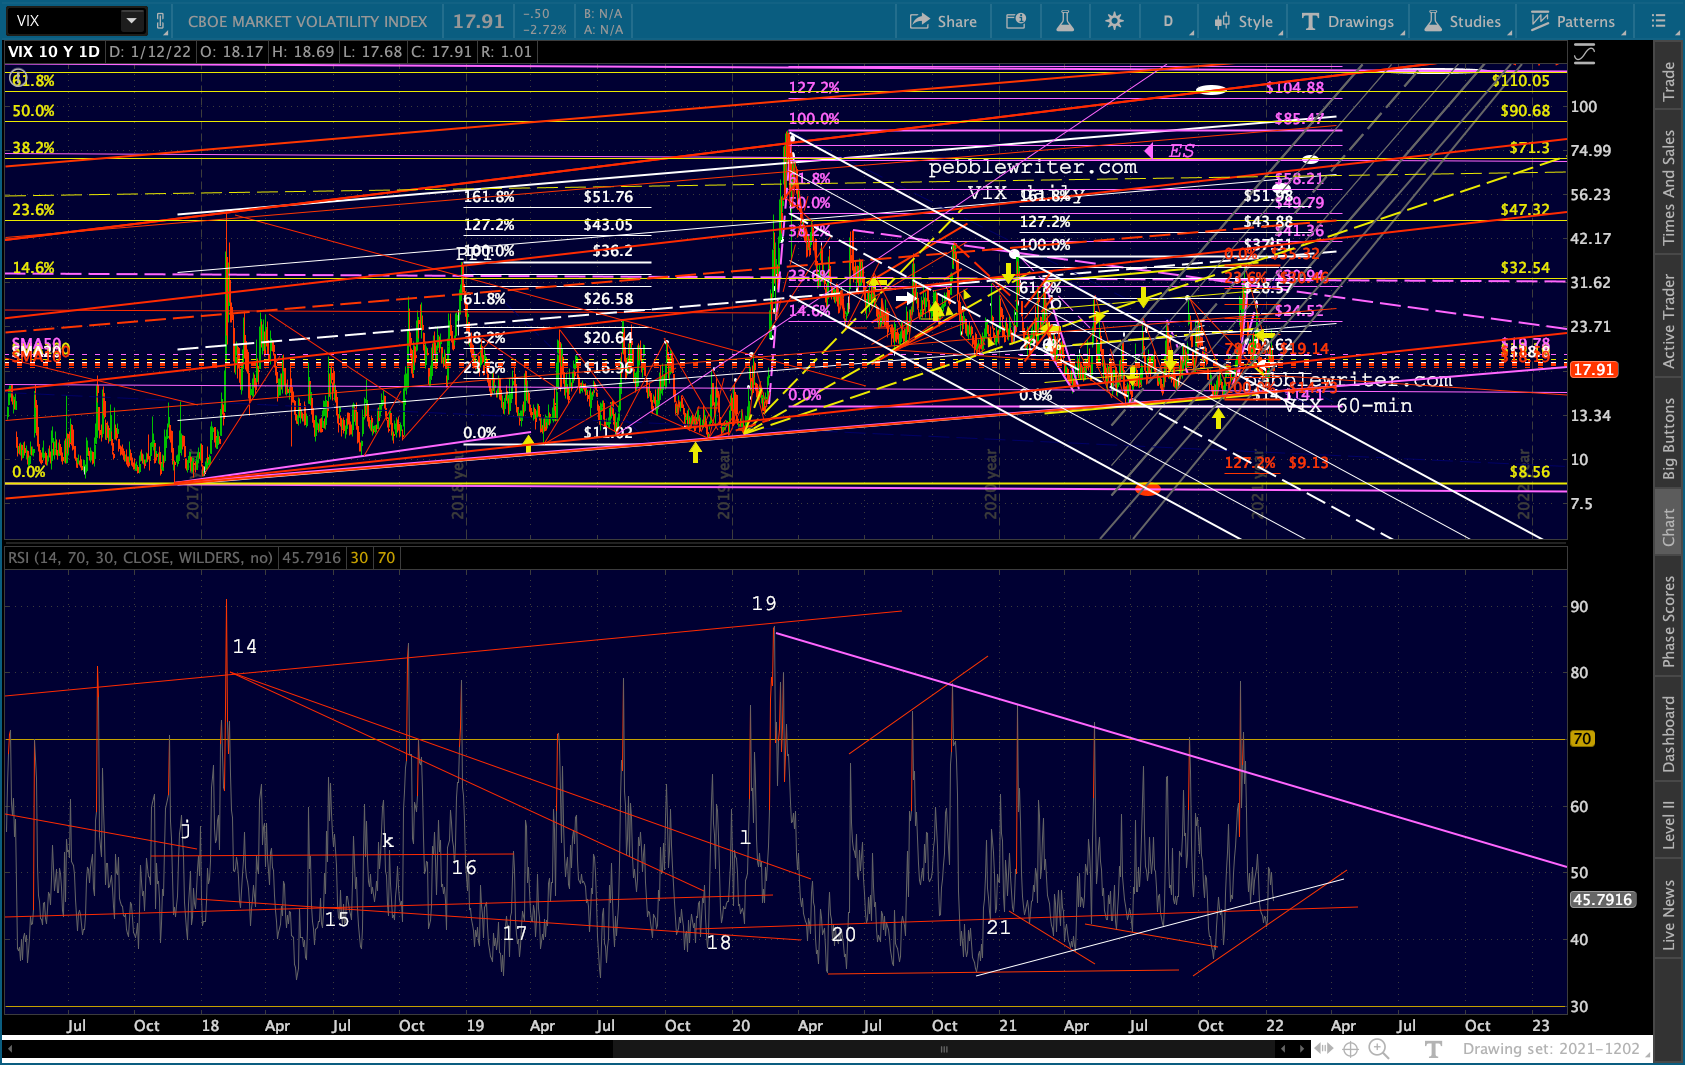
 As always, we have to keep a close eye on VIX. Continued shorting courtesy of the Fed could keep it under sufficient pressure to prevent a breakdown in stocks. But, I continue to believe that a breakdown is exactly what the market needs at this time. Perhaps this is just a stall so that the eventual decline can be linked to something else other than the Fed’s response to inflation.
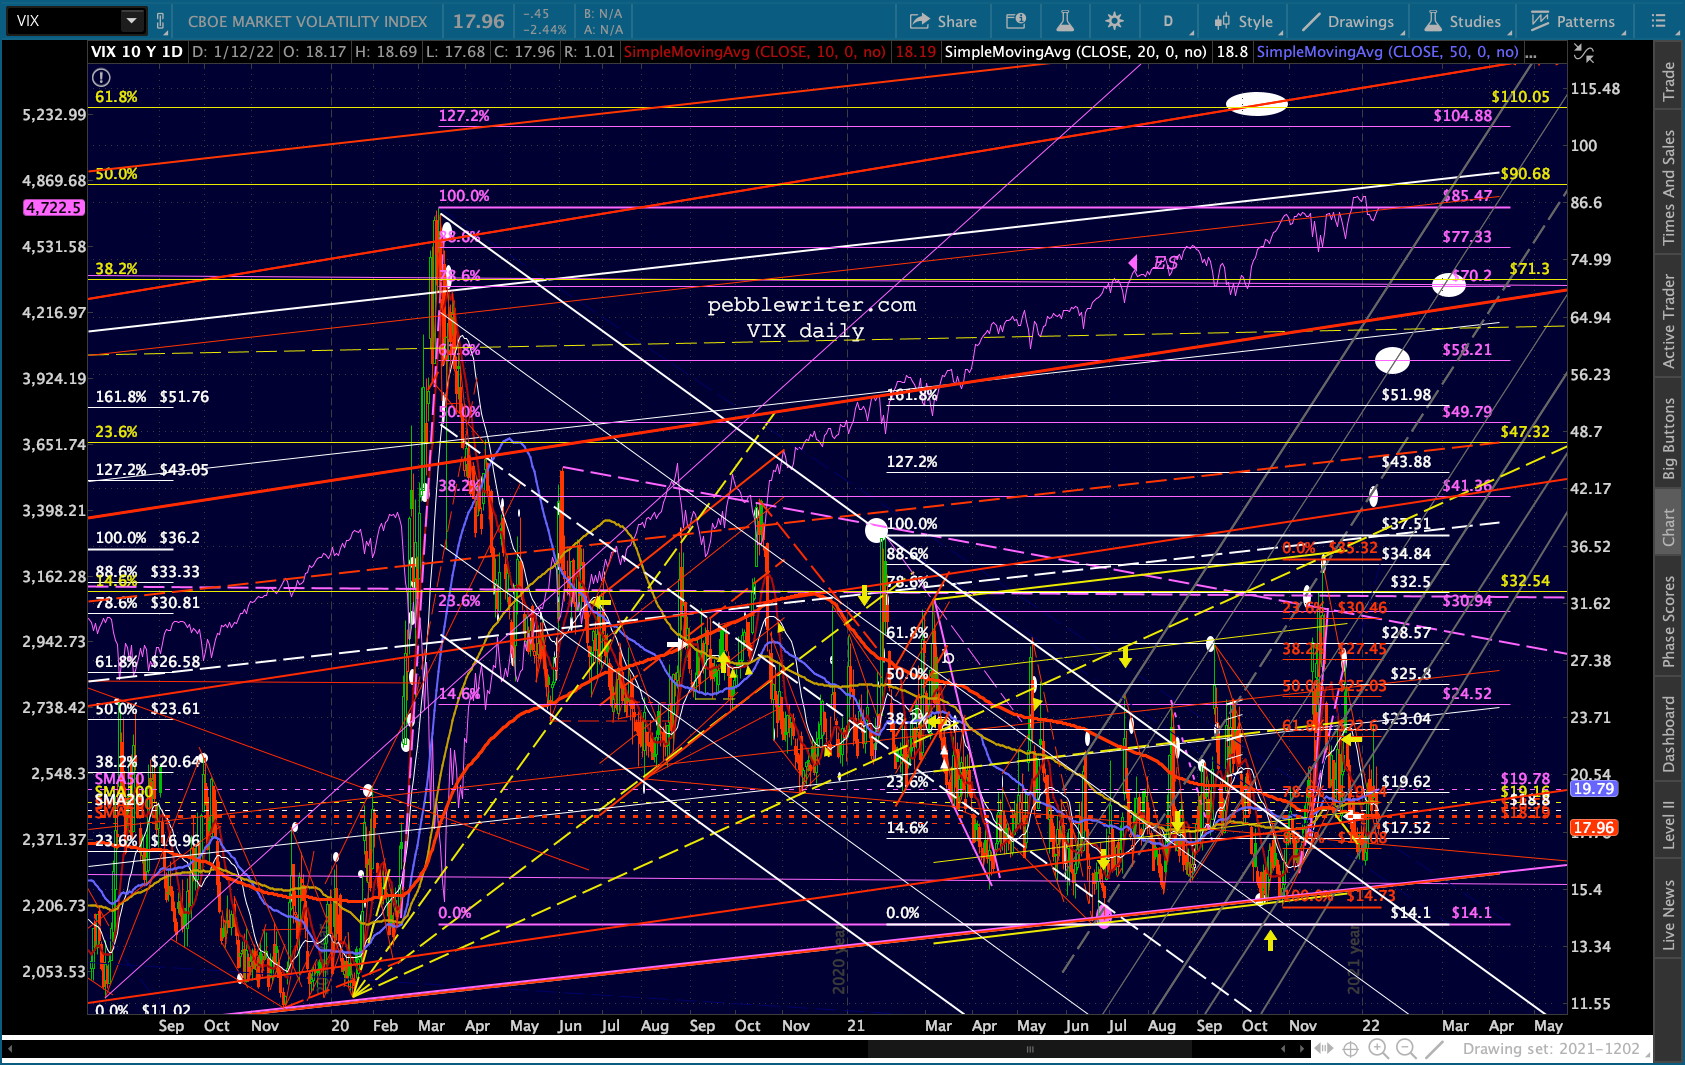
 My gut tells me that the market faces a SHTF moment in the next day or two, though the charts also suggest the end of the month as a possibility.
GLTA.
UPDATE: 9:40 PM
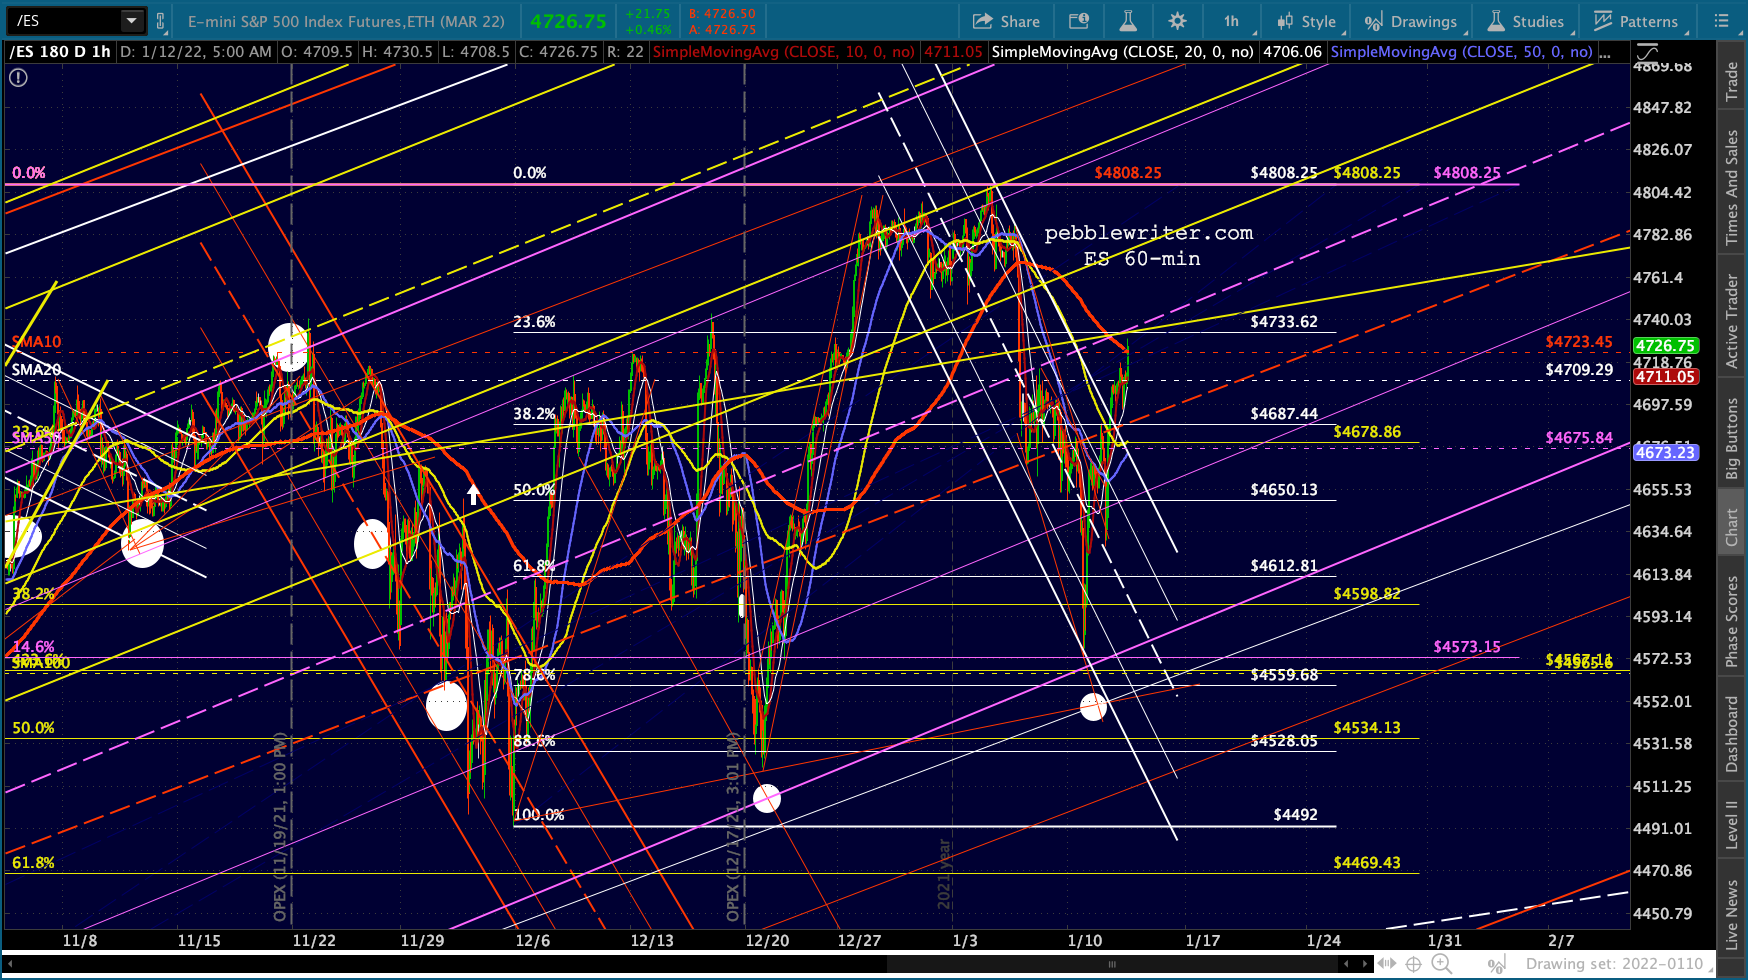
FWIW, there’s a nice little H&S Pattern setting up on ES/SPX. On SPX, it targets the red oval which represents both the yellow .886 and a 10% correction at the bottom of the purple channel and .786 line of the larger yellow channel. It would, however, require a drop through the SMA200.