

We’ve had a constant barrage of optimistic OPEC press releases over the past two weeks. This week, the actual news is anything but optimistic. And, CL is showing it.
It’s not over till it’s over. But, equities are looking more than a little nervous. We remain short from yesterday.
continued for members…
ES and SPX’s rising white channels have broken down. The next support is the SMAs at 2192.45 and 2191.15 respectively. As we discussed yesterday, SPX also has potential support at the purple midline which, today, is about 2182. Beyond that, our analog suggests that if 2187 is broken for SPX, it has potential down to 2133. Assuming the white channel is discarded altogether, today, the rising red channel I’ve drawn in incorporates the recent highs as well as the Nov 4 lows.
Interestingly, its bottom passes through the white target down at 2133 on Dec 5 — our Day 104 target. Also interesting, if SPX should manage to sell off 70 points by Monday, the B wave would position an A-B-C up to 2262.21 — essentially the same height as the white 1.618 extension at 2261.80.
It could play out something like this:
With the actual path resembling something like this:
DX is still backing off our102.098 target. VIX is stuck, for the moment, between the .886 Fib and SMA10 support and the red channel bottom resistance.
USDJPY is bouncing after tagging its SMA10 for the first time since election day. But, the effect has been rather muted thus far with no new highs yet.
UPDATE: 10:52 PM
The VIX-driven bounce has reached the SMA5 100. While VIX could obviously drop further (it’s detached from all news and logic), it’s working against the more important CL and USDJPY (DX) and, of course, our analog. If you missed getting short yesterday, here’s another chance.


I’m going to take a break and will be back around 11:45.
UPDATE: 12:55 PM
VIX is still leveraging SPX incrementally higher. It may be that they can get it back up to 2211 or even above 2113.35 for this, the actual day 100. Traders might wish to cover the short position here and reestablish it at a higher level later in the day. Swing traders should be safe holding short.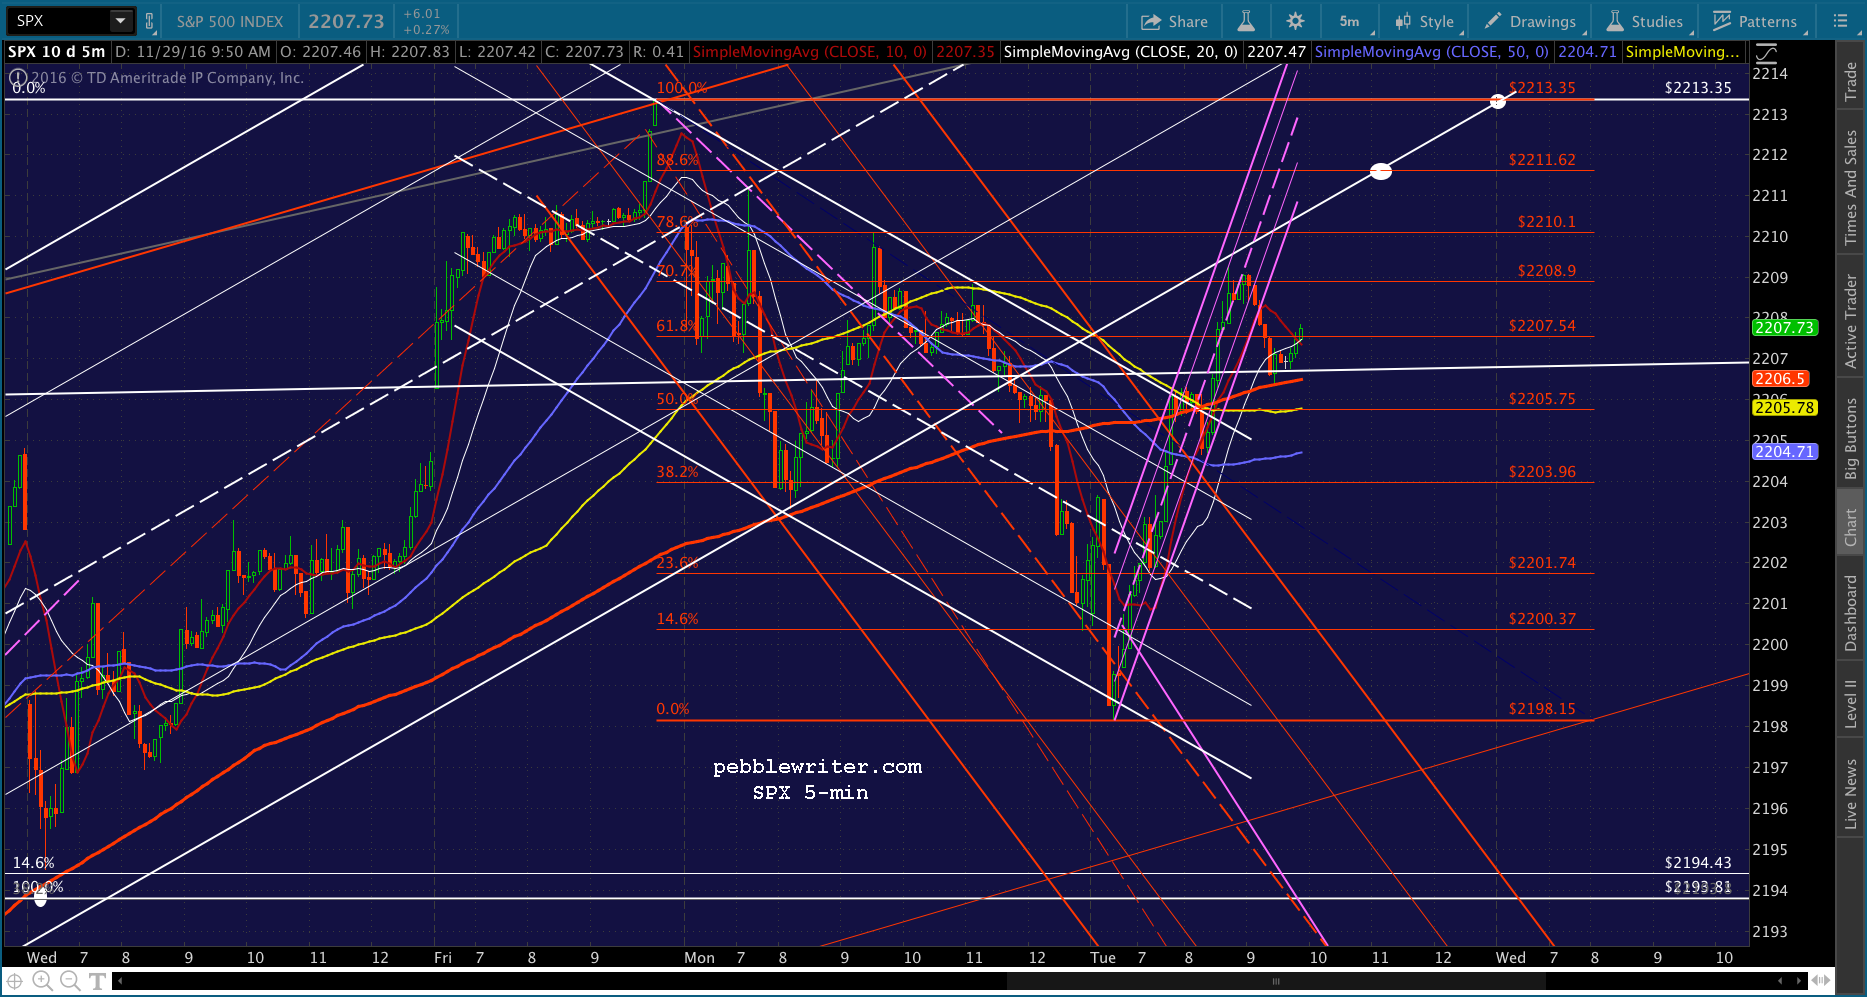
By establishing the purple trend line, the VIX manipulators gave themselves something to break down through — a bullish signal for the algos. Note that the TL breakdown also included a drop through the SMA10 — a bonus.
At this rate, it probably doesn’t need to actually drop through the Nov 25 lows at 12.31 in order to effect a new high for SPX. I suspect TPTB would be just as happy with a deep retracement up to 2210.10, 2211.62 or 2213.25. The main thing is to suck a bunch of bulls in before TSHTF for CL — after the close, of course.

UPDATE: 2:59 PM
SPX just slipped below the SMA5 20. Back to short here, but watch your stops in case it’s another headfake.
FWIW, VIX just broke above its SMA5 20… …and, USDJPY shows continuing weakness.
UPDATE: 3:22 PM
VIX just backtested the TL as ES is approaching its SMA200. SPX has no reason to reverse here, but I’d watch stops carefully, especially if VIX drops through its SMA10 again. A rebound here to 2210 would make for a pretty enticing IH&S. As I mentioned earlier, VIX’s TL has no innate legitimacy. It was established solely for the purpose of having something to break when SPX needed a boost — which it definitely got. So, a backtest here for VIX would not surprise. If the SMA10 holds and VIX sails through the TL, of course, it gives me a lot more confidence in holding short.

UPDATE: 3:38 PM
Well, they’re determined. I’ll give them that. They’re still trying to work VIX lower. It reversed off the TL, dipped below the SMA10 and is testing the weak-kneed SMA5 10. ES got a bounce off its SMA5 200… Will all that be enough to stop the slide and create a IH&S? I wouldn’t bet on it. Remember, CL has API inventory data coming out after the close. In the meantime, I count four updates repeating the same headline “Iran, Iraq Soften on OPEC Production Agreement” — which, so far, CL is ignoring.


Needless to say, if the OPEC deal comes together, a completed IH&S would be the least of bears’ problems. I’m betting that CL moves lower from here. I see nothing in the price action to indicate otherwise. In fact, the only bullish development on any chart is VIX, which continues to get hammered lower. As always, only hold short if you can hedge or stand the risk of a gap higher overnight.
UPDATE: 5:40 PM
FWIW, API’s data showed a slight decrease in crude, big increases in gas and distillates. CL remained flat on the news.
Comments
2 responses to “OPEC: Vexing in Vienna”
PW, a year ago in November, CL had a headfake by rising and tanking. Then we had a December rate hike.
Now, in 2016, we almost have the same scenario with CL behavior since November and probably upcoming rate hike in December.
Do you consider this similarity as part of the analog?
Yes, I do. CL had dropped from 50.92 on Oct 9 to 34.53 on Dec 14. SPX was headed for a backtest of 1823 from its most recent highs at 2111 on Nov 3. On Dec 14, CL bottomed out and put in a corrective wave up to 38.39 by Jan 4 before continuing on down to 26.05 on Feb 11.
When the FOMC raised rates on Dec 16, SPX did its usual ramp on that day, then dumped 71 points in the next two sessions. It would likely have gone further except that CL continued higher through the end of the year and USDJPY popped for two days, settled gently back to 120.11 and got a bounce there until the end of the year.
Dec 31, 2014 close: 2058.90. Dec 30, 2015 close: 2063.36. The next day, Dec 31, 2015, they let it drop to 2043.94 — I suppose to acknowledge that 2015 was a corrective year and should reflect a (very) small loss. Or, maybe someone was asleep at the switch…I don’t know. By Jan 20, SPX had completed its drop to backtest the 1.272 at 1823 for the third time.