The August 2018 new all-time highs lasted five weeks and, when they failed, yielded a 600-pt plunge. The May 2019 new all-time highs lasted about 6 hours and yielded a 225-pt plunge when they failed. The June 2019 new, all-time highs lasted 3 days and yielded a 51-pt decline before staging a recovery that will (coincidentally, I’m sure) see new highs posted on this morning’s open.
Perhaps the trade war really will be resolved this time. And, maybe OPEC really will ink a new trade output deal. Heck, the Fed might even cut rates even though markets are at all-time highs.
All I know is that while chasing new highs on the back of VIX “breakdowns” and oil “rallies” has worked out fine for buy-and-hold types (who have no fear of the music stopping), it has been a losing proposition for traders.
continued for members…
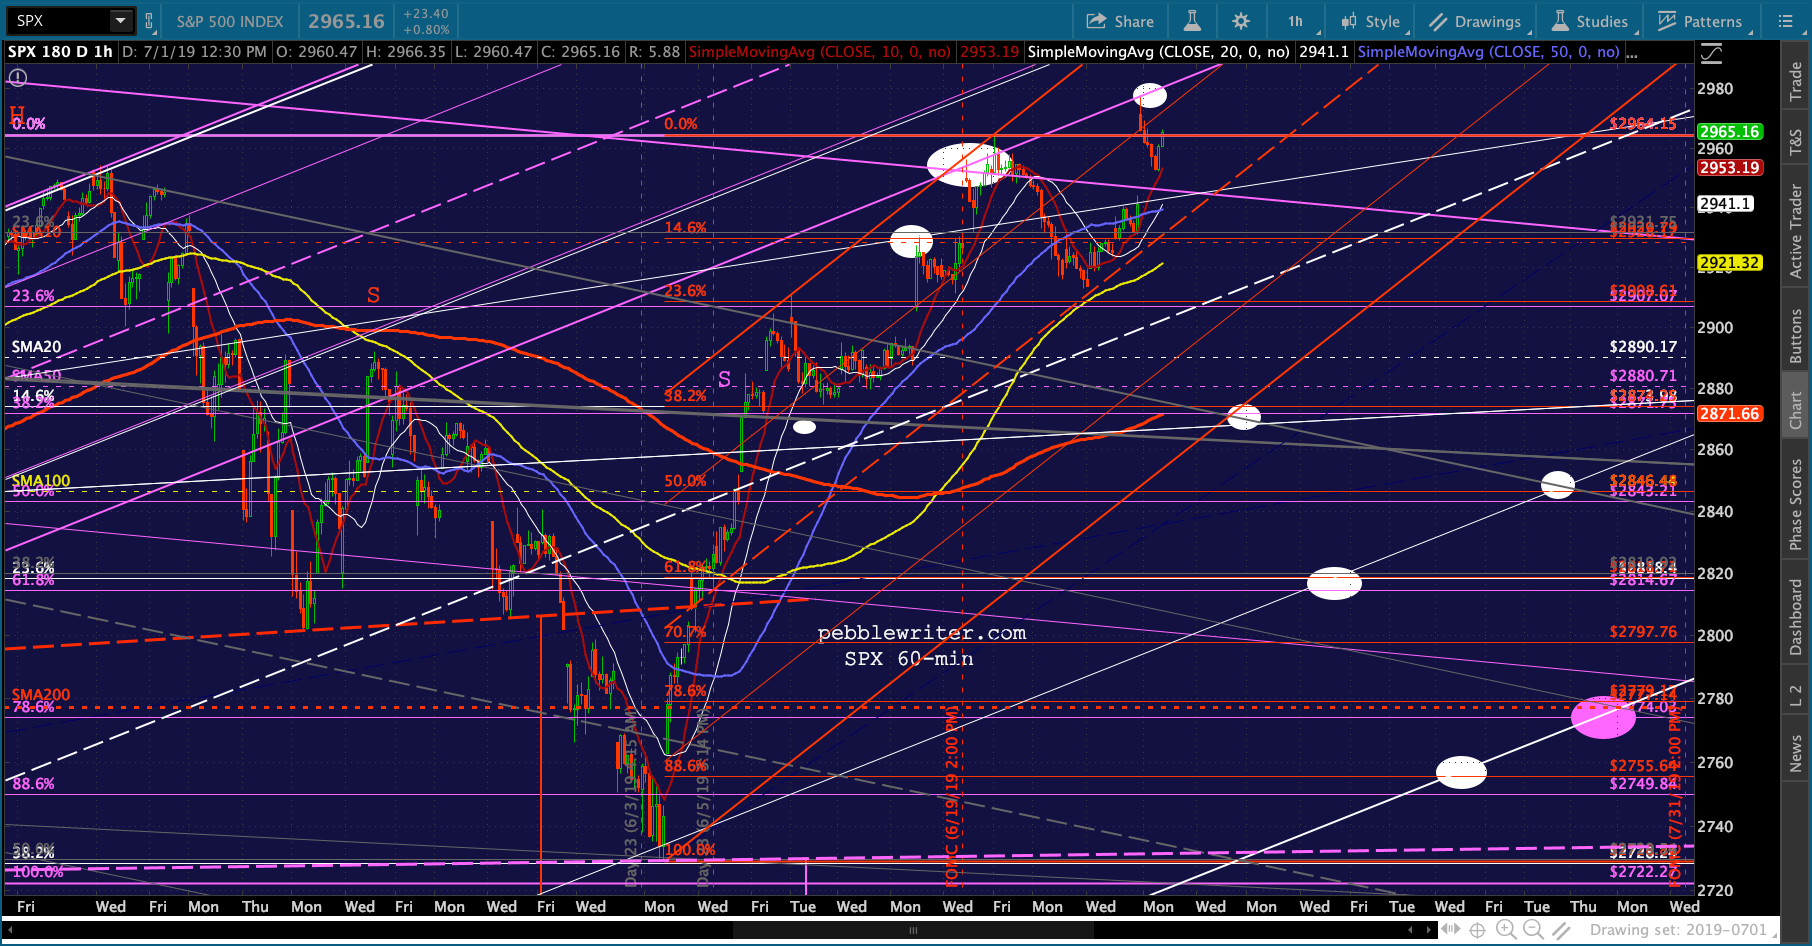
Note that even if SPX pops 35ish points on the open, it will still be backtesting the broken purple channel.
 The rest of today’s charts show little to cheer about in 10Y yields…

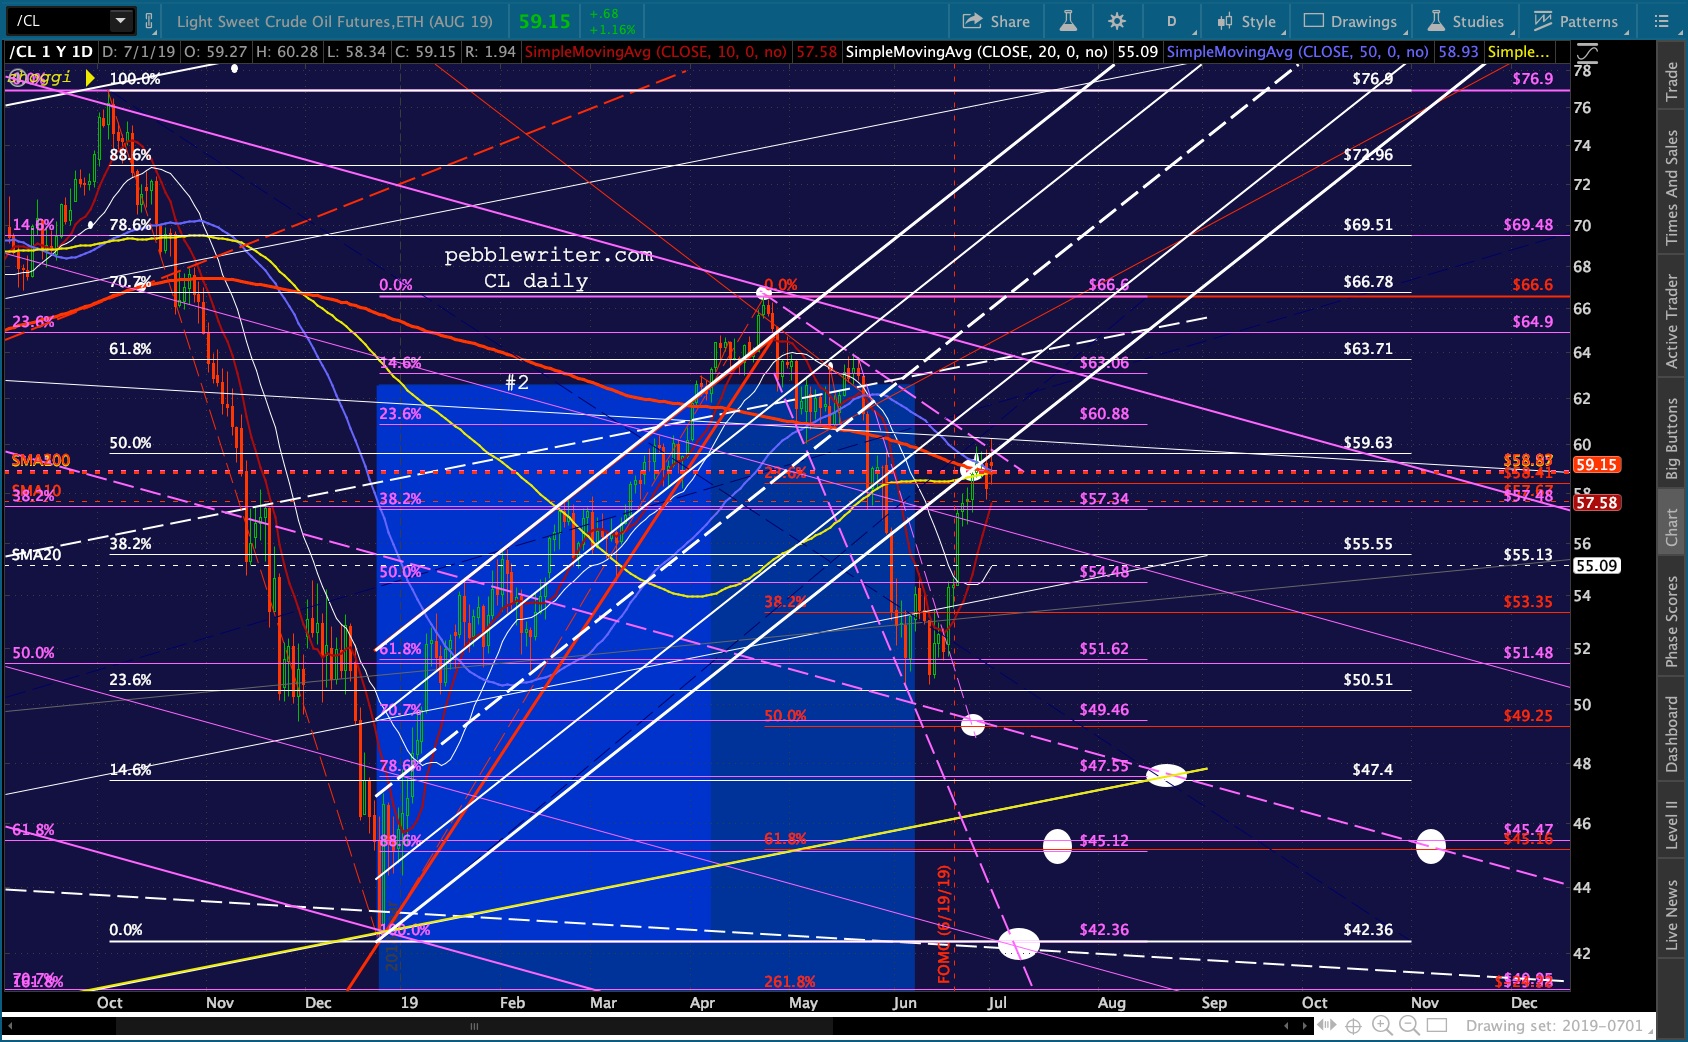
 …and a continuing backtest in oil and gas.
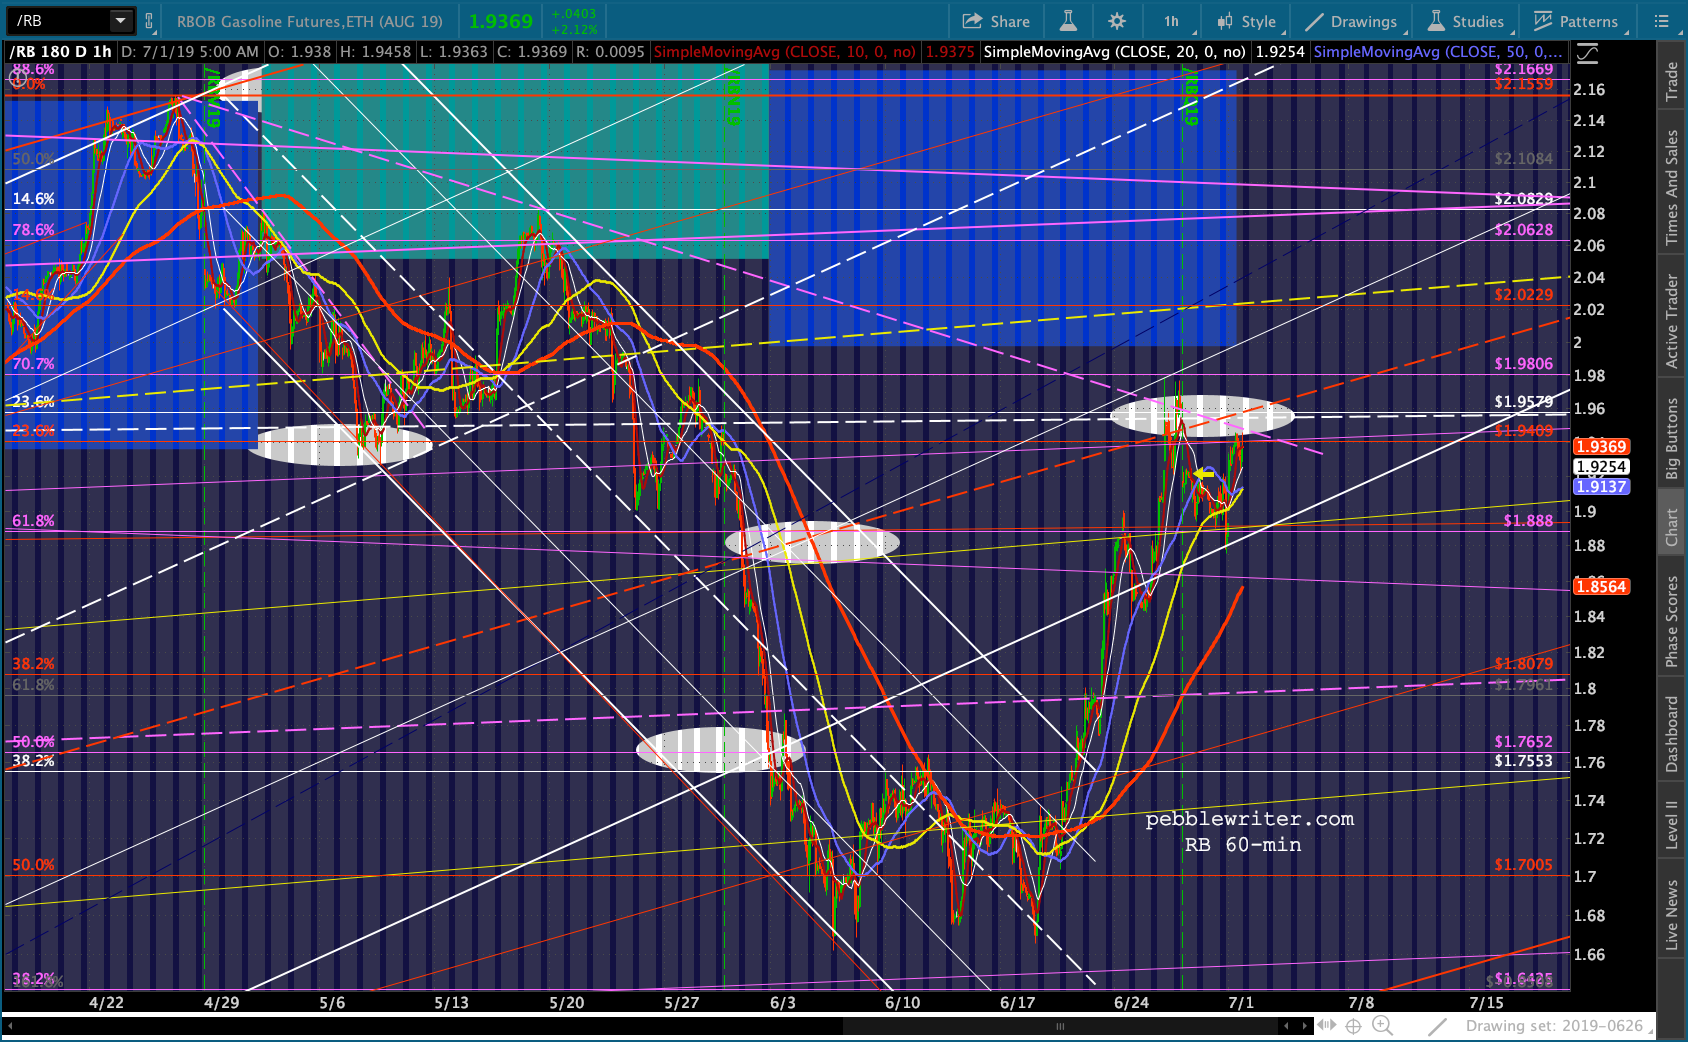
 DXY is rallying, but has still broken down.
 …as EURUSD does a deep backtest…
 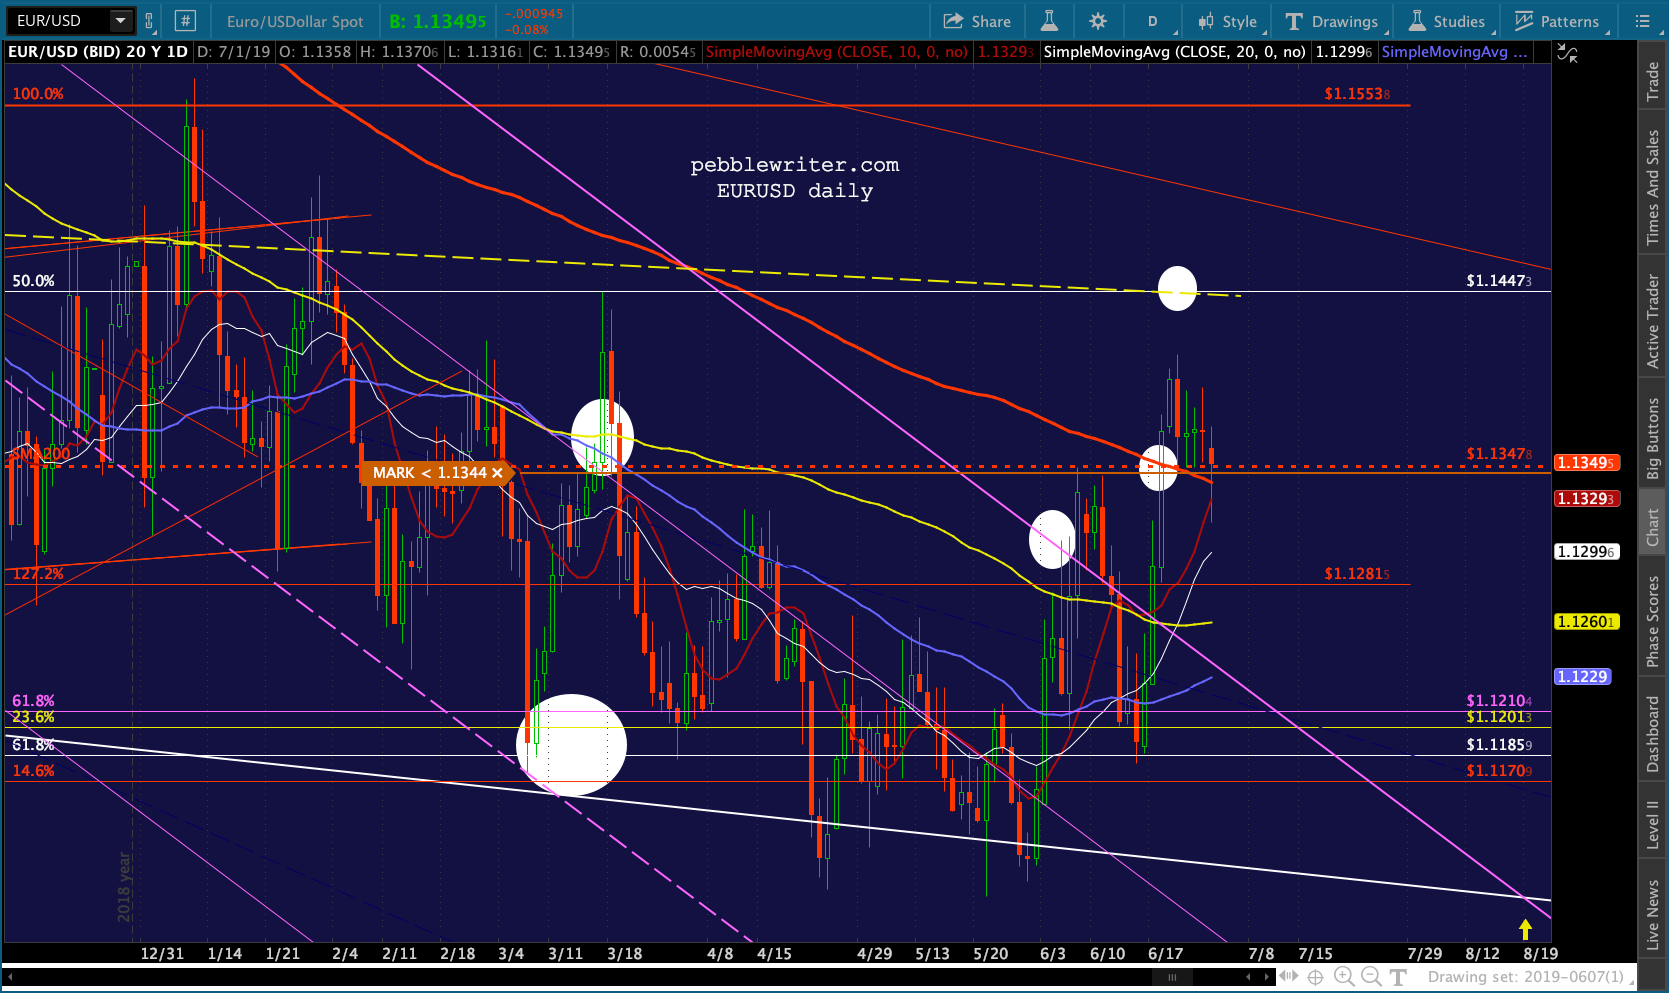 …and USDJPY reaches its channel top.
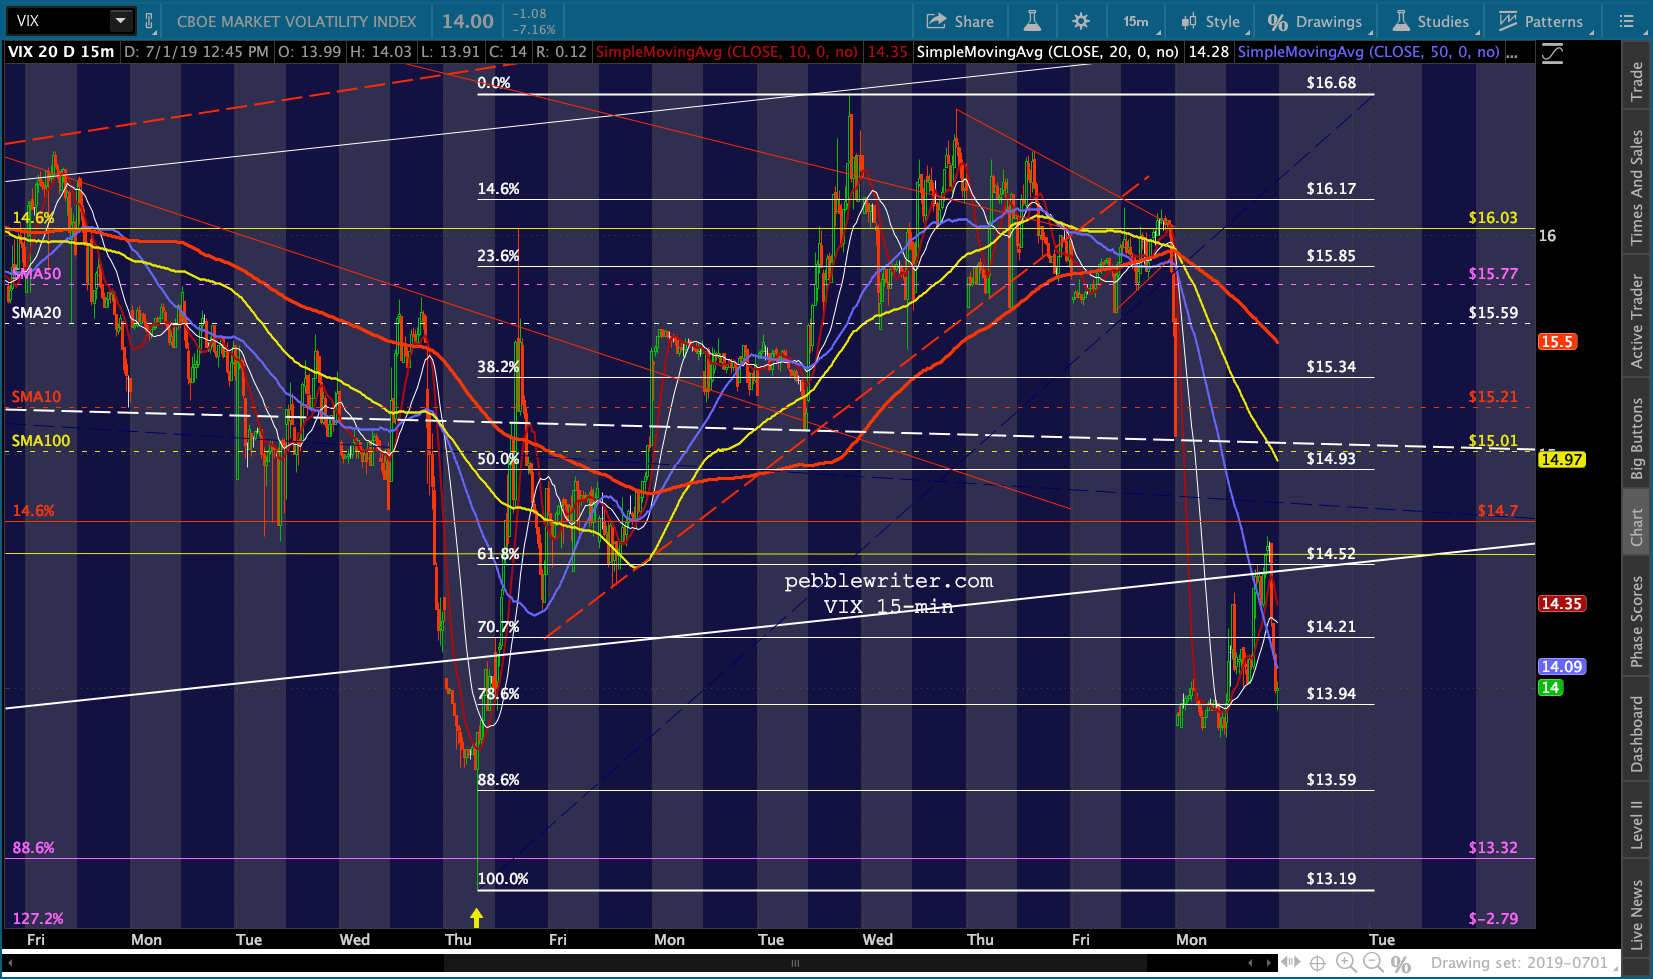
  VIX, which broke down through its latest straw-man TL of support last week, has continued its losses — but, no new lows.
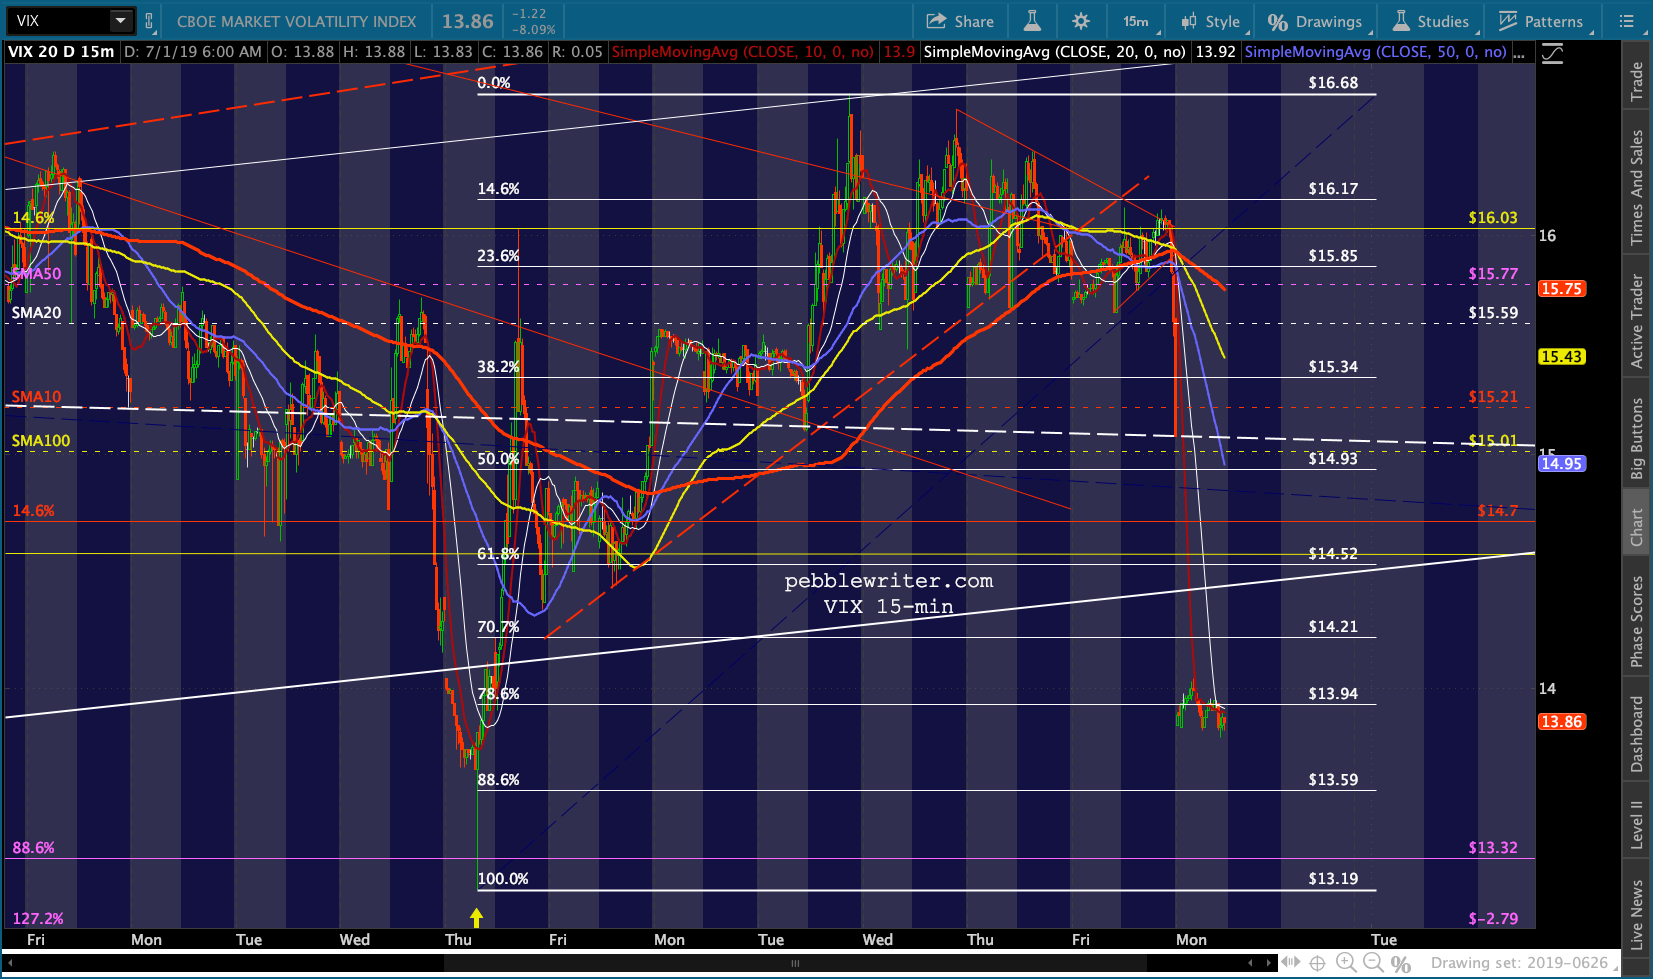 Bottom line, the charts suggest another pop and drop. Trade safely…
UPDATE: 3:50 PM
Not an impressive breakout. At this point, not even a breakout…just enough to screw with the Fib patterns.