

Yesterday’s initial selloff never had a chance, as VIX tagged our upside target and dropped like a rock.  This left ES with an easy backtest of the internal TL noted yesterday morning and…drumroll, please…a V-shaped recovery.
 continued for members…
It has plenty of help from USDJPY which, even though DXY didn’t really go anywhere, rallied before even backtesting the channel it broke out of.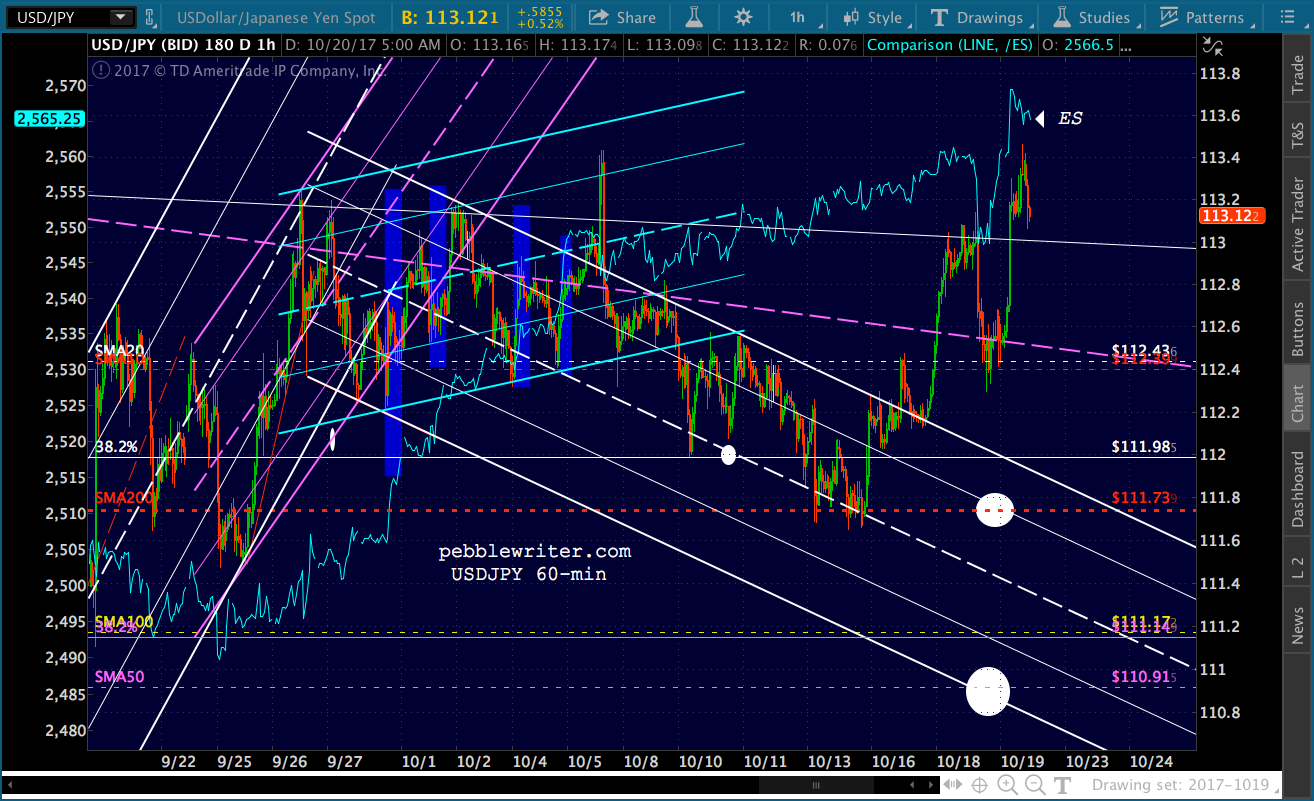 Today’s other movers and shakers… The USD isn’t exactly inspiring confidence.
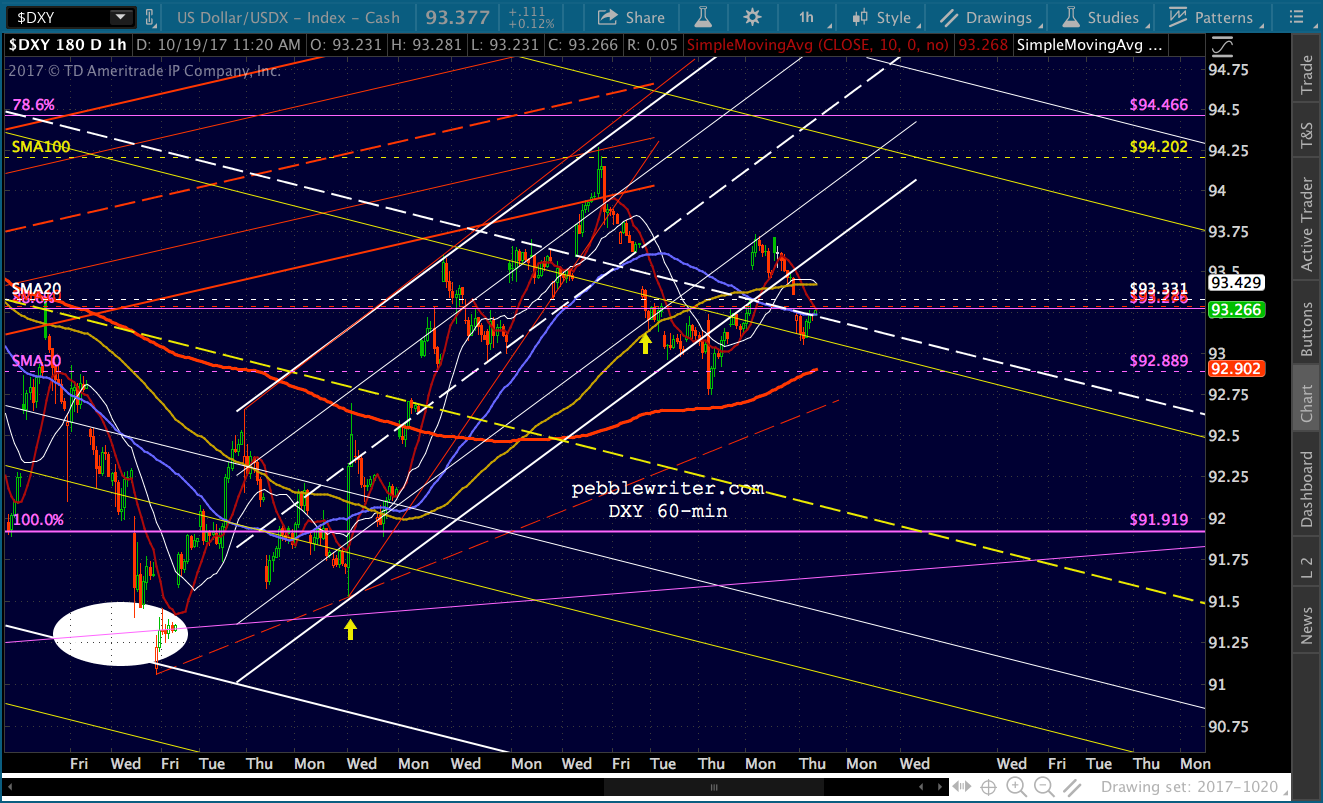
While CL continues to break down — at least a bit…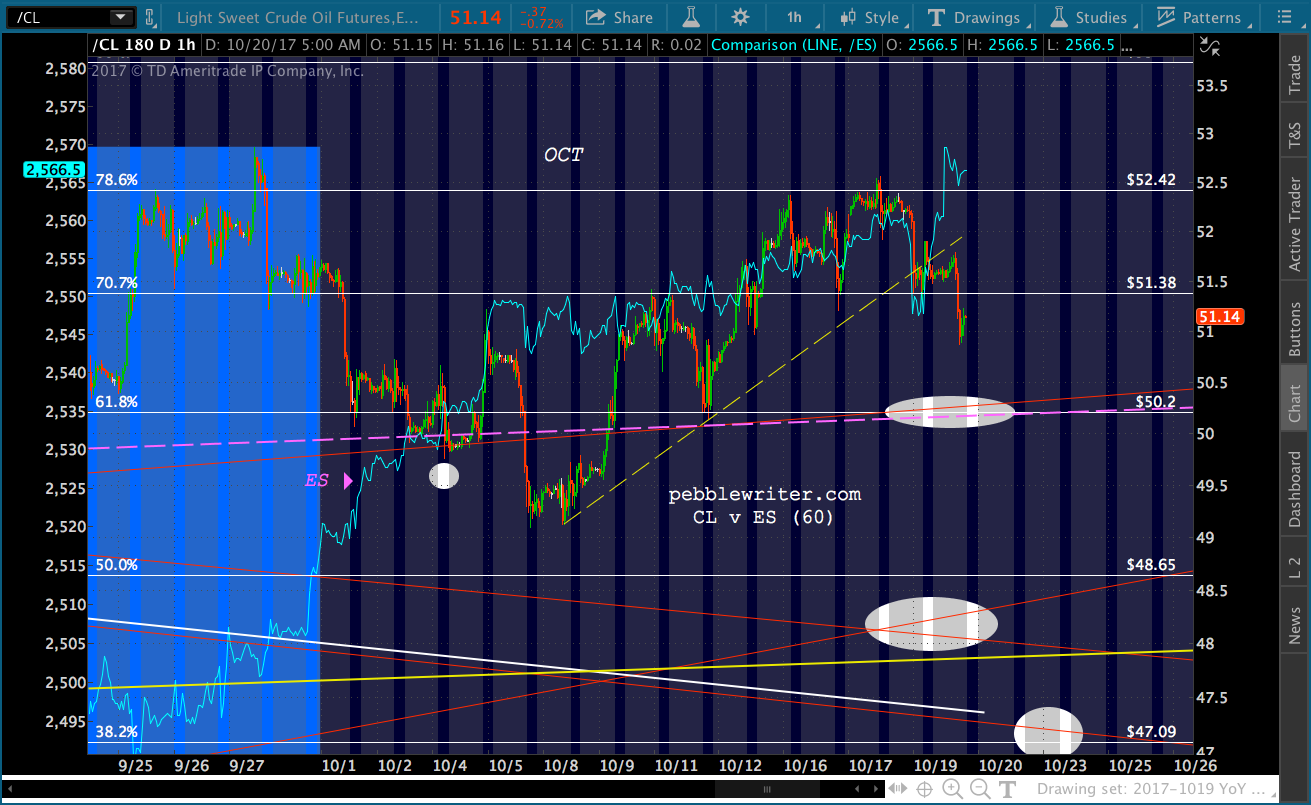
…and, RB is still lurking in the top end of the falling channel — perhaps waiting for the end of the month as in September.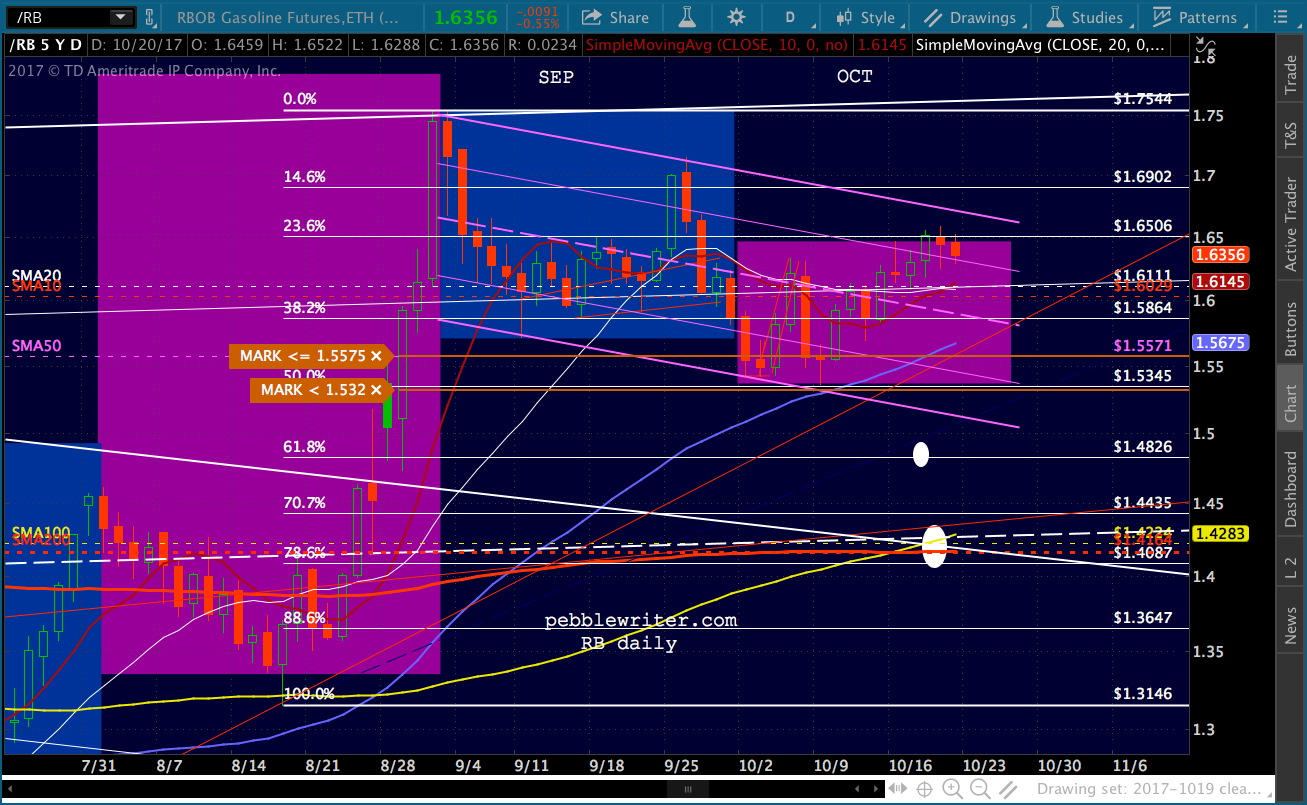 Having nearly completed my cross-country journey, I’m going to take Monday off for a little R&R.
Have a great weekend everyone and I’ll be back with you on Tuesday.
GLTA.
Comments
One response to “Charts I’m Watching: Oct 20, 2017”
Hello PW, something for you to think about in the weekend.
There is a big disconnect with average stocks and the index.
Dow and SPX are making new high day by day. It would create an impression that most stocks are at 52 week high. But it is not true. Actually, many big cap stocks are near 52 week low or multi year low. Examples are GE, Kimberly Clark, AT&T, CVS, etc
So, the bottom line is this new high of Dow and SPX are created by having a big disconnect. The new high is driving by only a few high flyers.
The only question is the big disconnect will be resolved when (1) high flyers stocks come down, or (2) the 52 week low losers catch up?