

Thirty years ago today the DJIA plunged 508 points (22%) in a single day, sending traders and money managers scurrying for cover and analysts for an explanation.
I was trading a (well-hedged) options-based risk arb portfolio at the time and remember well going toe to toe with my compliance department, which had panicked and wanted to liquidate everything in sight.
Less than two years later, the market had recovered those losses. While academics continued to argue over the causes of the meltdown, investors soon forgot all about it.
Since becoming a chartist, I’ve revisited that period many times. And, the patterns are exceptionally clear.
Why did the Dow stop dropping at 508 points? Simple. It was an attempt to keep the rising price channel from breaking down completely.
 Why were stocks so overheated in the first place? Again, the pattern is pretty clear. The breakout from the 1965-1984 triangle was very sharp, never even backtesting the triangle.
  In reality, the 1987 crack was a backtest (albeit a dramatic one) of the .236 channel line in a channel dating back to before the Depression.
 Investors are understandably curious as to whether today’s market bears any resemblance to the 1987 one and, if so, whether a similar tumble might be in store. My take: yes and no (with a caveat.)
continued for members…
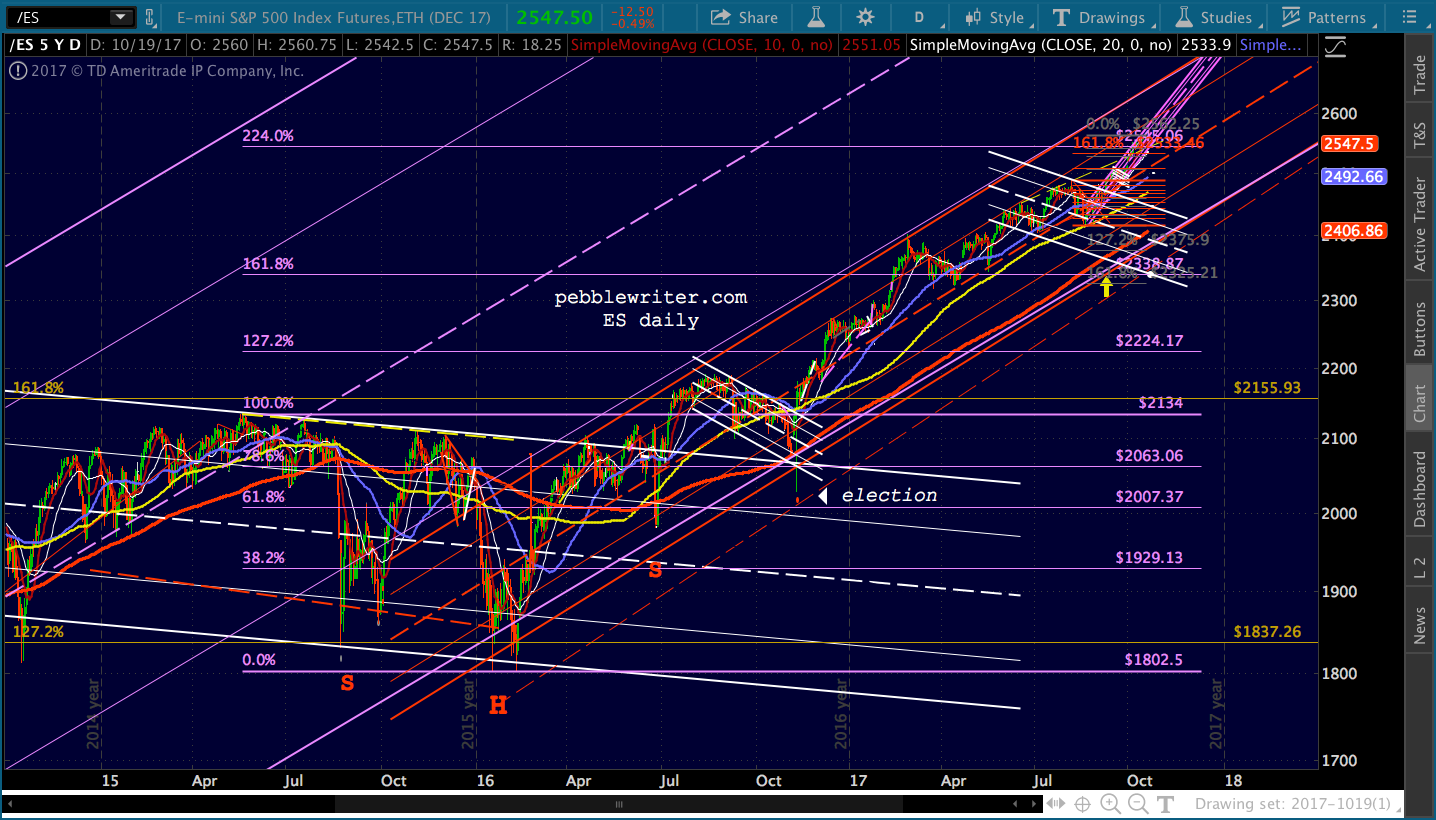
Although the breakout and failure to backtest the 2015-2017 consolidation are very similar, the tools that central bankers have at their disposal are much more robust today. Witness the recoveries from Brexit, the US election, etc.
I’d be gratified if the little purple channel broke down and we finally backtested 2500. But, I don’t see it going much beyond that without the Fed, ECB, BoJ, and SNB doing “whatever is necessary” to stabilize markets. There’s no question they have the firepower, and are more than willing to use it.
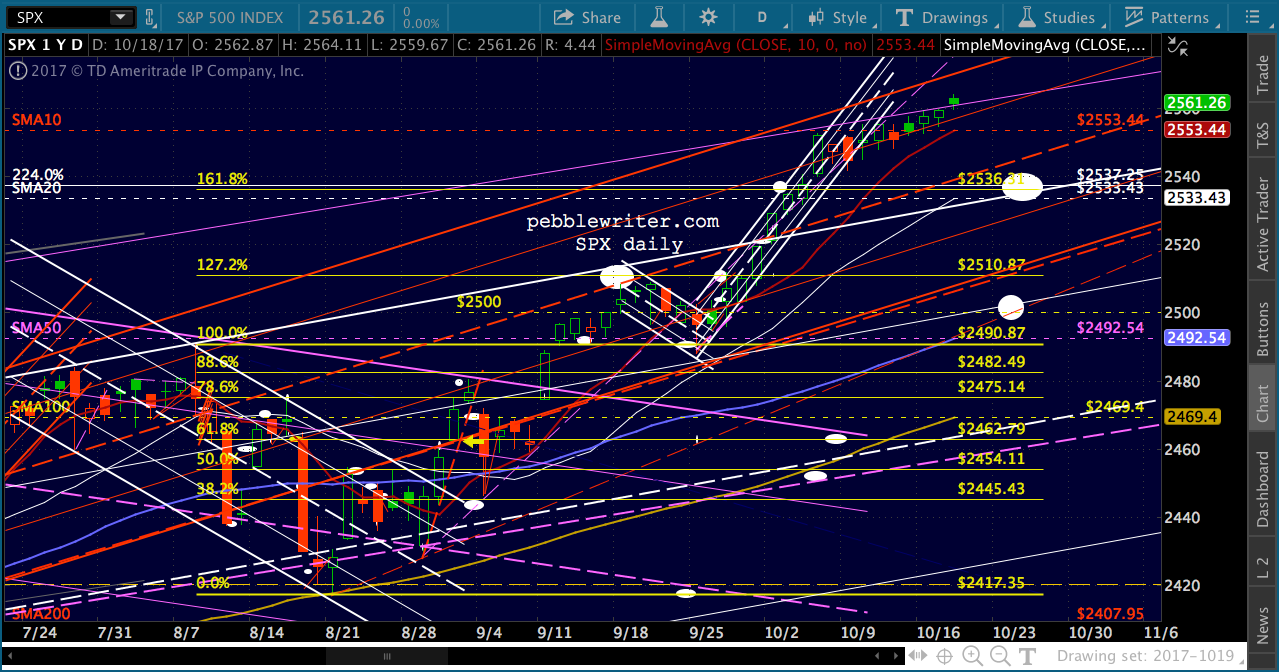
 SPX’s version: note that our targets remain unchanged with a backtest at 2536 the most likely case and, if things get carried away, 2500 being the next most critical support.
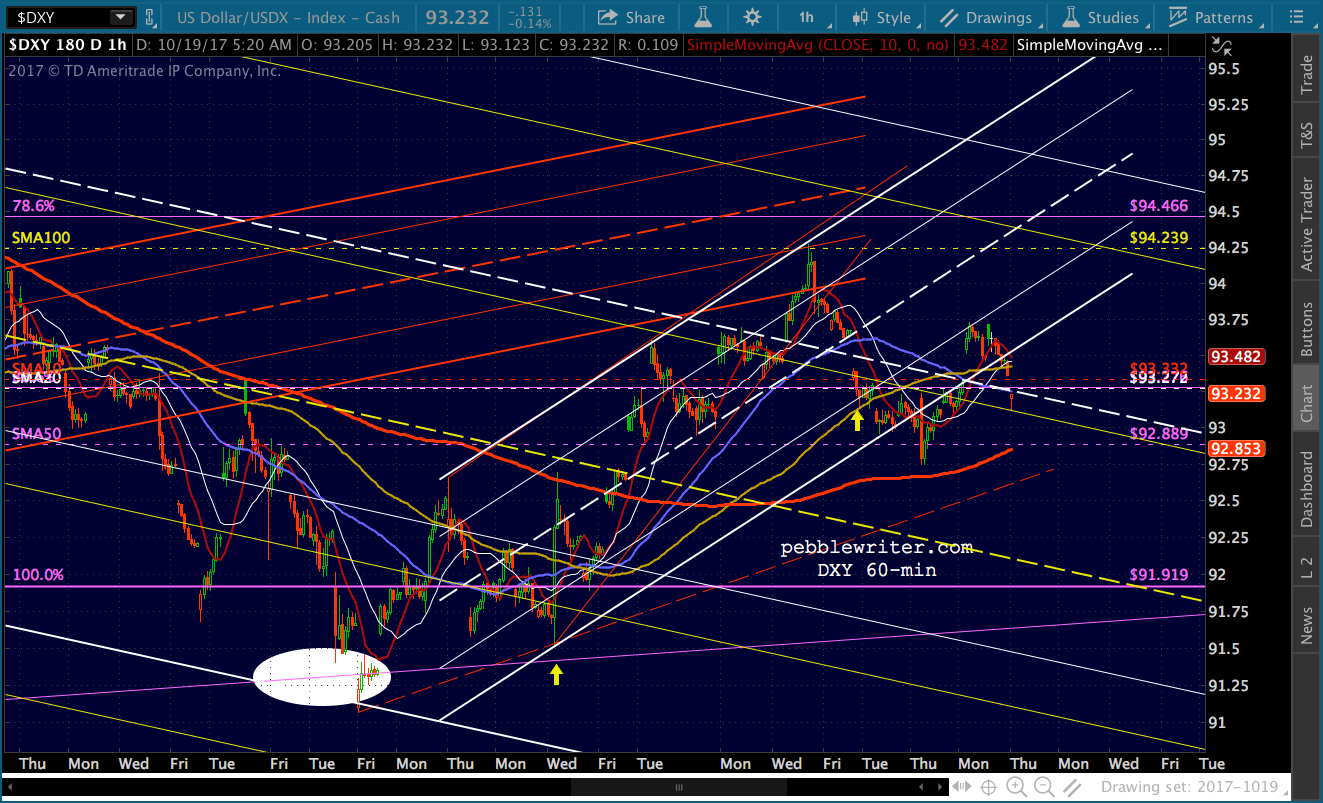
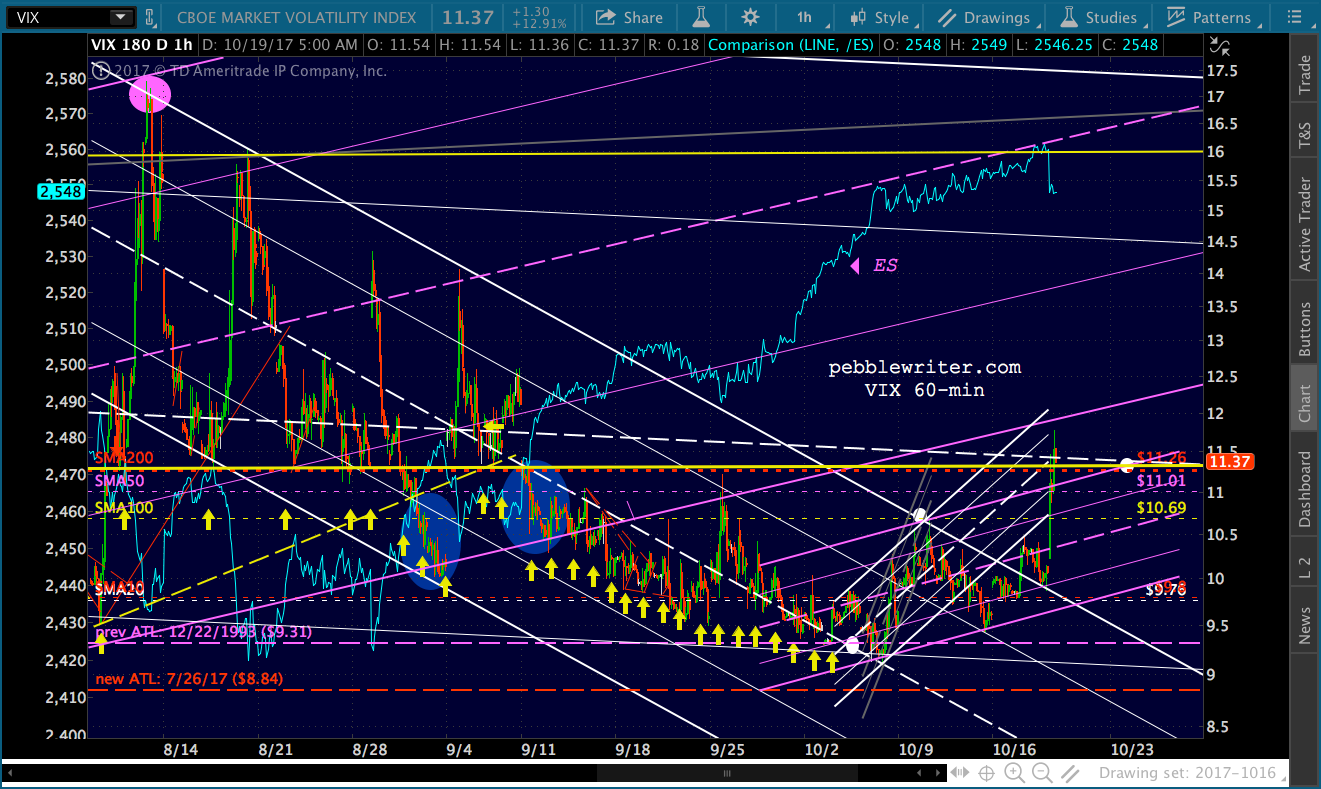
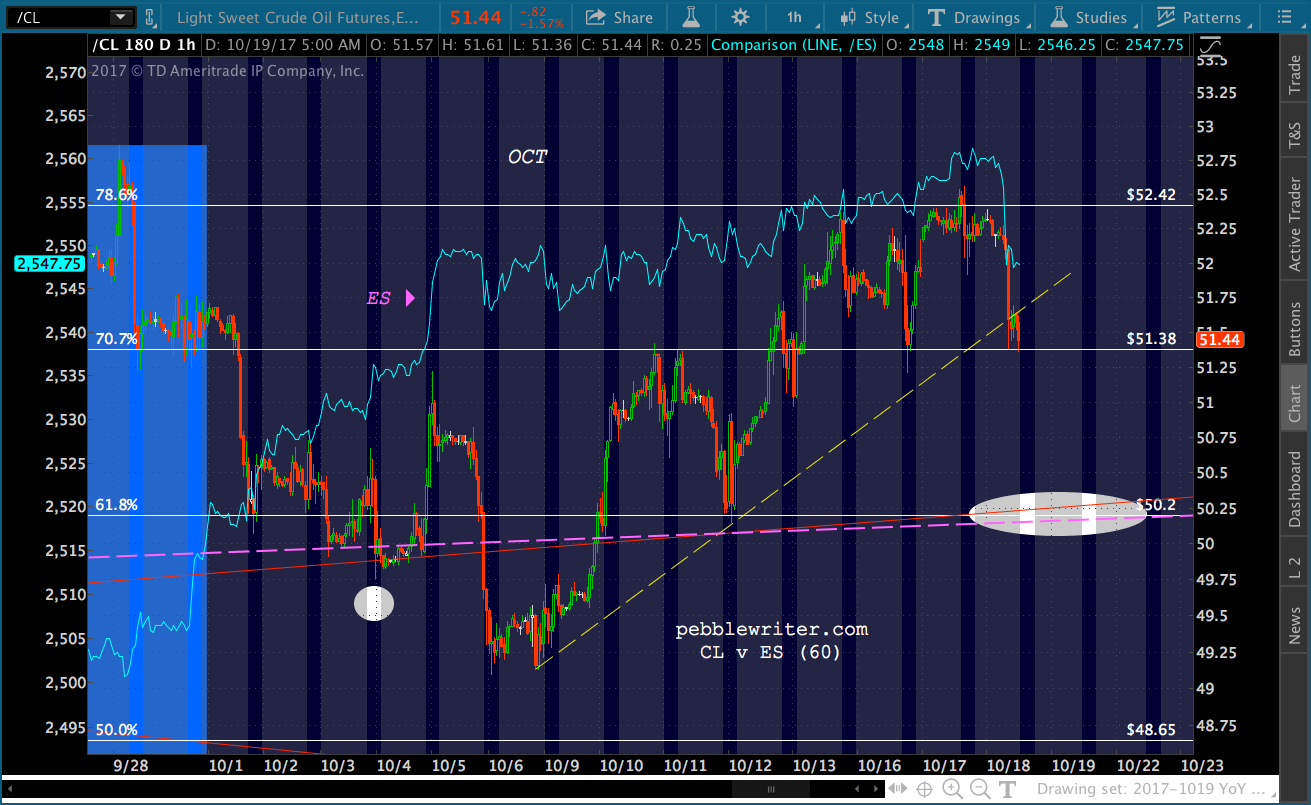
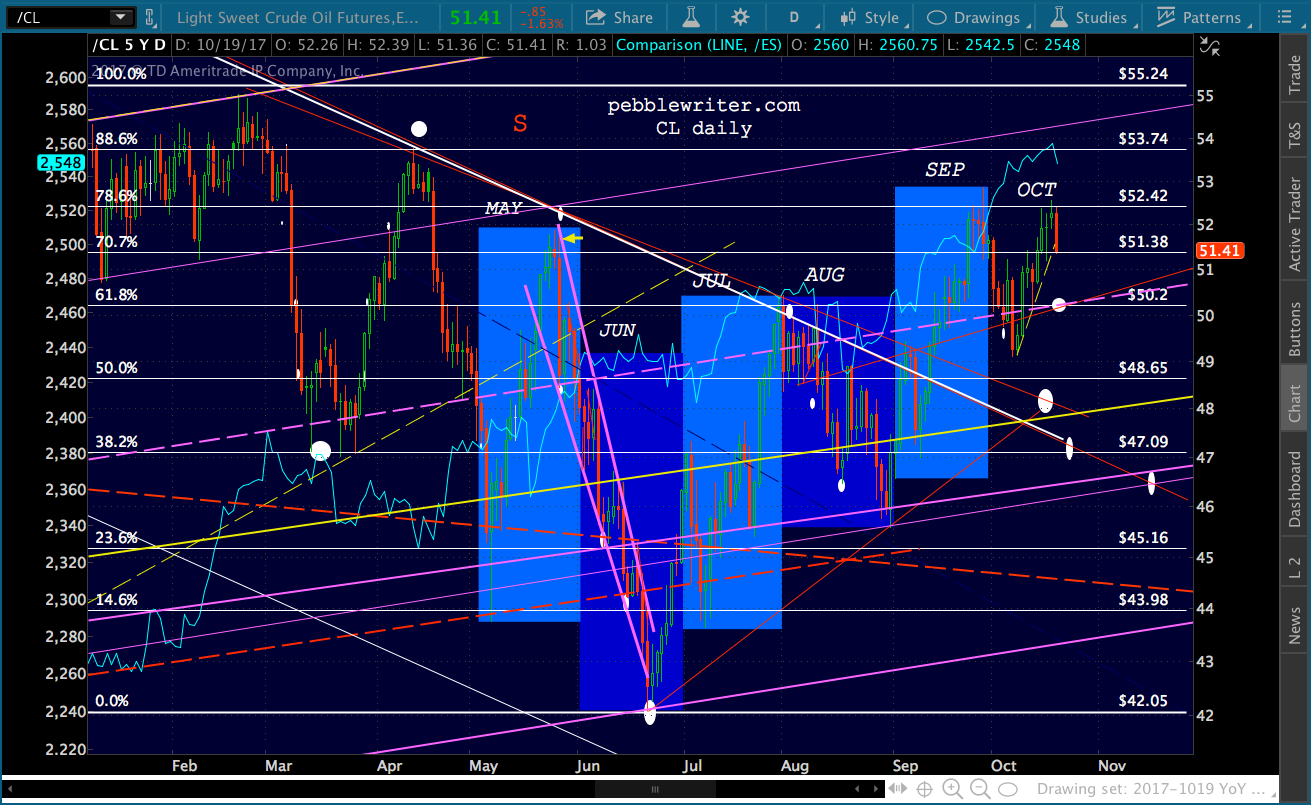
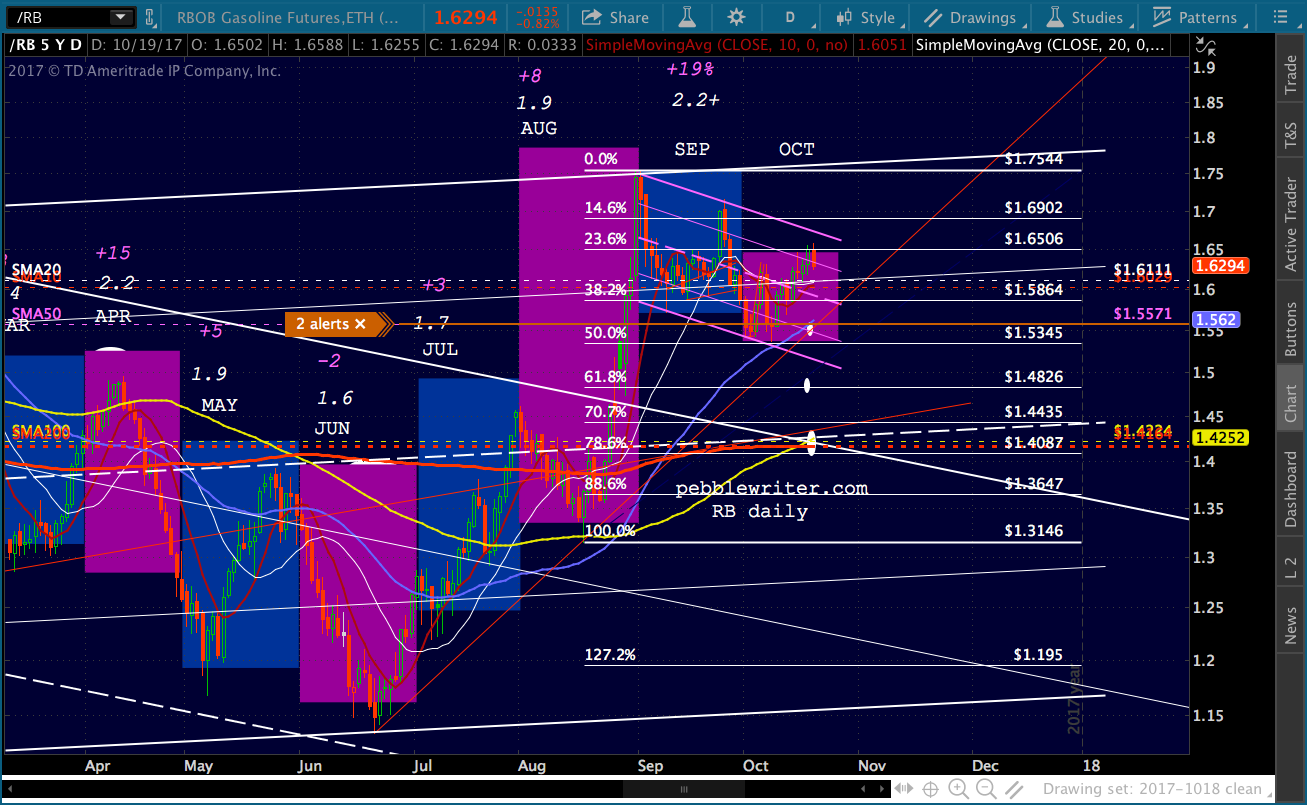
 The caveat: I see plenty of room for downside. How about a backtest of SPX 2138, for starters? But, first, we’d need to see DXY, USDJPY, CL and RB decline significantly and for VIX (which has reached our upside target) to leap above the yellow channel bottom it’s hovering beneath.

 I’m still on the road today (through tomorrow) so will look forward to hearing how things turn out much later tonight.
GLTA.