

Today should be helpful in understanding where, exactly, we are with our analog. So far, it’s shaping up as a battle between VIX, which continues to be hammered, and CL, which is off another 2.65% so far this morning.

continued for members…
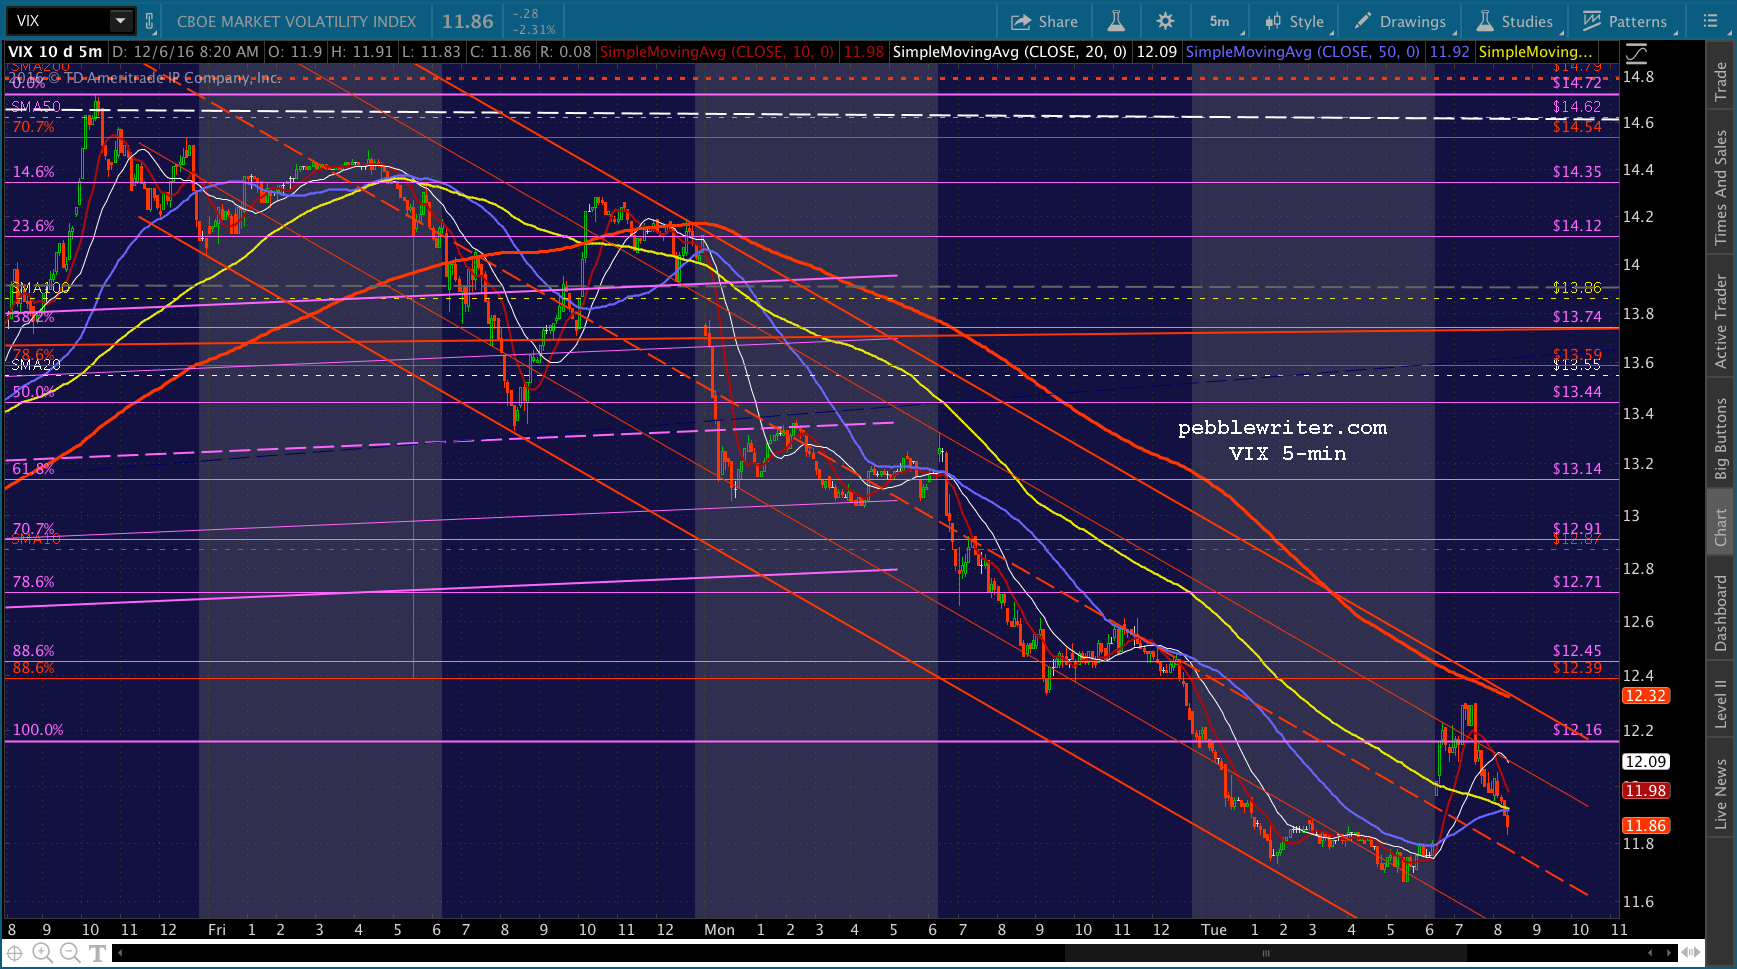
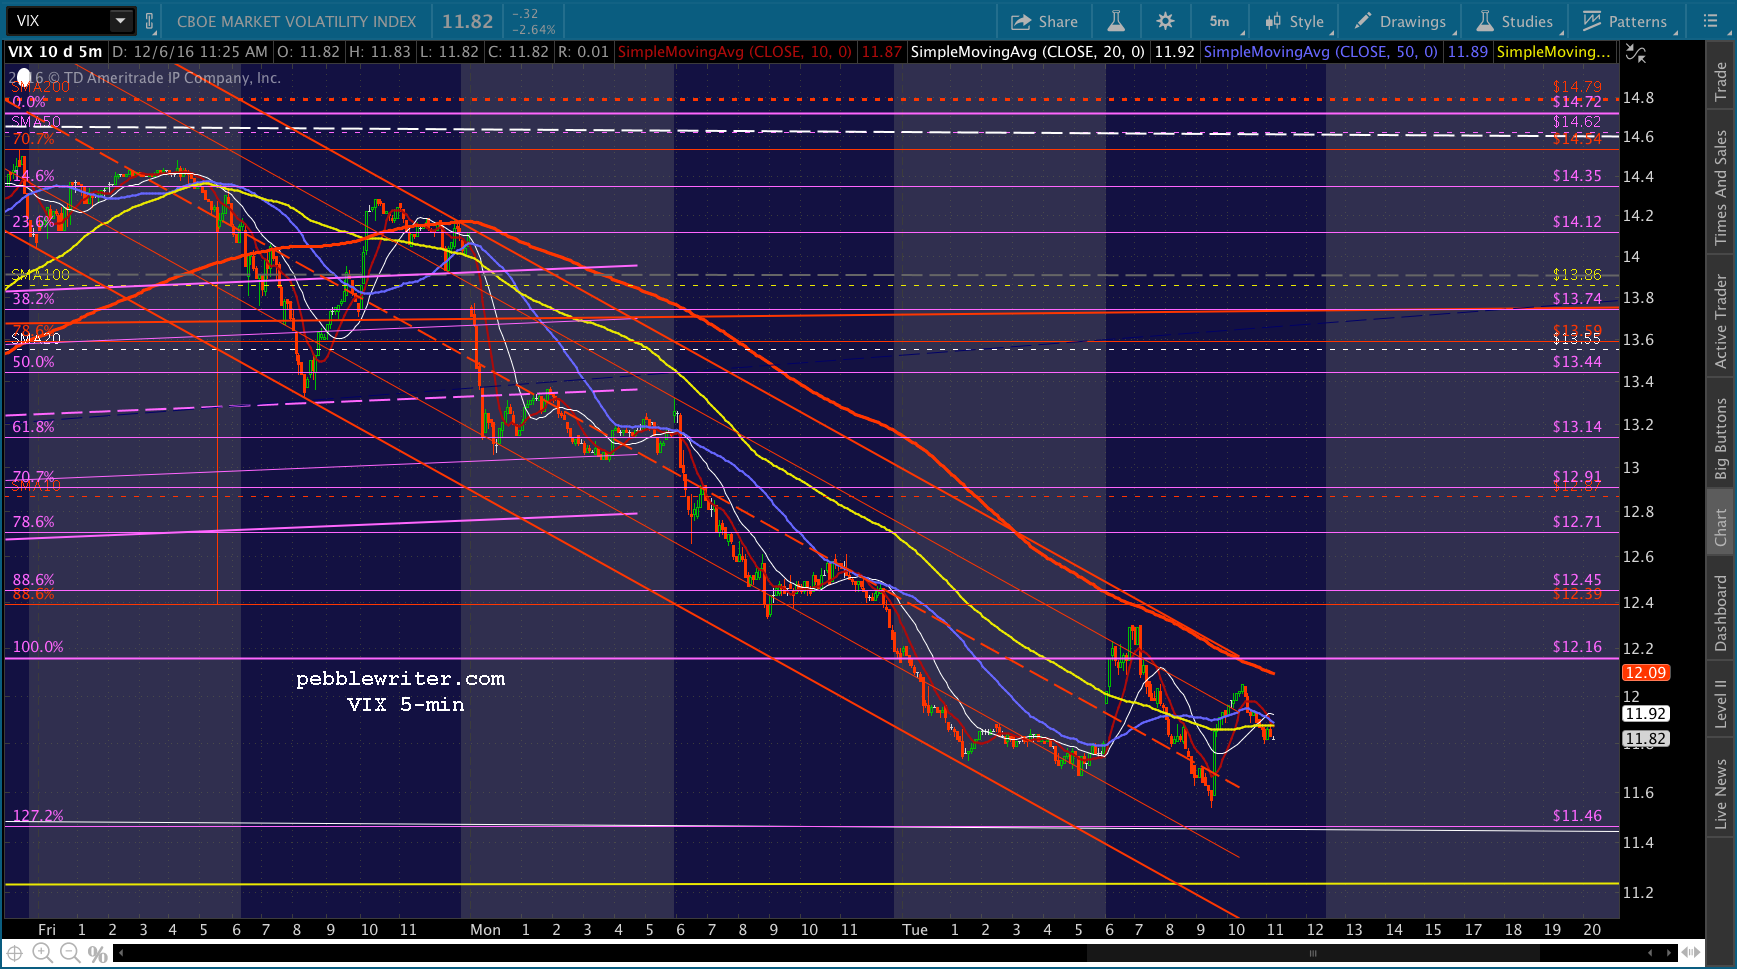
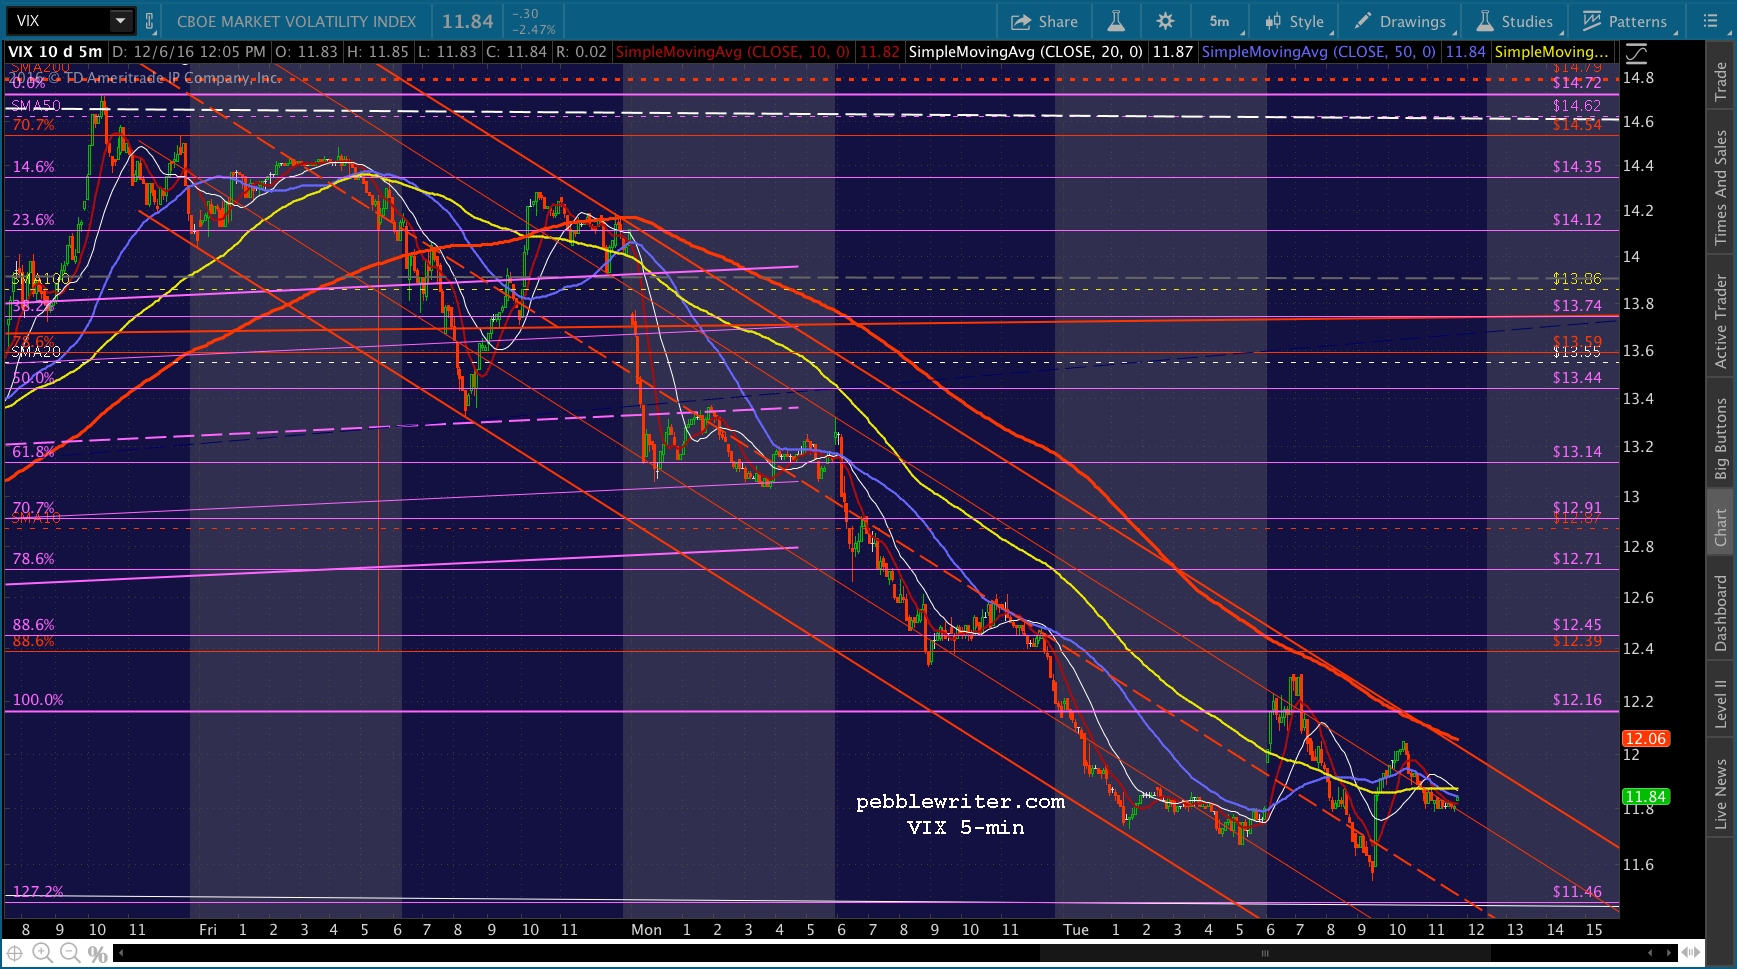
Clearly, VIX is pursuing the falling white channel rather than the rising red one. This sets up a test, and likely push below, the former 11.02 low around the end of the year in order to give SPX the boost it might need to finish the year positively.
ES is in position to break out or down.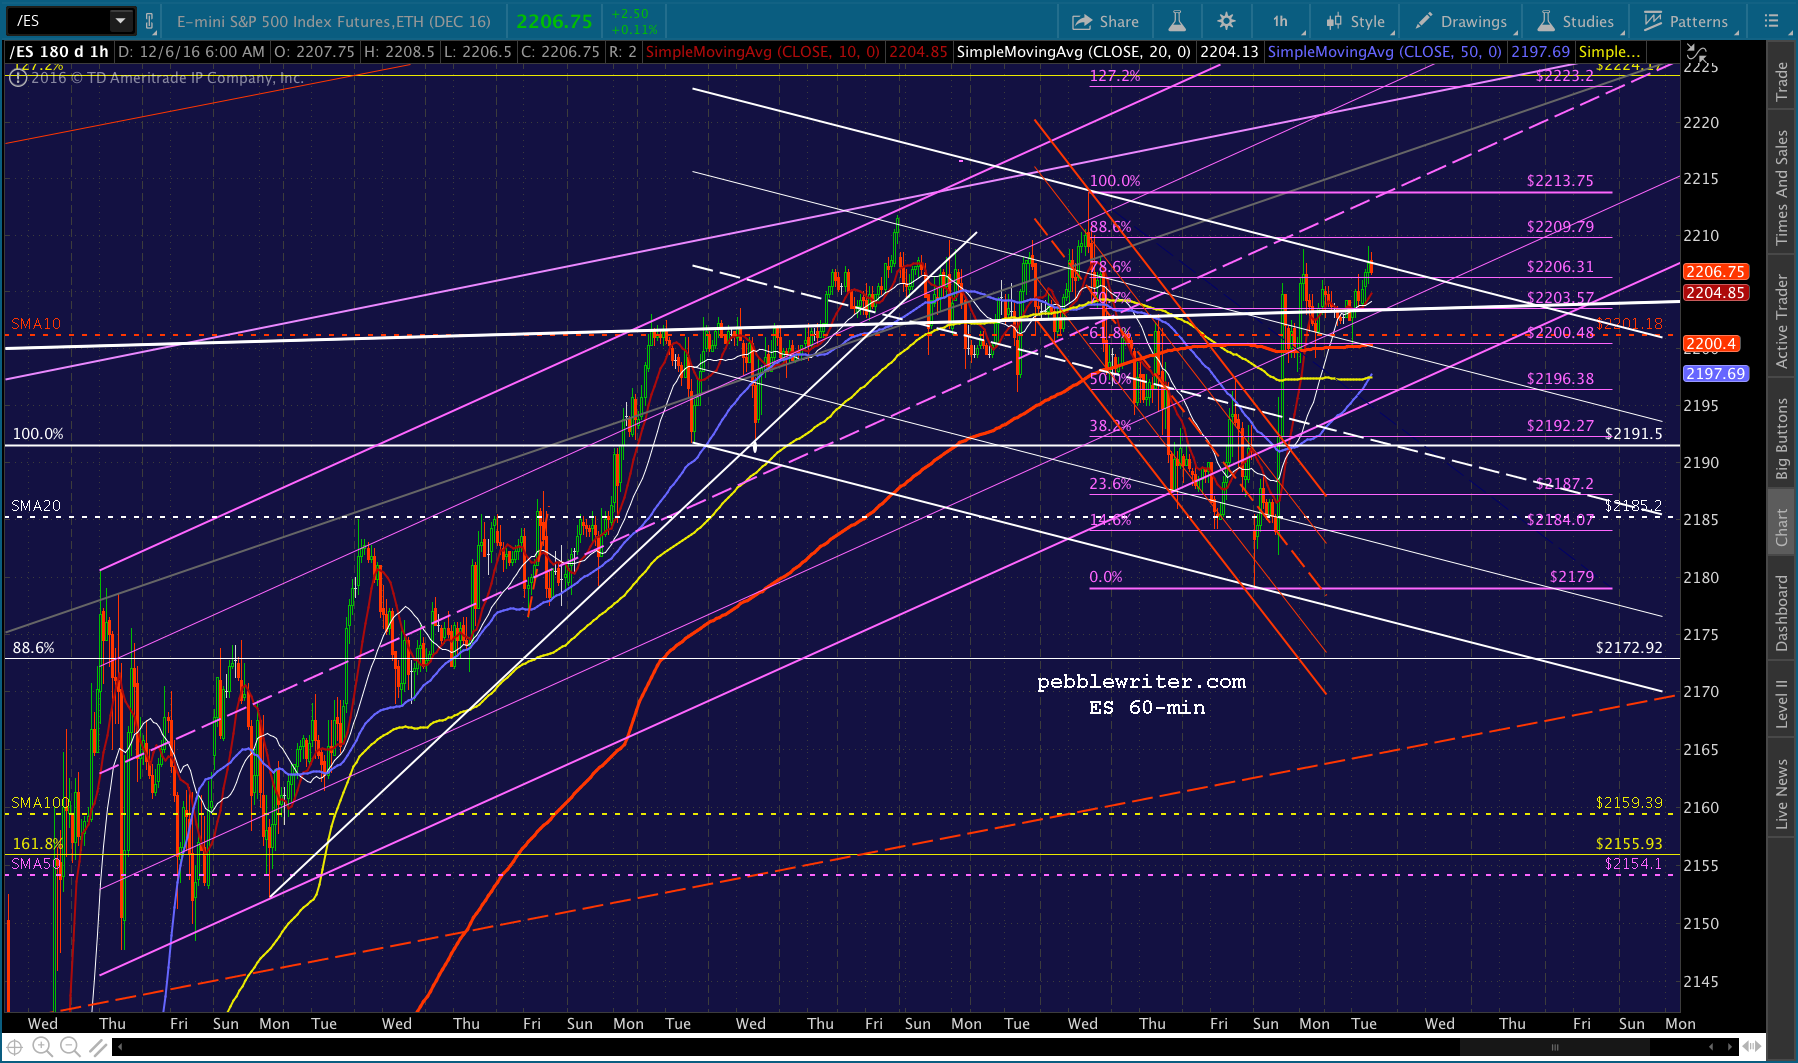
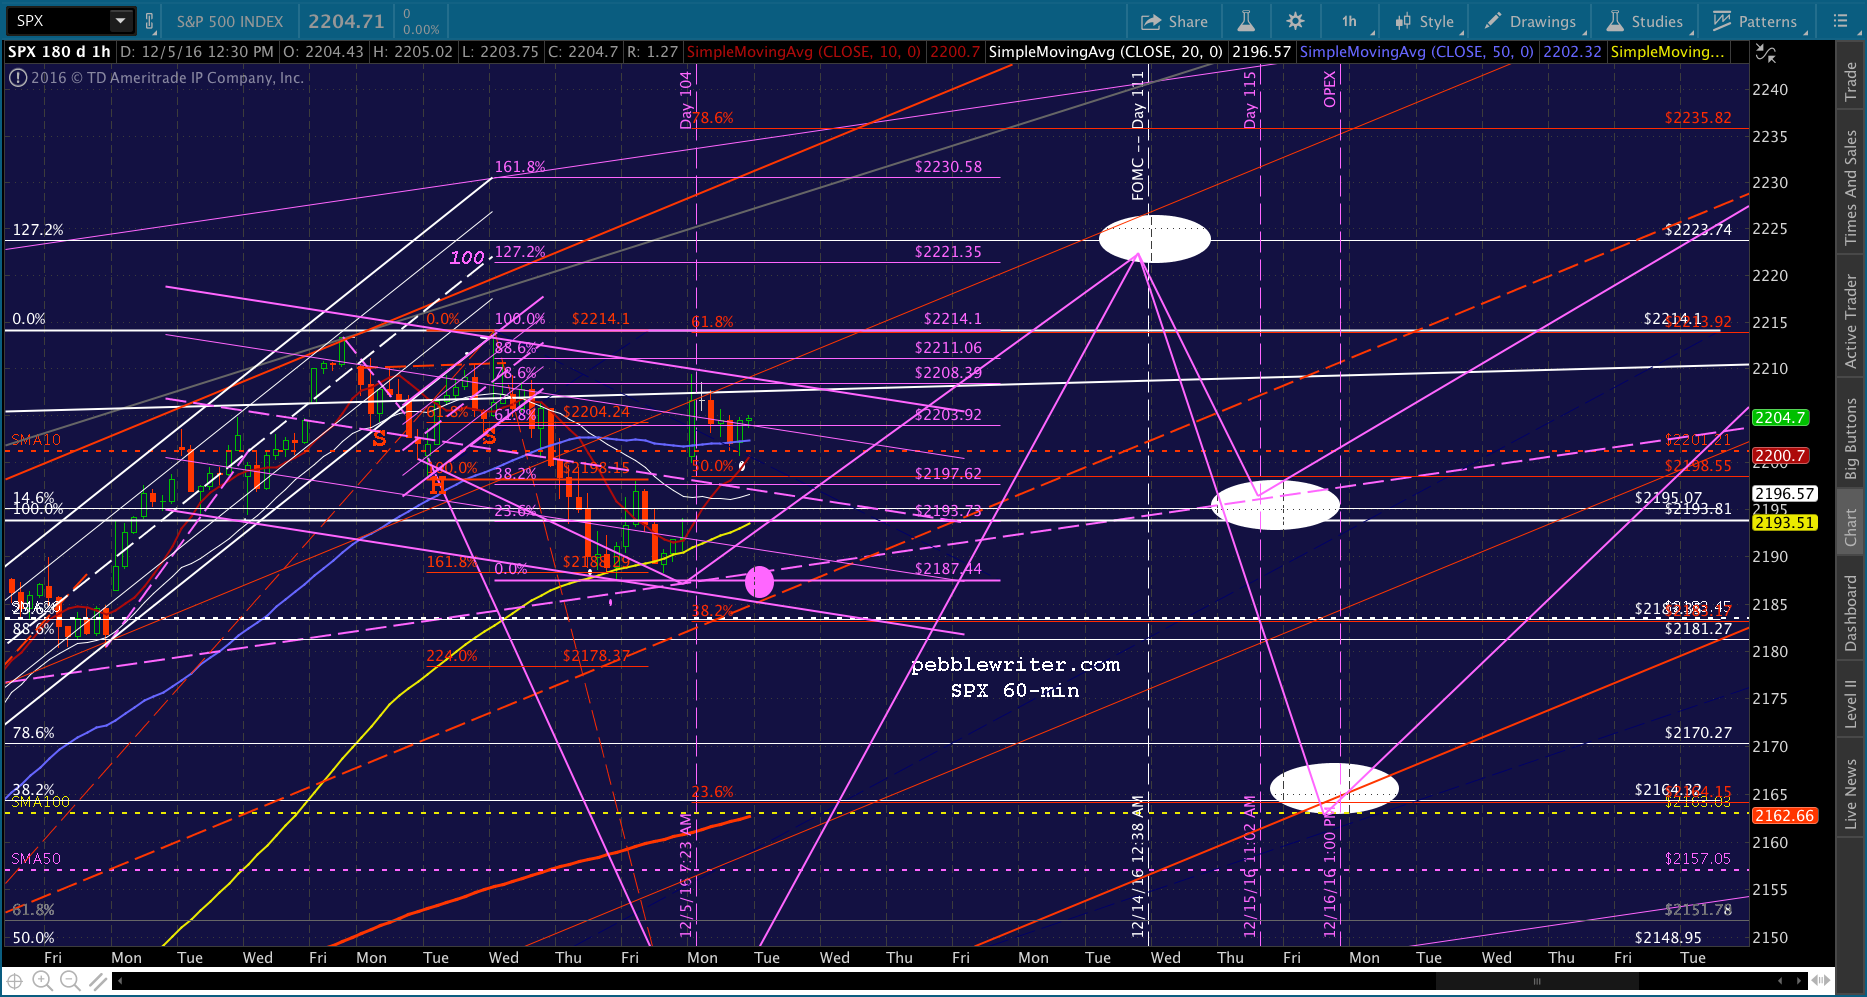
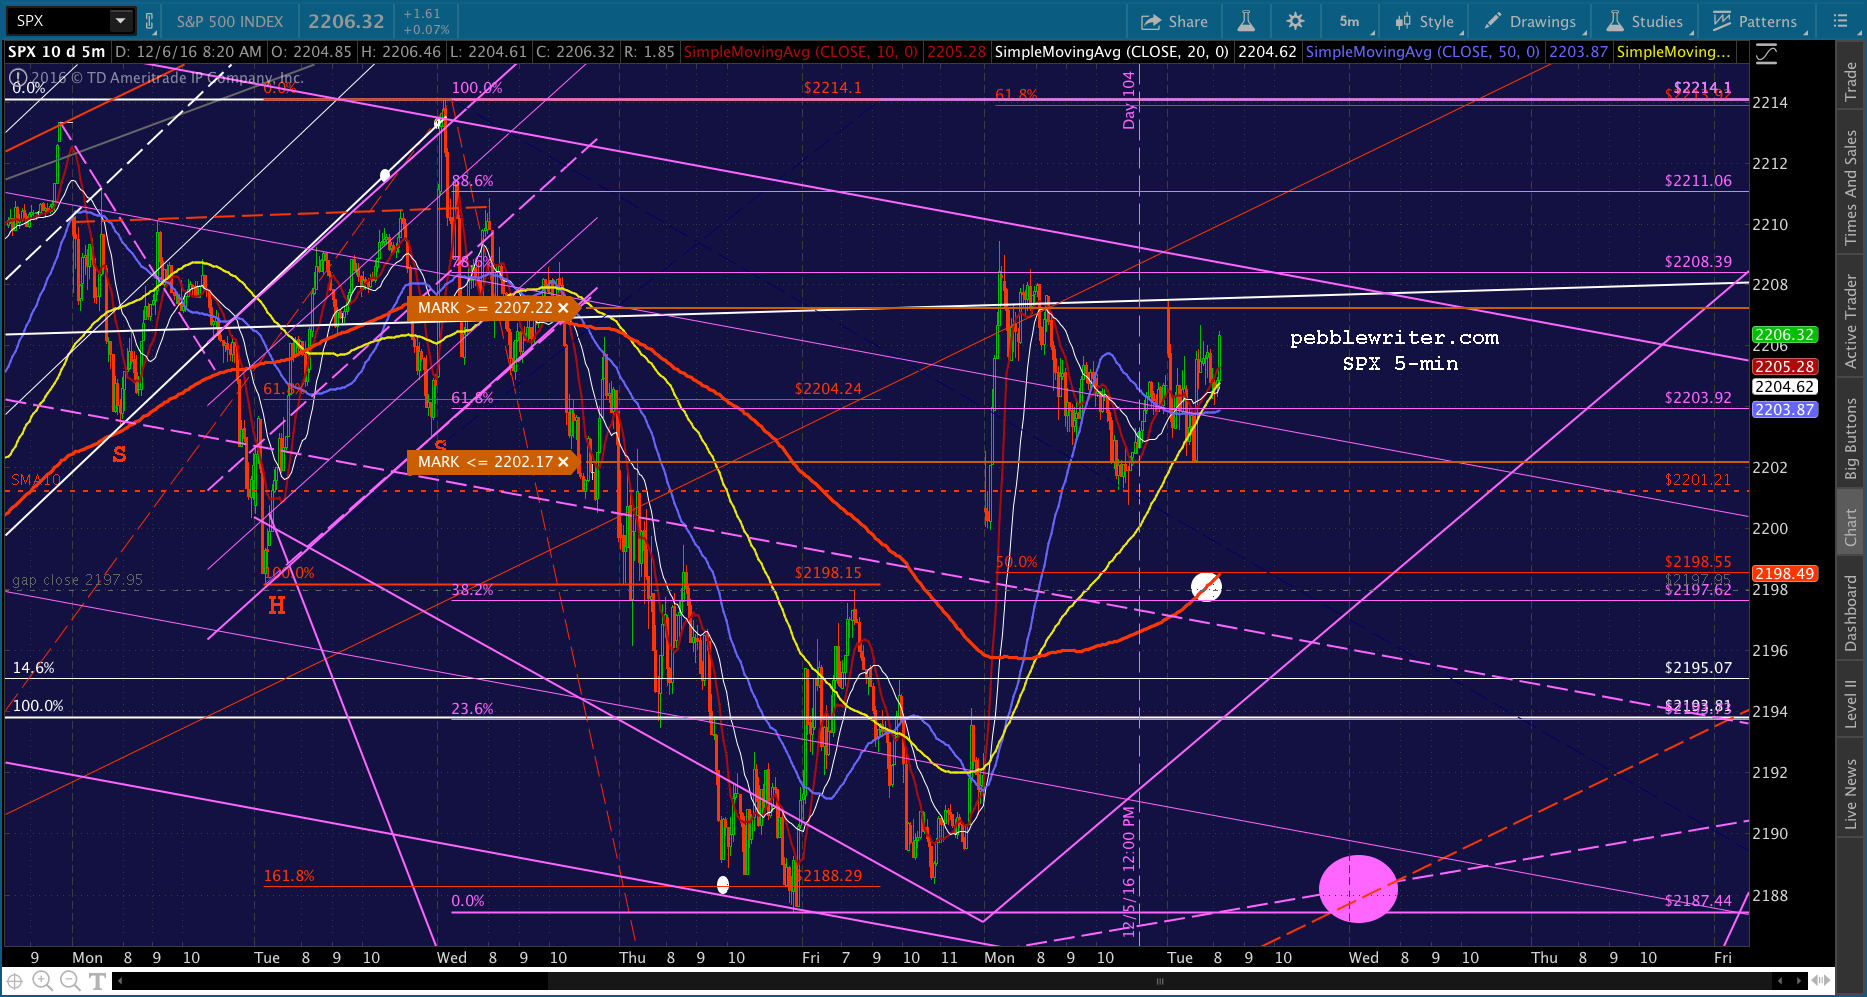
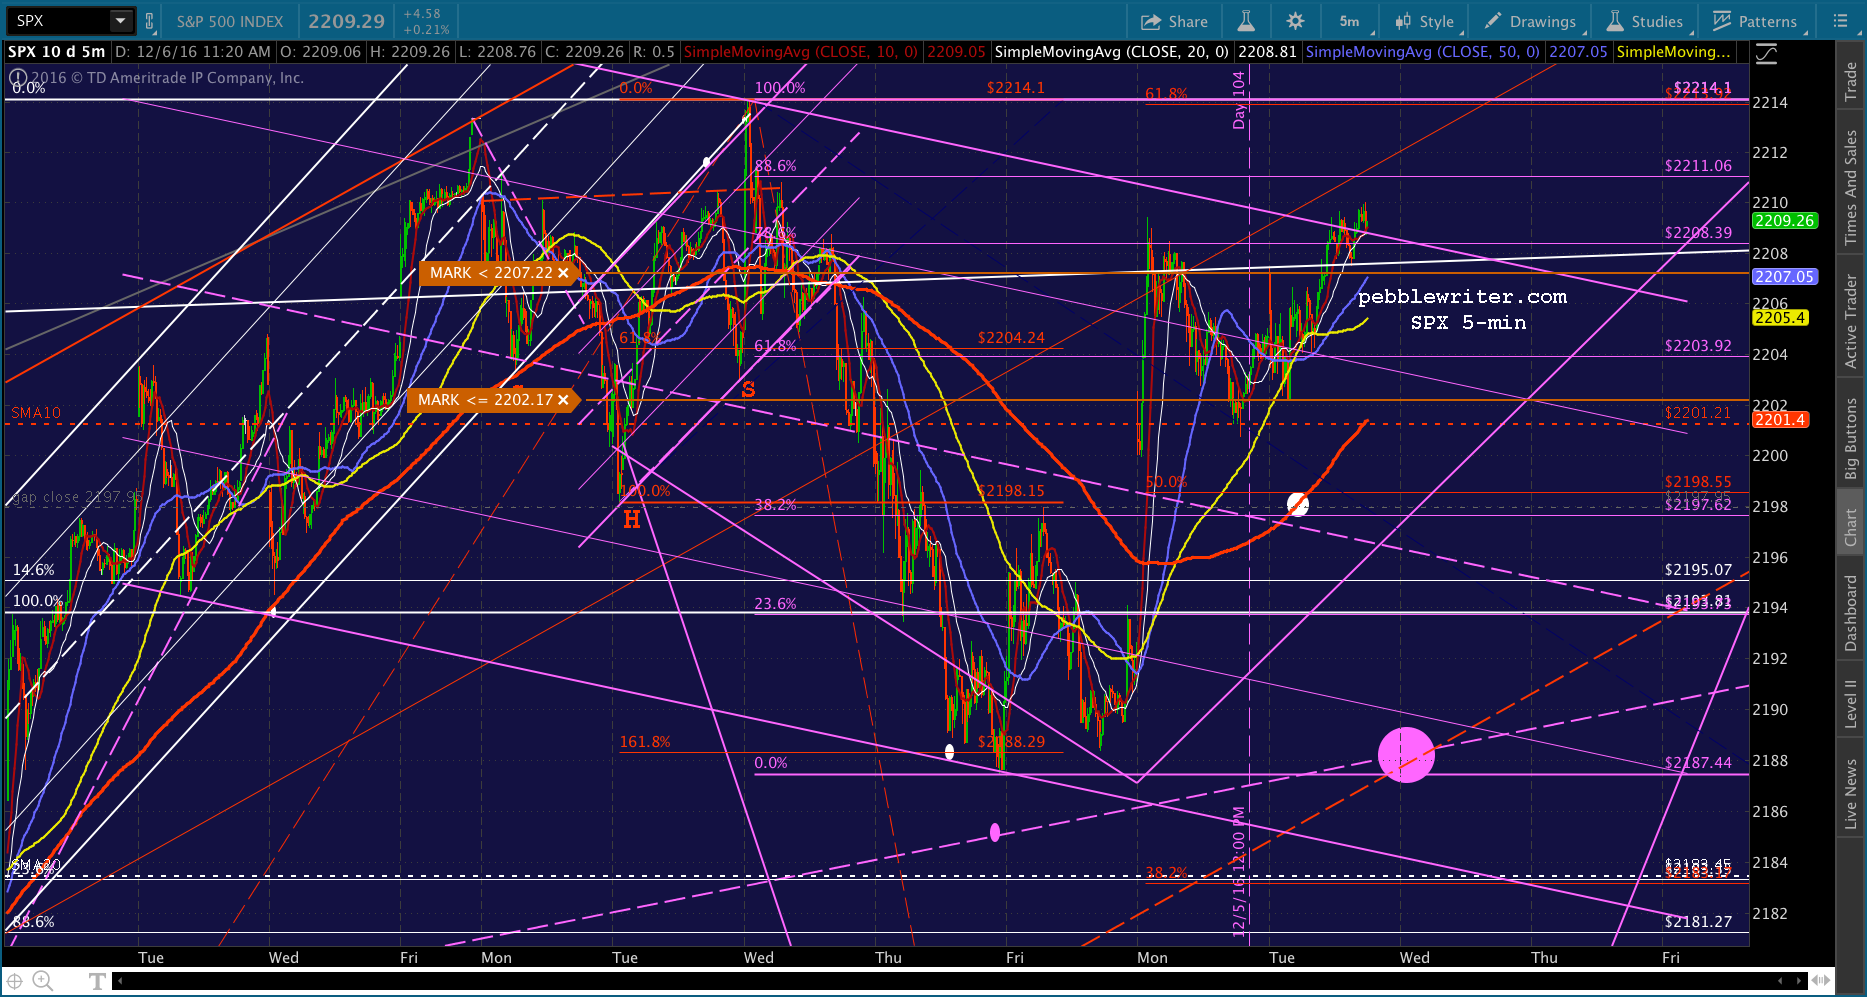
Per our analog, SPX either completed its “correction” on Friday, or could construct another leg down today. My bet is on the downside, though it could be a slightly lower low than we saw last week, just to complete the purple channel midline tag. That would be around 2183-2185. Between here and there, we have support at the SMA10 at 2201.21, the small purple channel midline at 2196.95 and the former high at 2193.81.
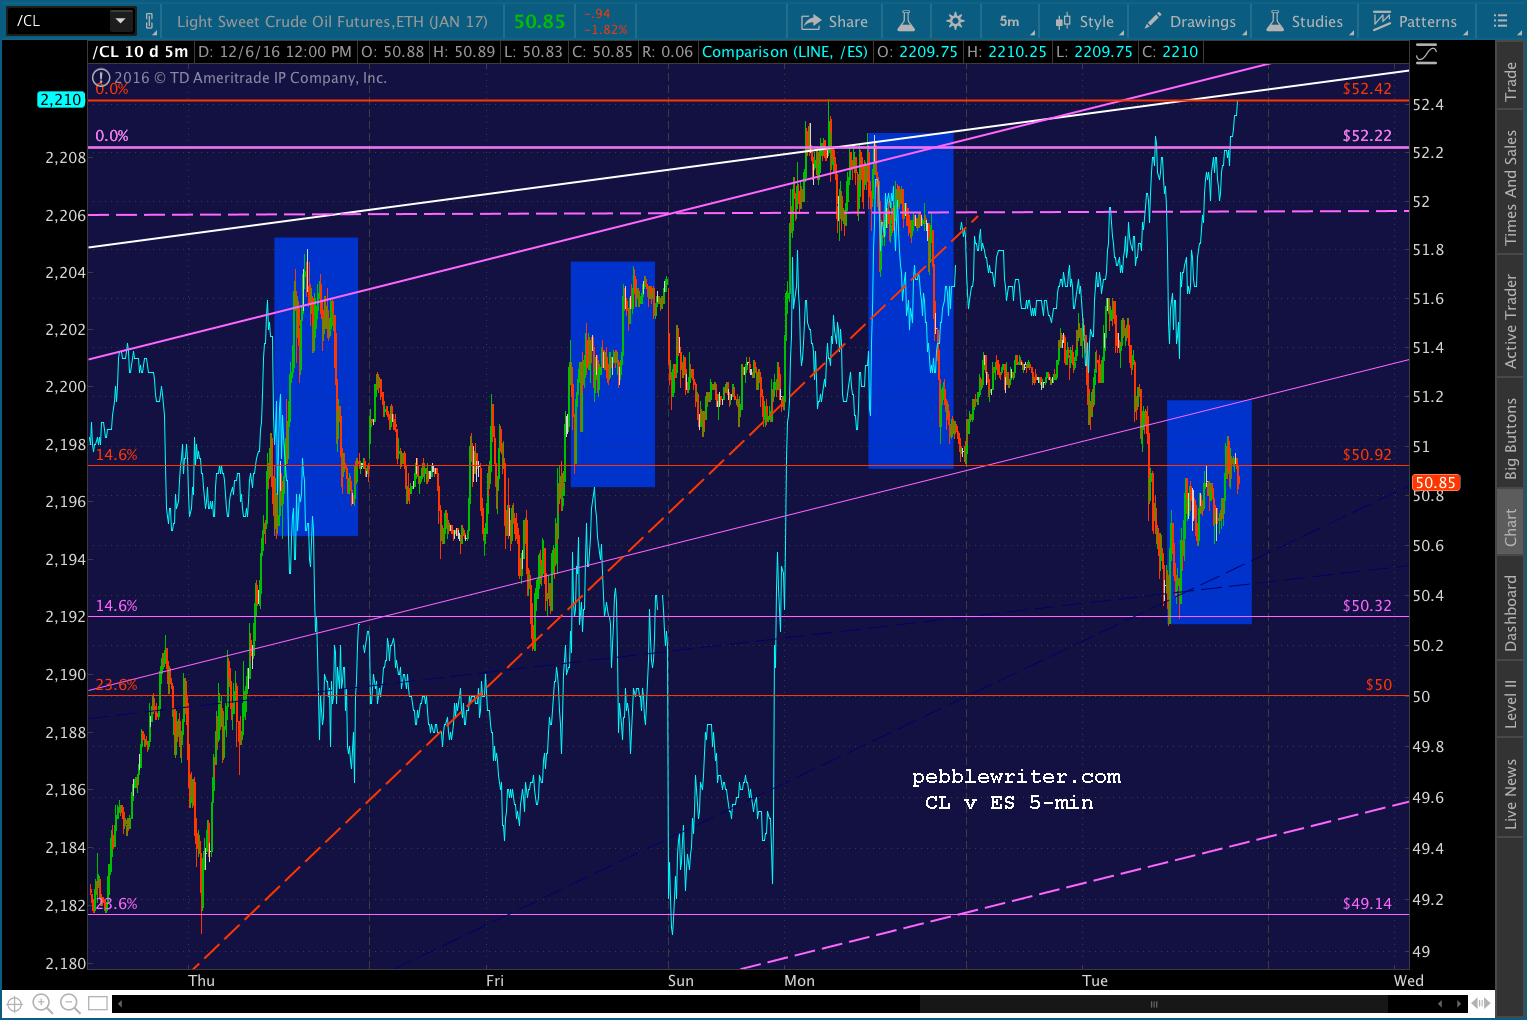
CL has a long ways to go.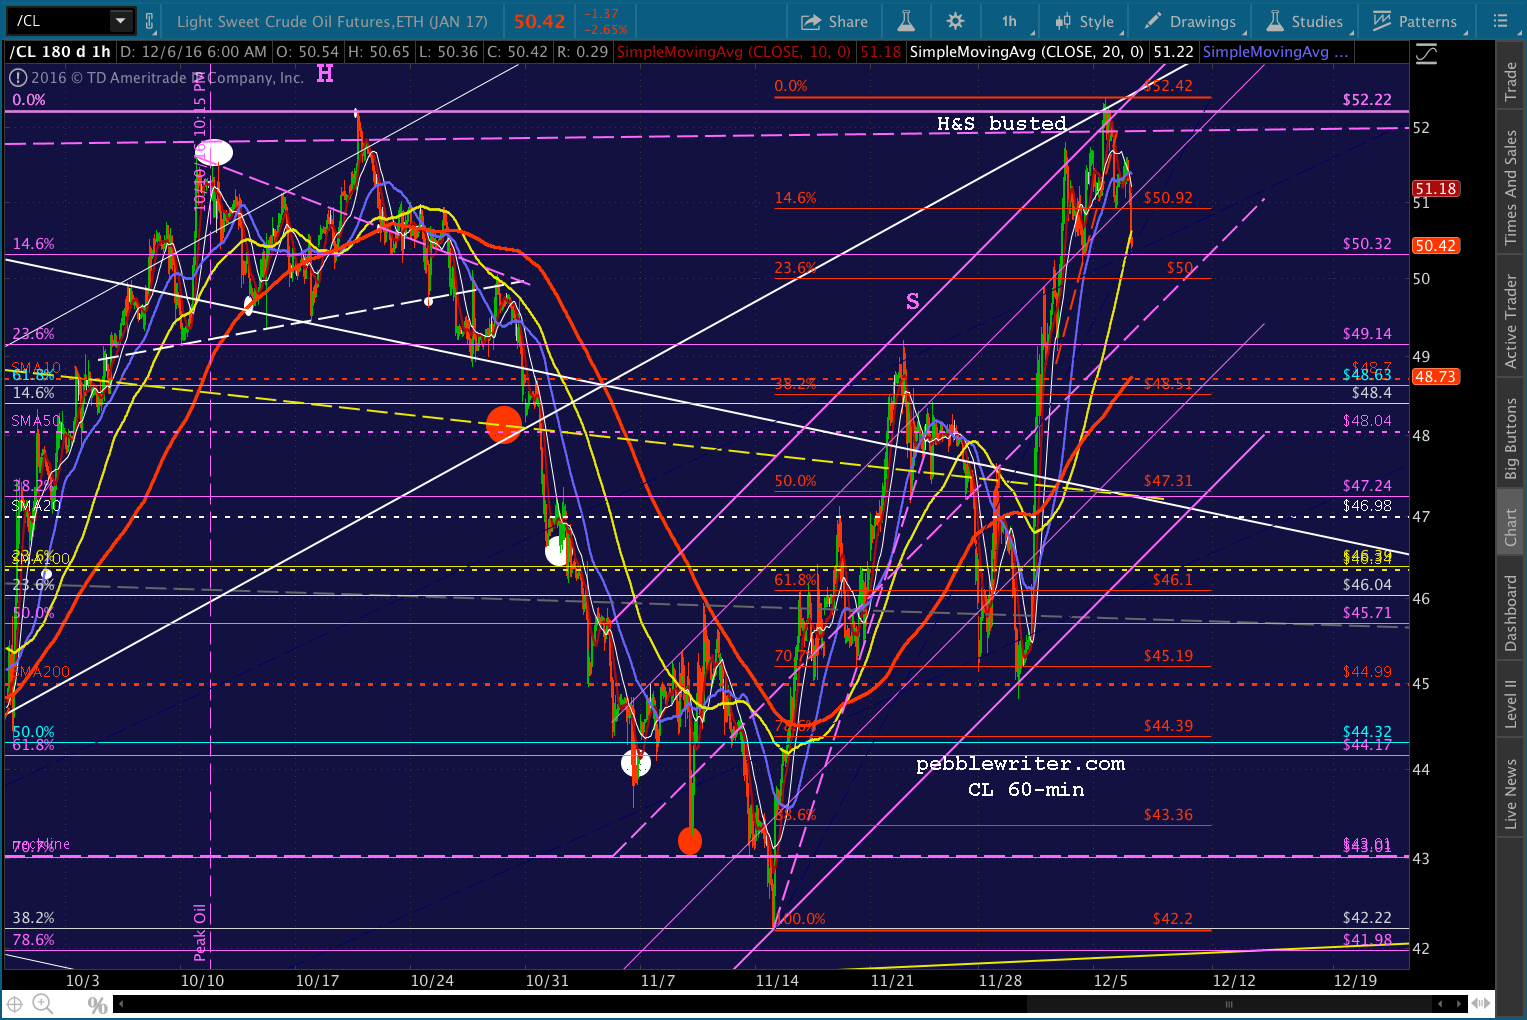
And, USDJPY has a decision to make — with the .618 just overhead and a tightly controlled rising channel just below.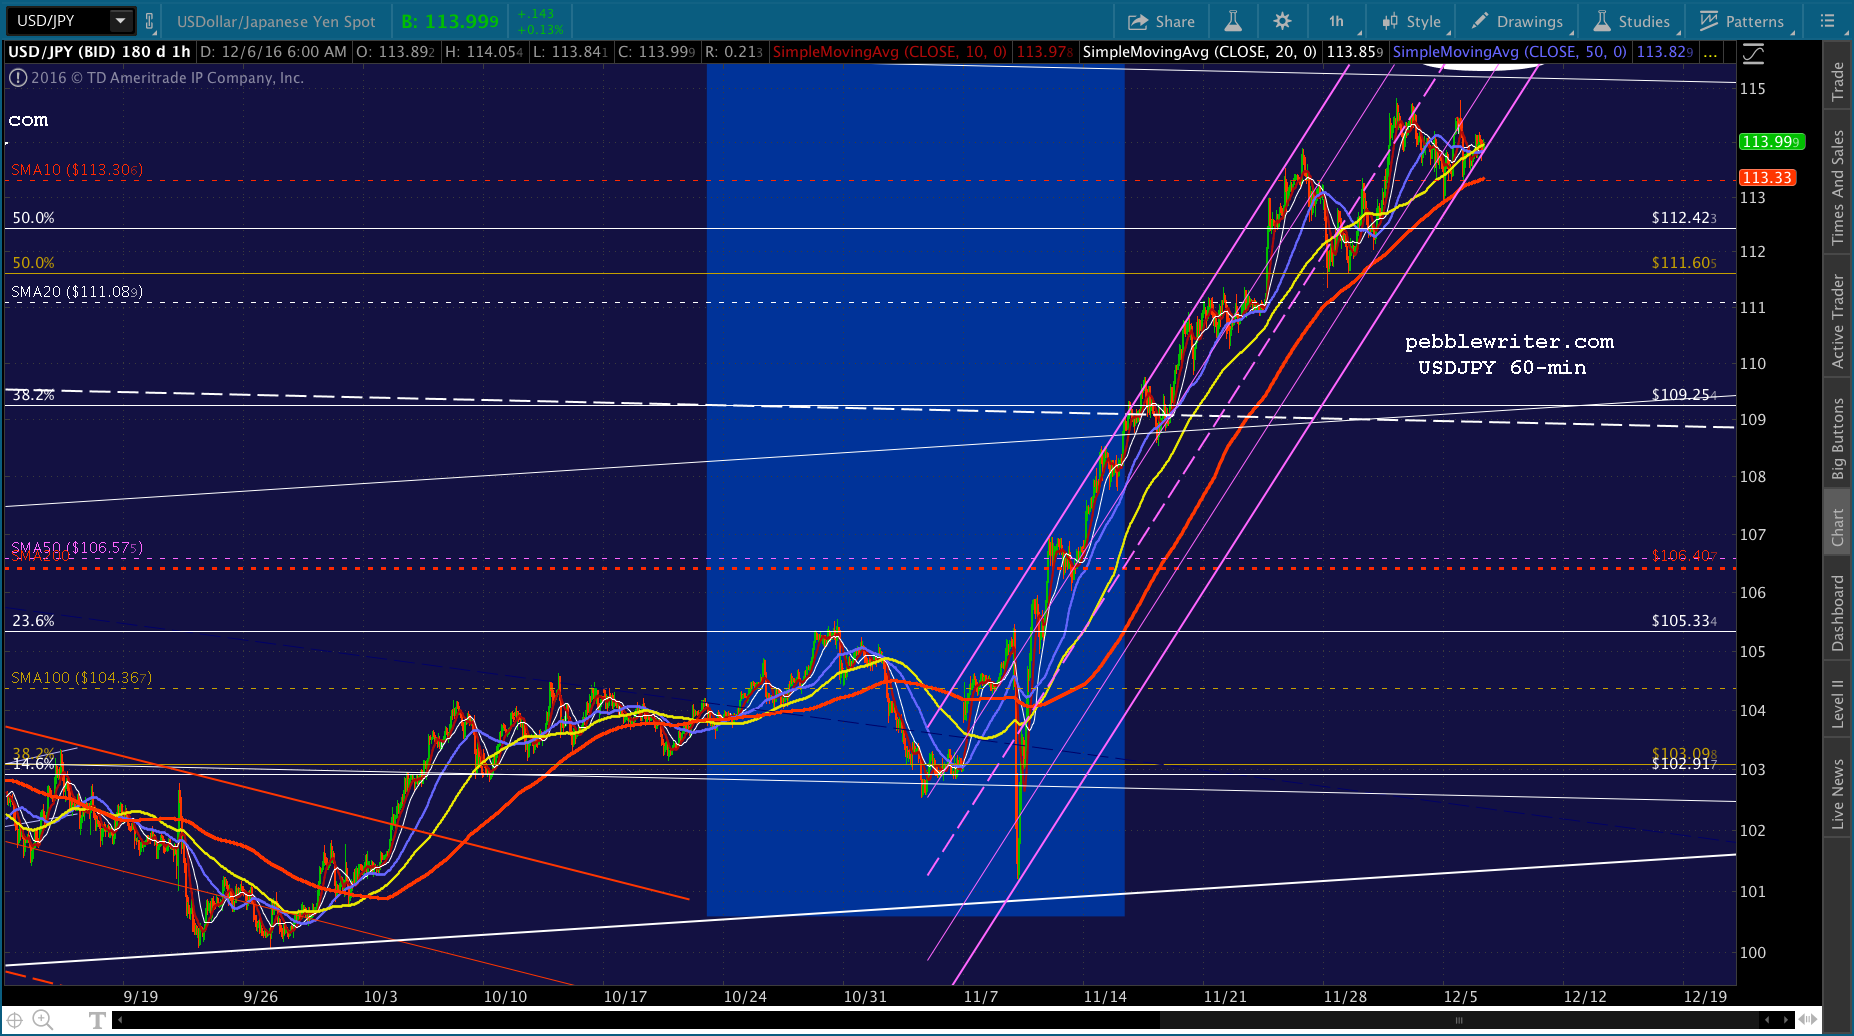
The dollar continues to sell off, perhaps spurred by the atrocious trade figures out this morning. Once again, we are reminded that there is no free lunch in trade.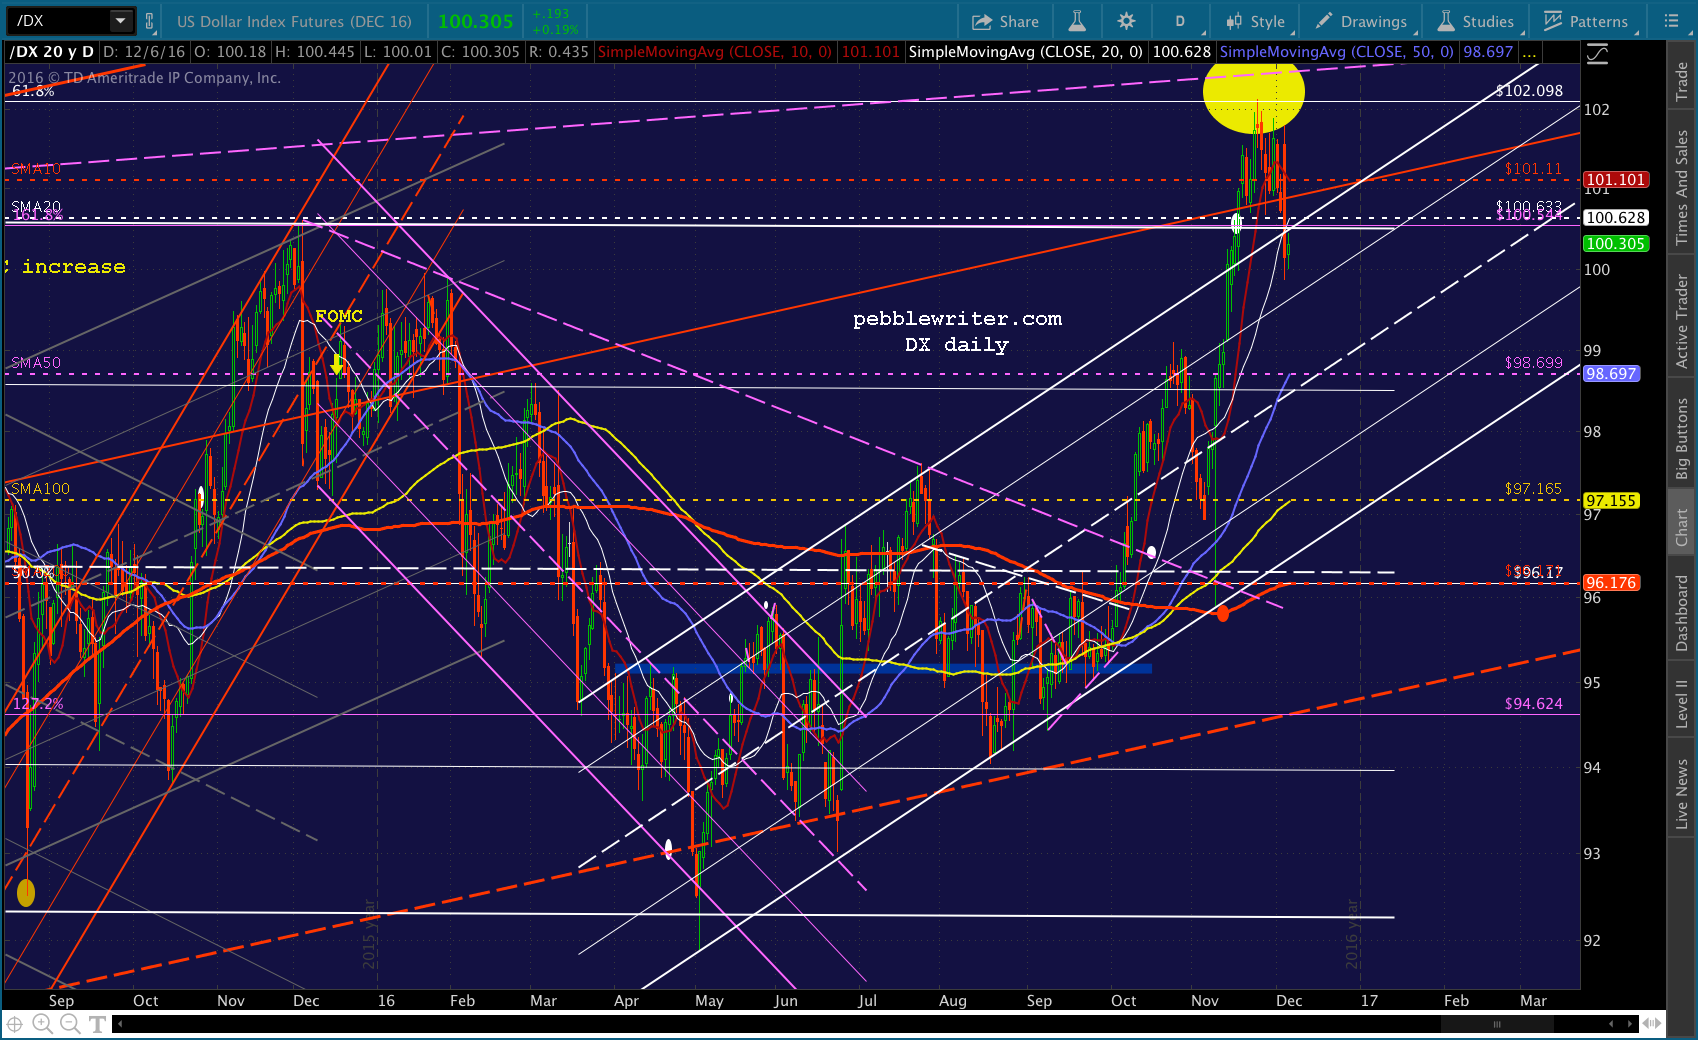
The EURUSD reached our red channel midline yesterday and is backing off — modestly, so far.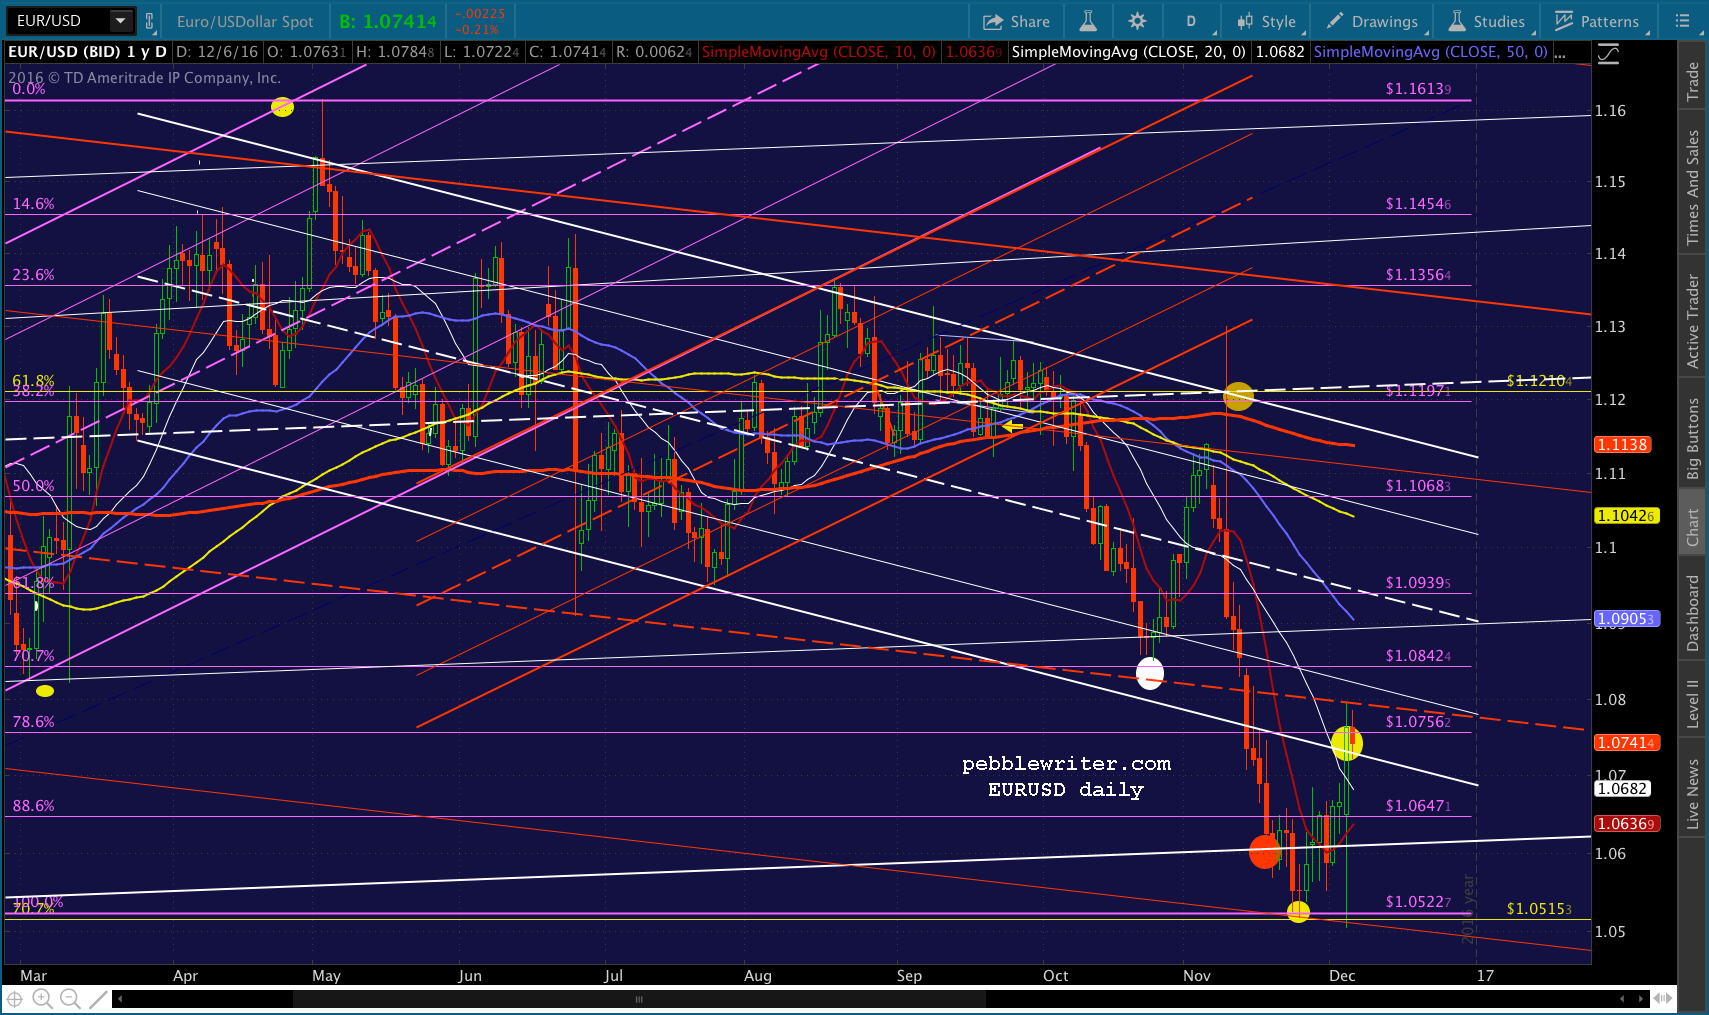
I’ll be posting the gold update within the hour.
UPDATE: 10:15 AM
ES has already tagged its SMA10, so is resisting dropping below it in order for SPX to do the same. 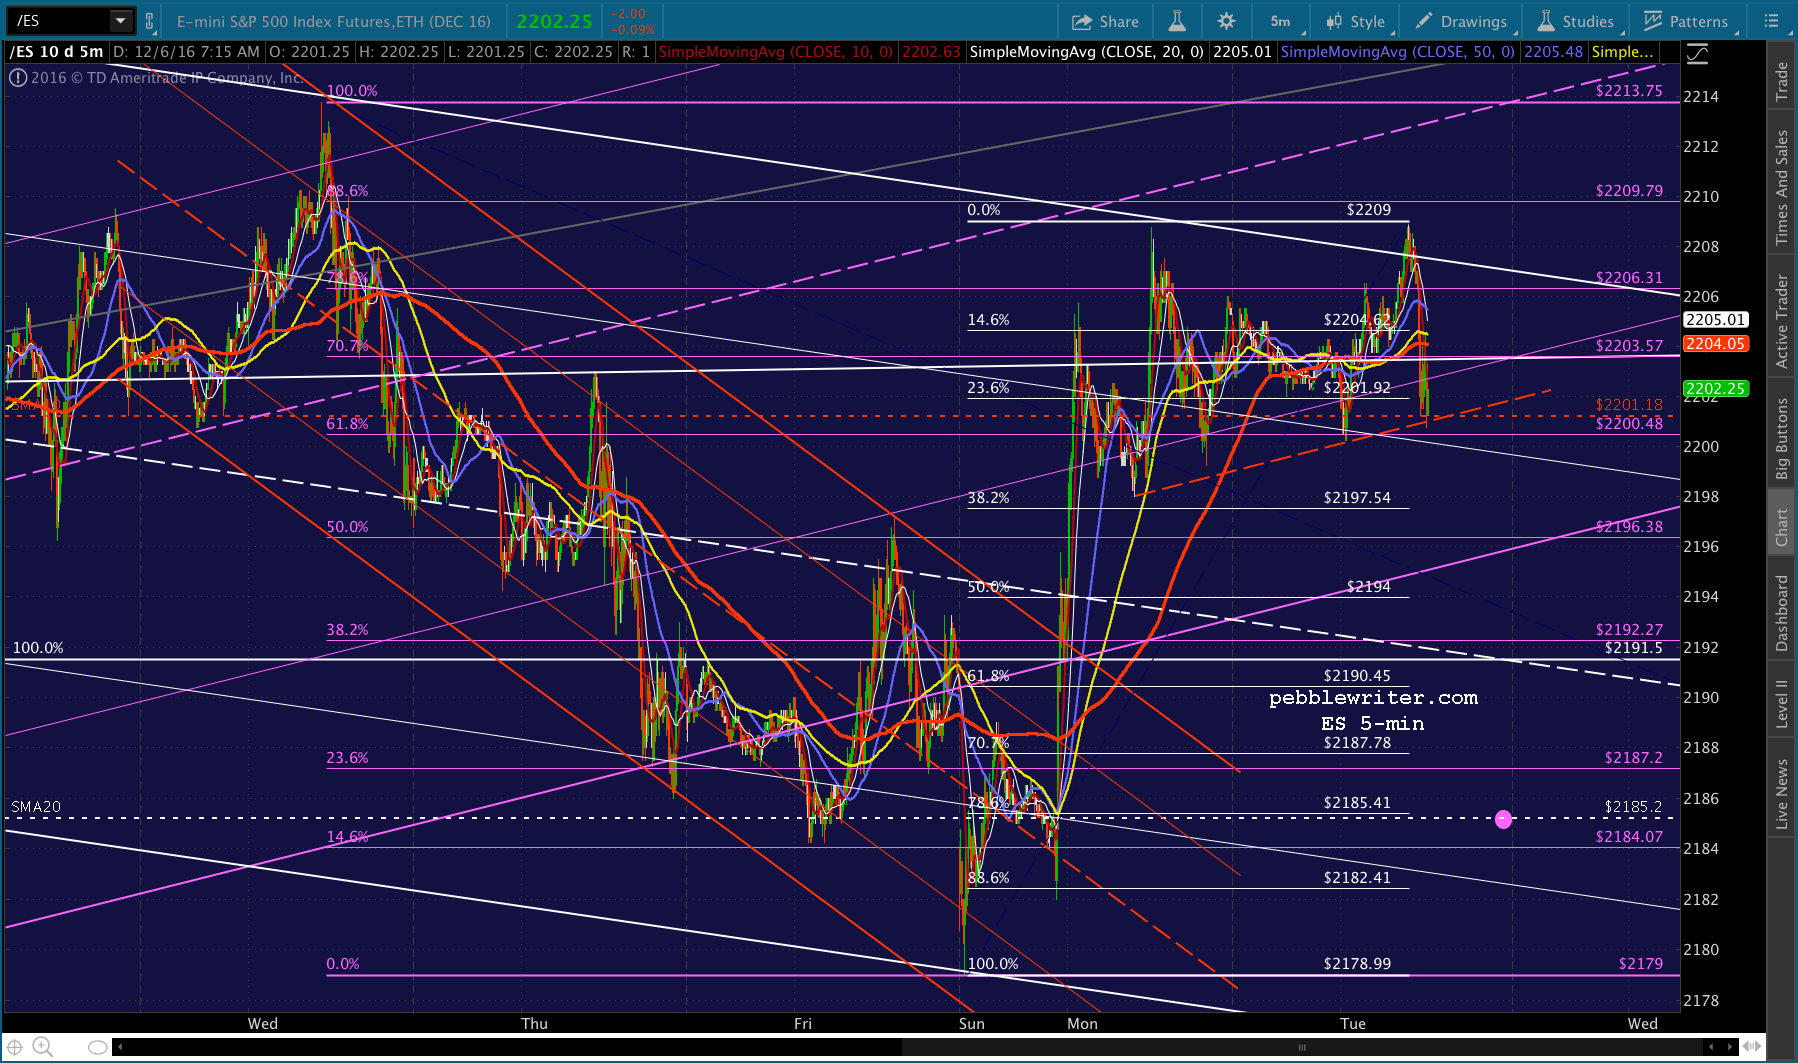 I expect that VIX will facilitate the tag by rising up to or above its SMA5 200.
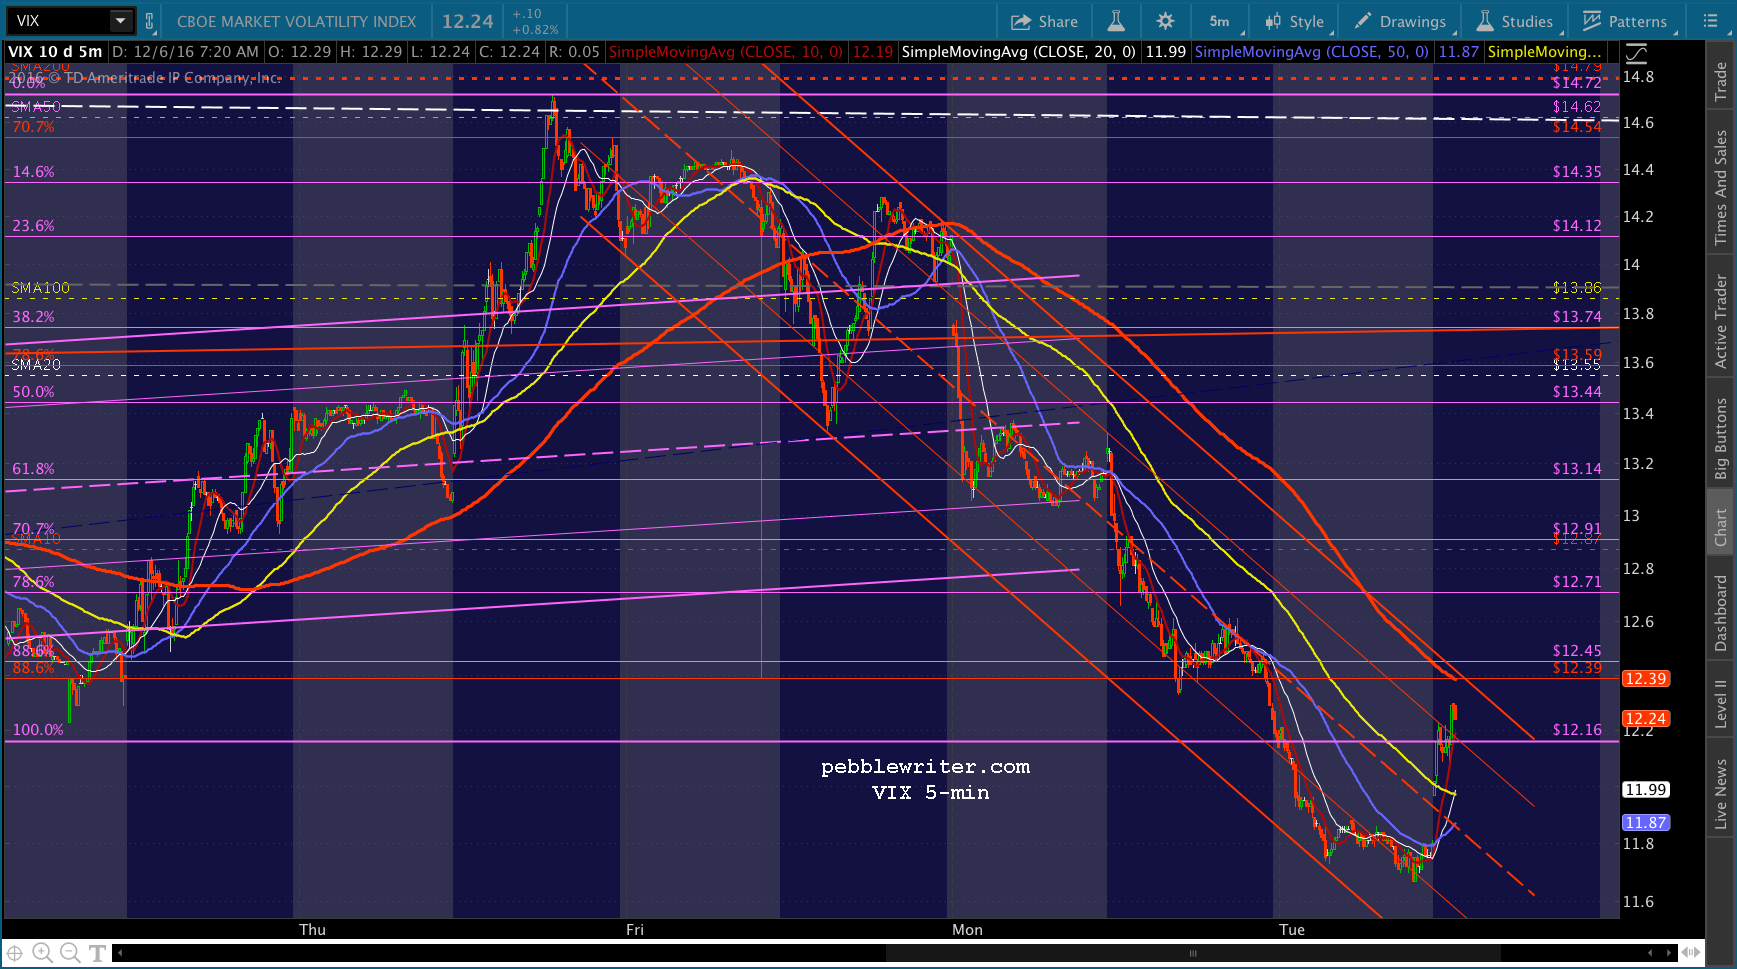
Note that SPX’s SMA5 200 is coming up on the gap close at 2197.95 — another reason for it to slice through the SMA10. I will readily admit that this is wishful thinking… There is an excellent chance that SPX will get a nice bounce at the SMA10 and that will be that.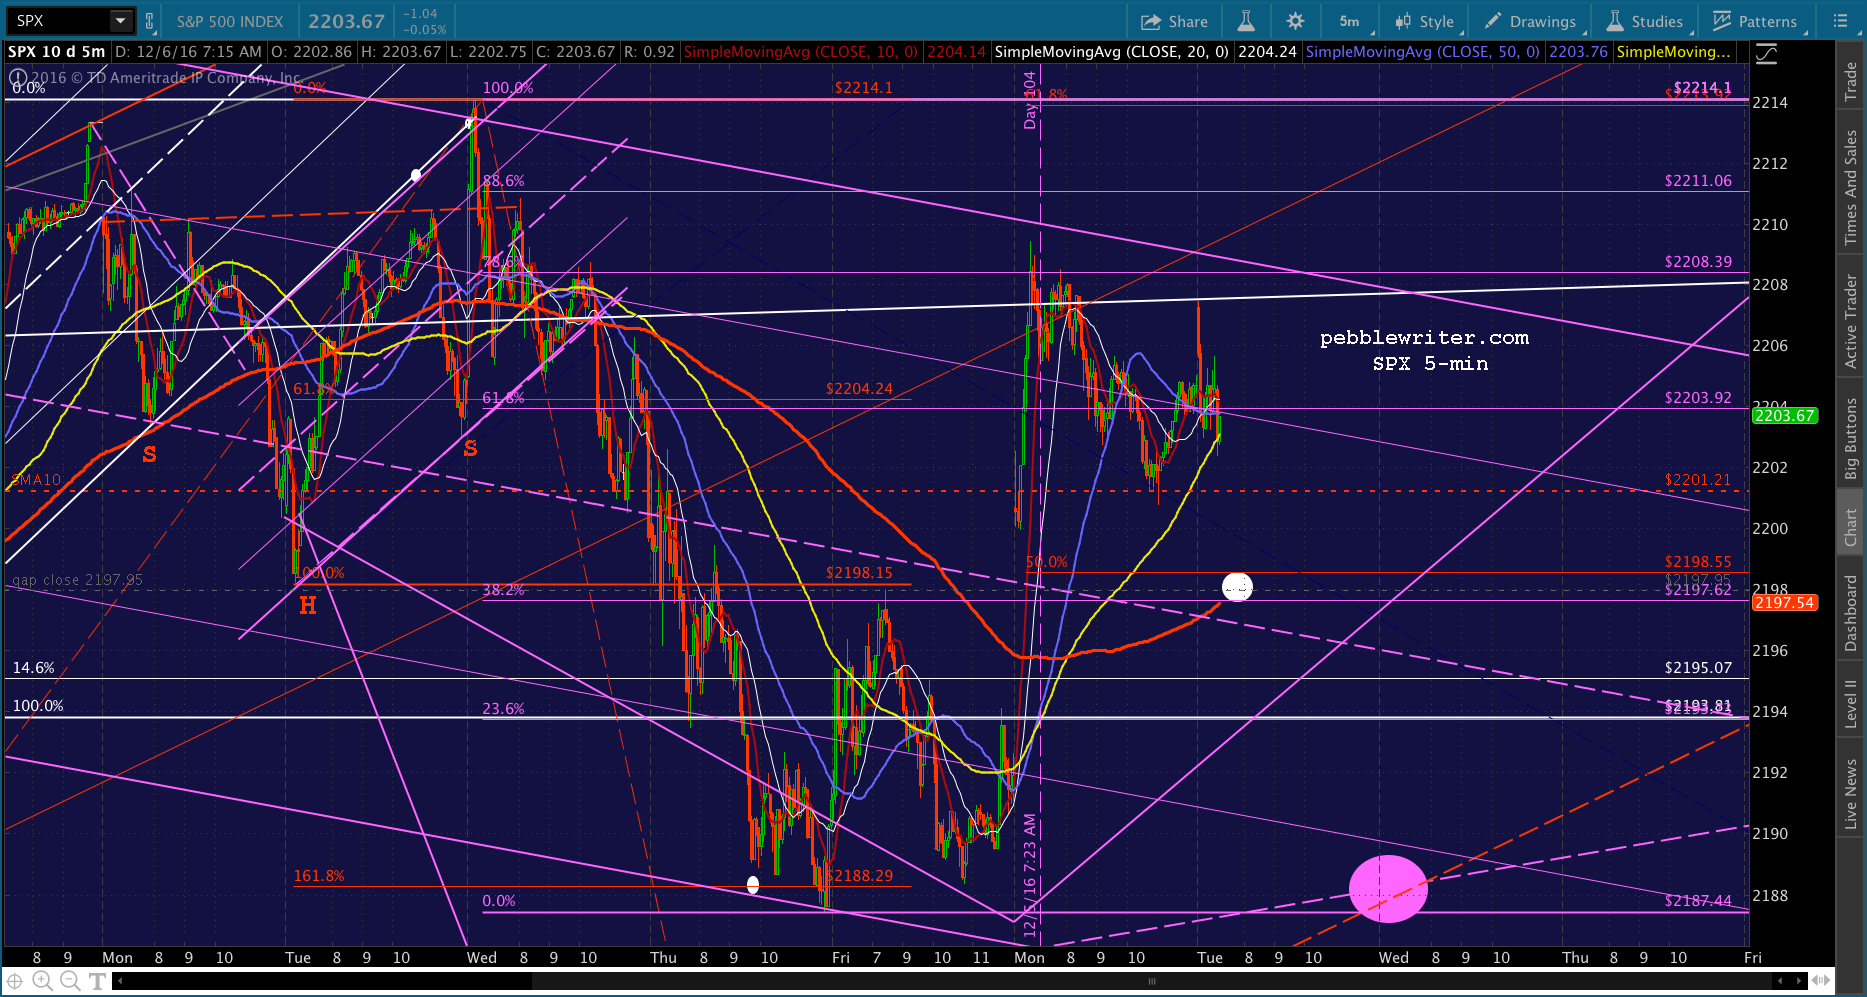
UPDATE: 11:25 AM
ES’ SMA10 has held so far, with a 4-pt bounce on VIX’s continuing smackdown. Watch your stops, particularly as SPX approaches 2208 where it could break out of the falling purple channel. I have a conference call coming up at 11:30, so will be out of pocket for 30 minutes or so.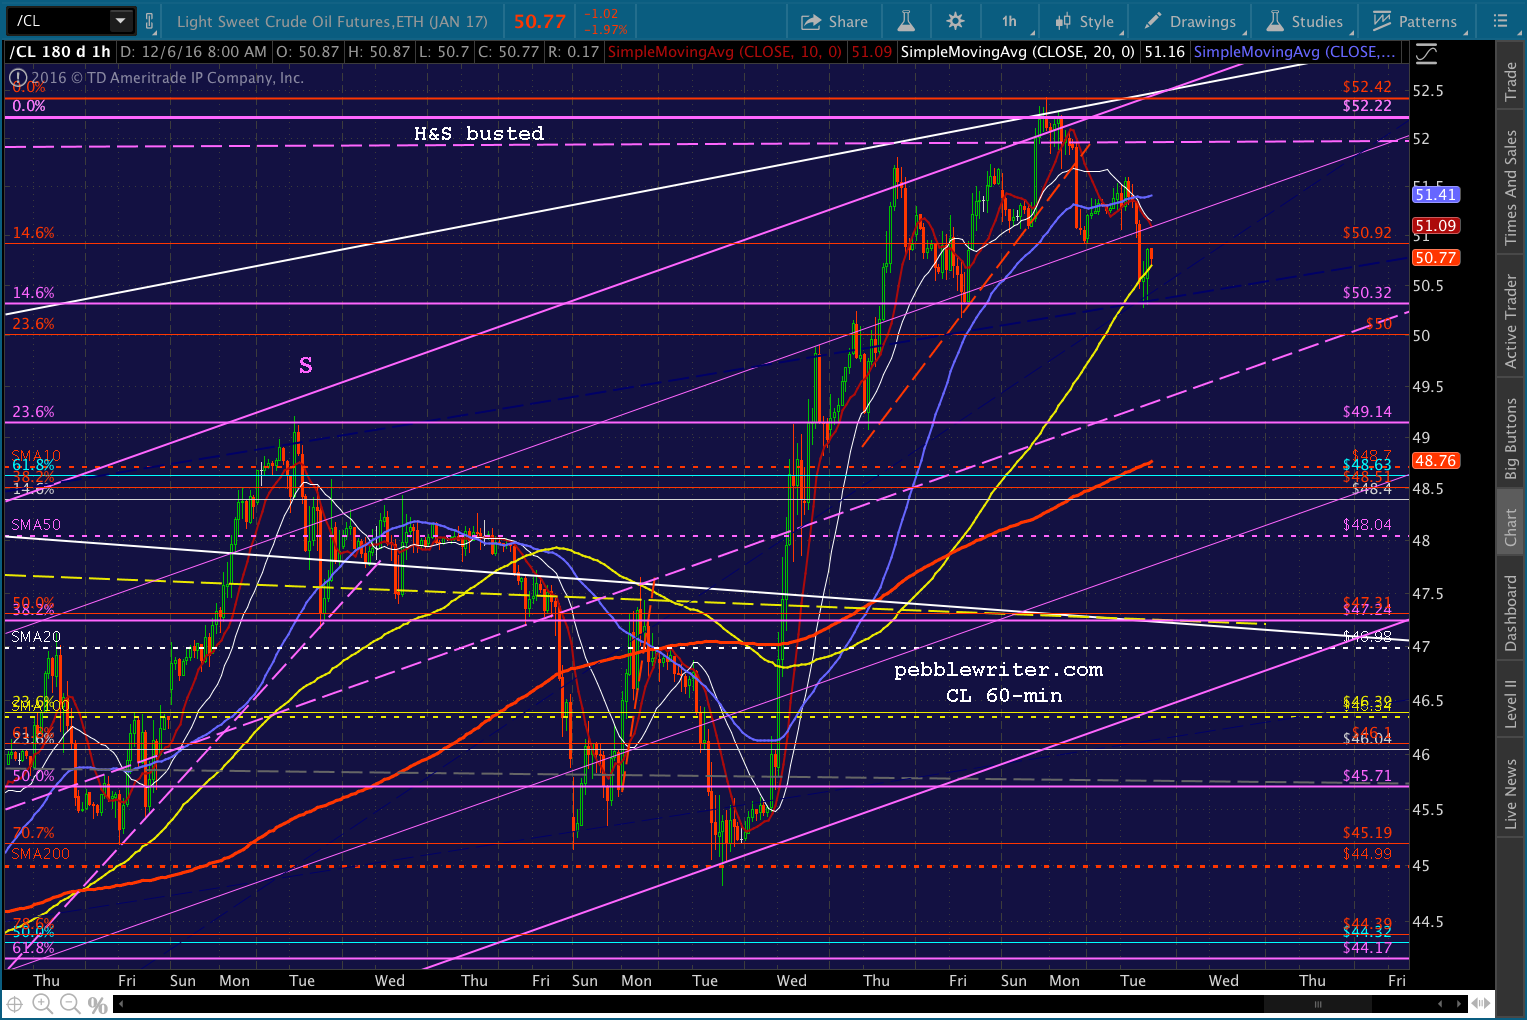
UPDATE: 2:25 PM
SPX has edged above the purple channel top and backtested it at the SMA5 20. It’s now only a couple of points from the .886 at 2211.06, a logical turning point but also a frequent target for pattern busters who quite obviously control VIX. Note that it wasn’t even allowed to tag the top of its falling red channel at the SMA5 200.
I’d go to cash here at 2209.26 and see what happens at 2211 — being ready, however, to reshort if SPX falls through current prices or jump on board should its momentum pick up.
UPDATE: 3:08 PM
SPX and ES both reached their .886s. VIX appears likely to run up and tag that SMA5 200 now, which might be enough to allow a small backtest of the broken purple channel as the SMA5 50 crosses at 2208.39 at the close.
Note that CL, even in the midst of a 2% down day, still managed to rally intraday in order to prevent a downturn in SPX. The charts suggest a short position here to take advantage of the .886 tag. But, I imagine it will be short and sweet and only worth a few points. The key is remaining above 2208.39.
If this decline should, miraculously, pick up steam into the close, note that the SMA5 200 has reached the SMA10, which under normal circumstances might act as a magnet to the downside. It’s not terribly likely, as it would be a bearish development to give up the broken purple channel and for VIX to break out of the falling red channel.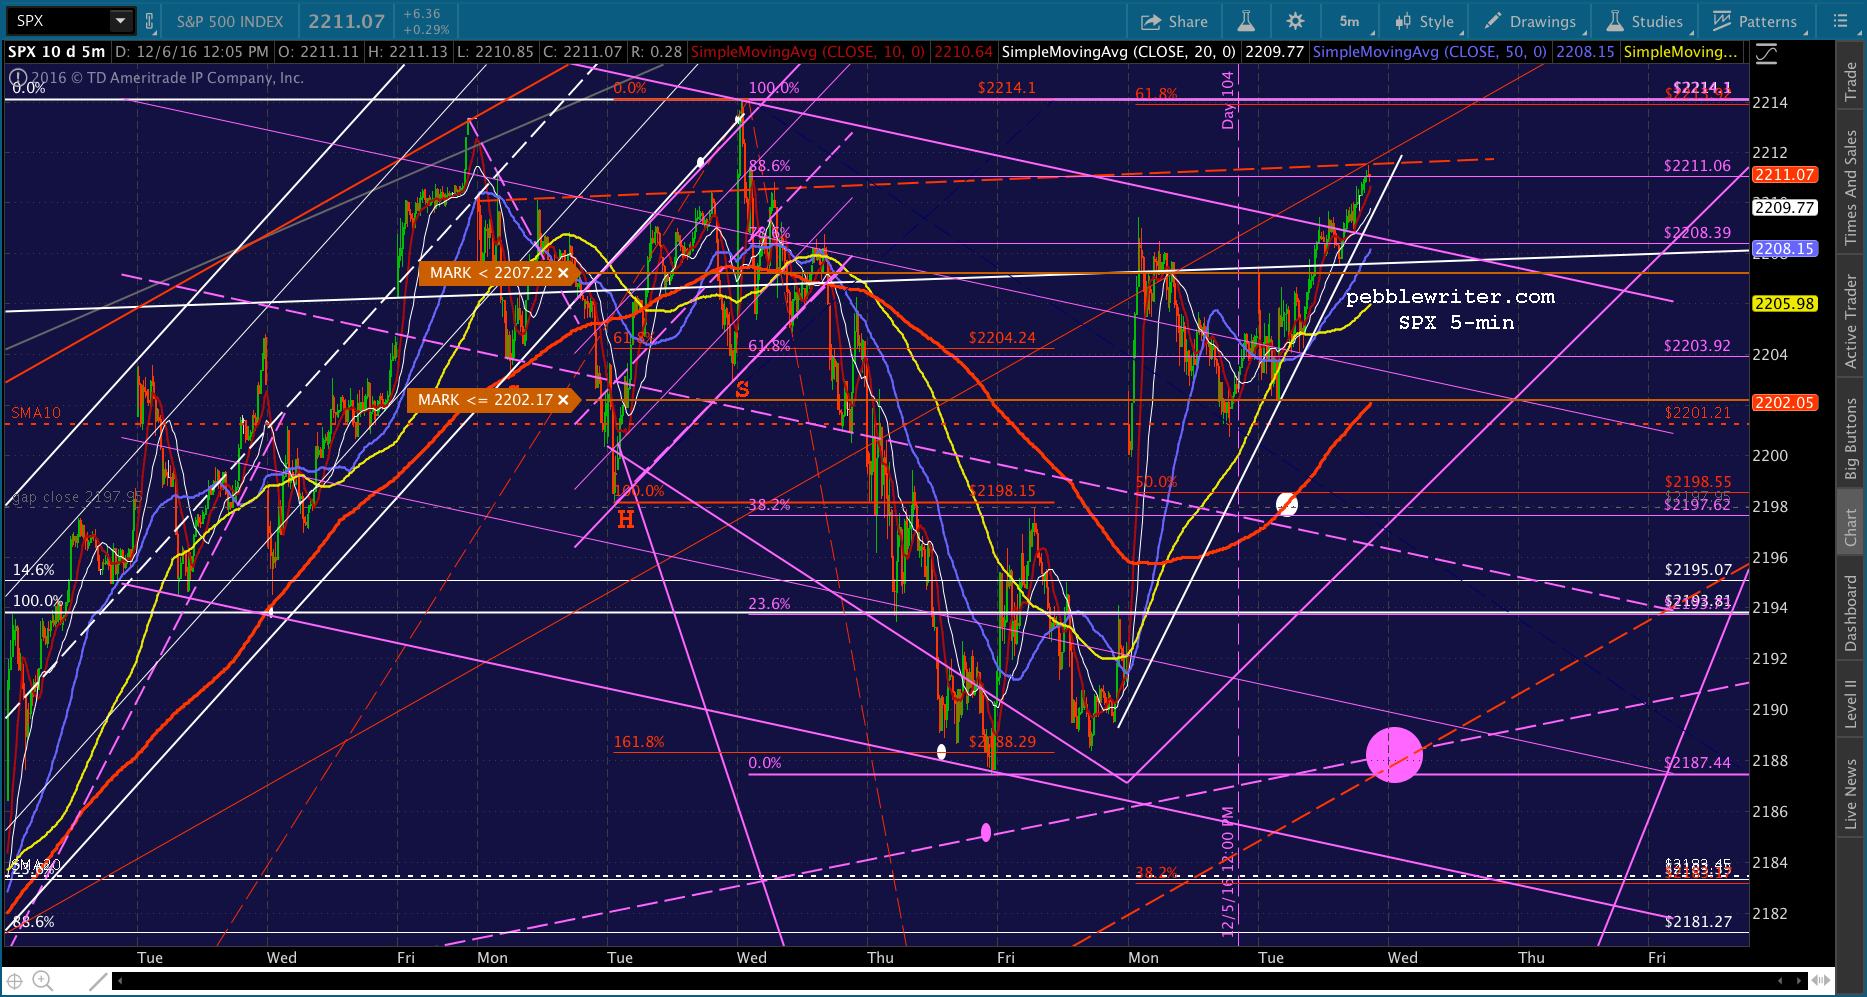
There was a little slight of hand involving SPX’s SMA10. Ordinarily, we look at the previous day’s close to establish the moving average for the current day. In this case, that was 2201.21. SPX only got down to 2202.21 before beginning its meltup.
But, on the daily chart, it will appear to have tagged the MA because where the index is now puts today’s SMA10 at 2202.39. It’s happened quite a few times over the past six months — especially when there’s a conflict between ES and SPX over where a backtest should be.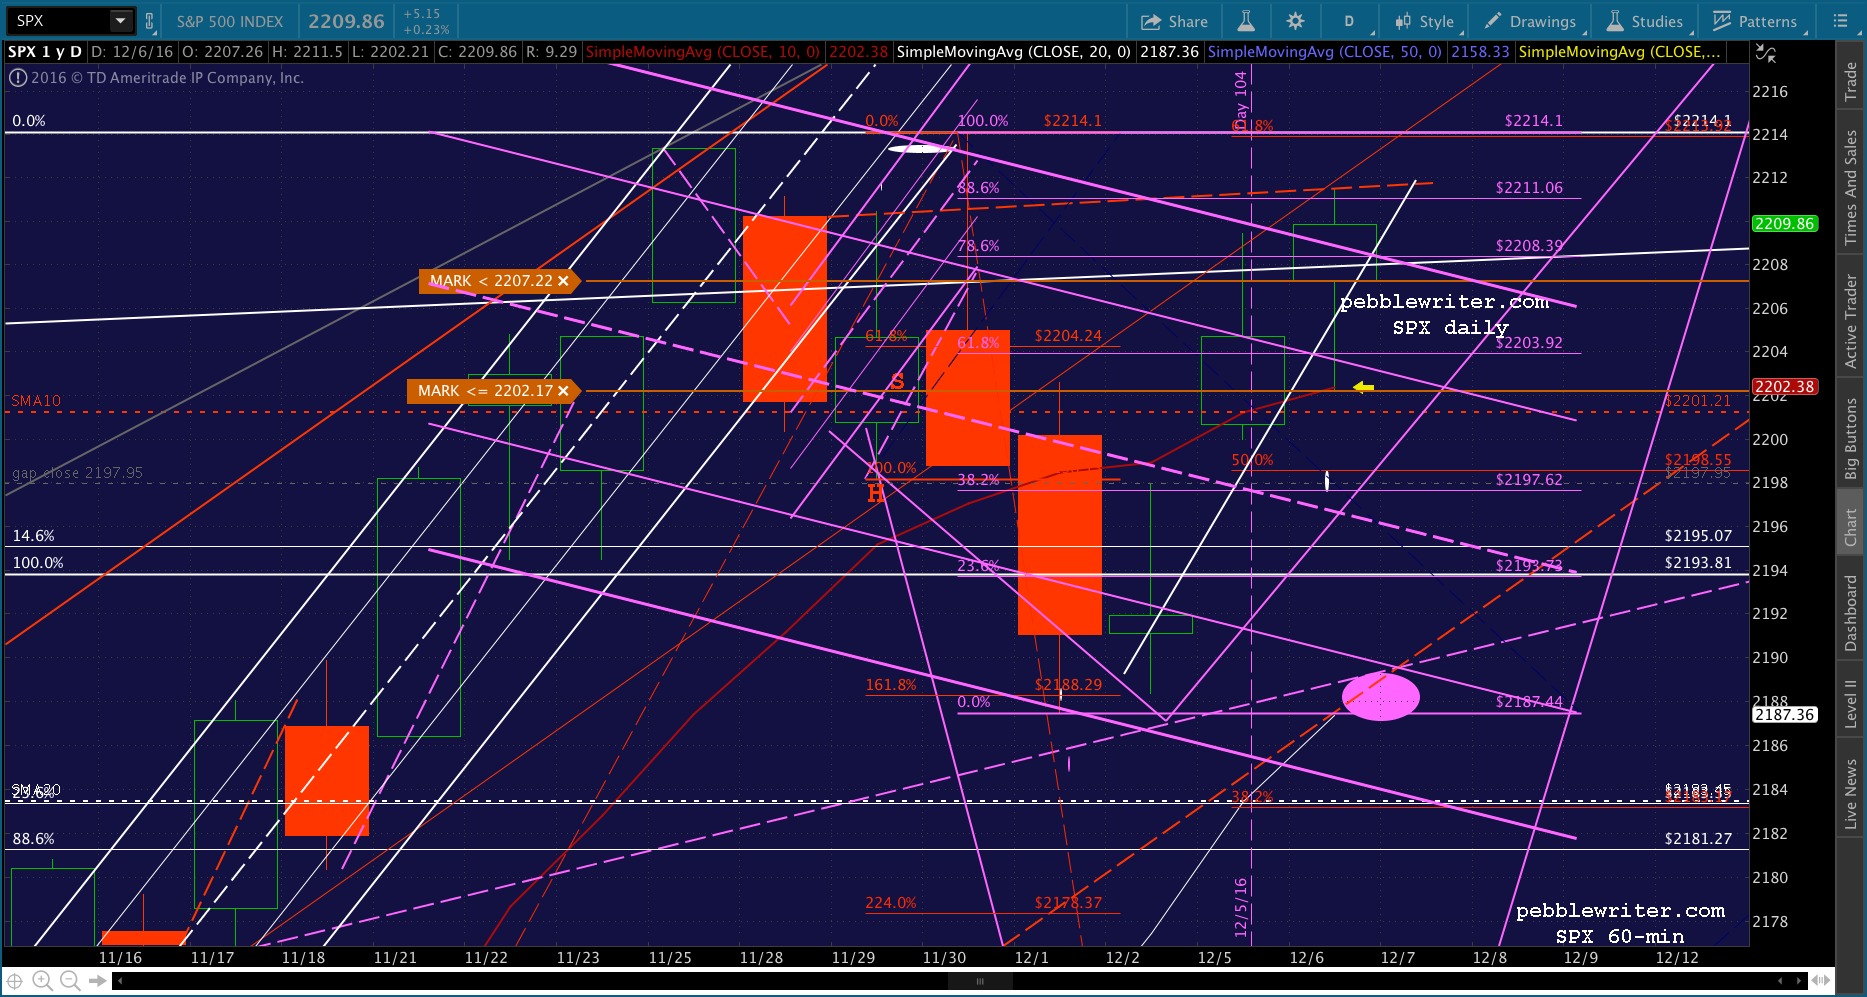
UPDATE: 3:30 PM
Barring any headfakes or that miraculous downturn discussed above, that’s probably all we’ll get to the downside. Next stop should be 2223 in about a week from tomorrow.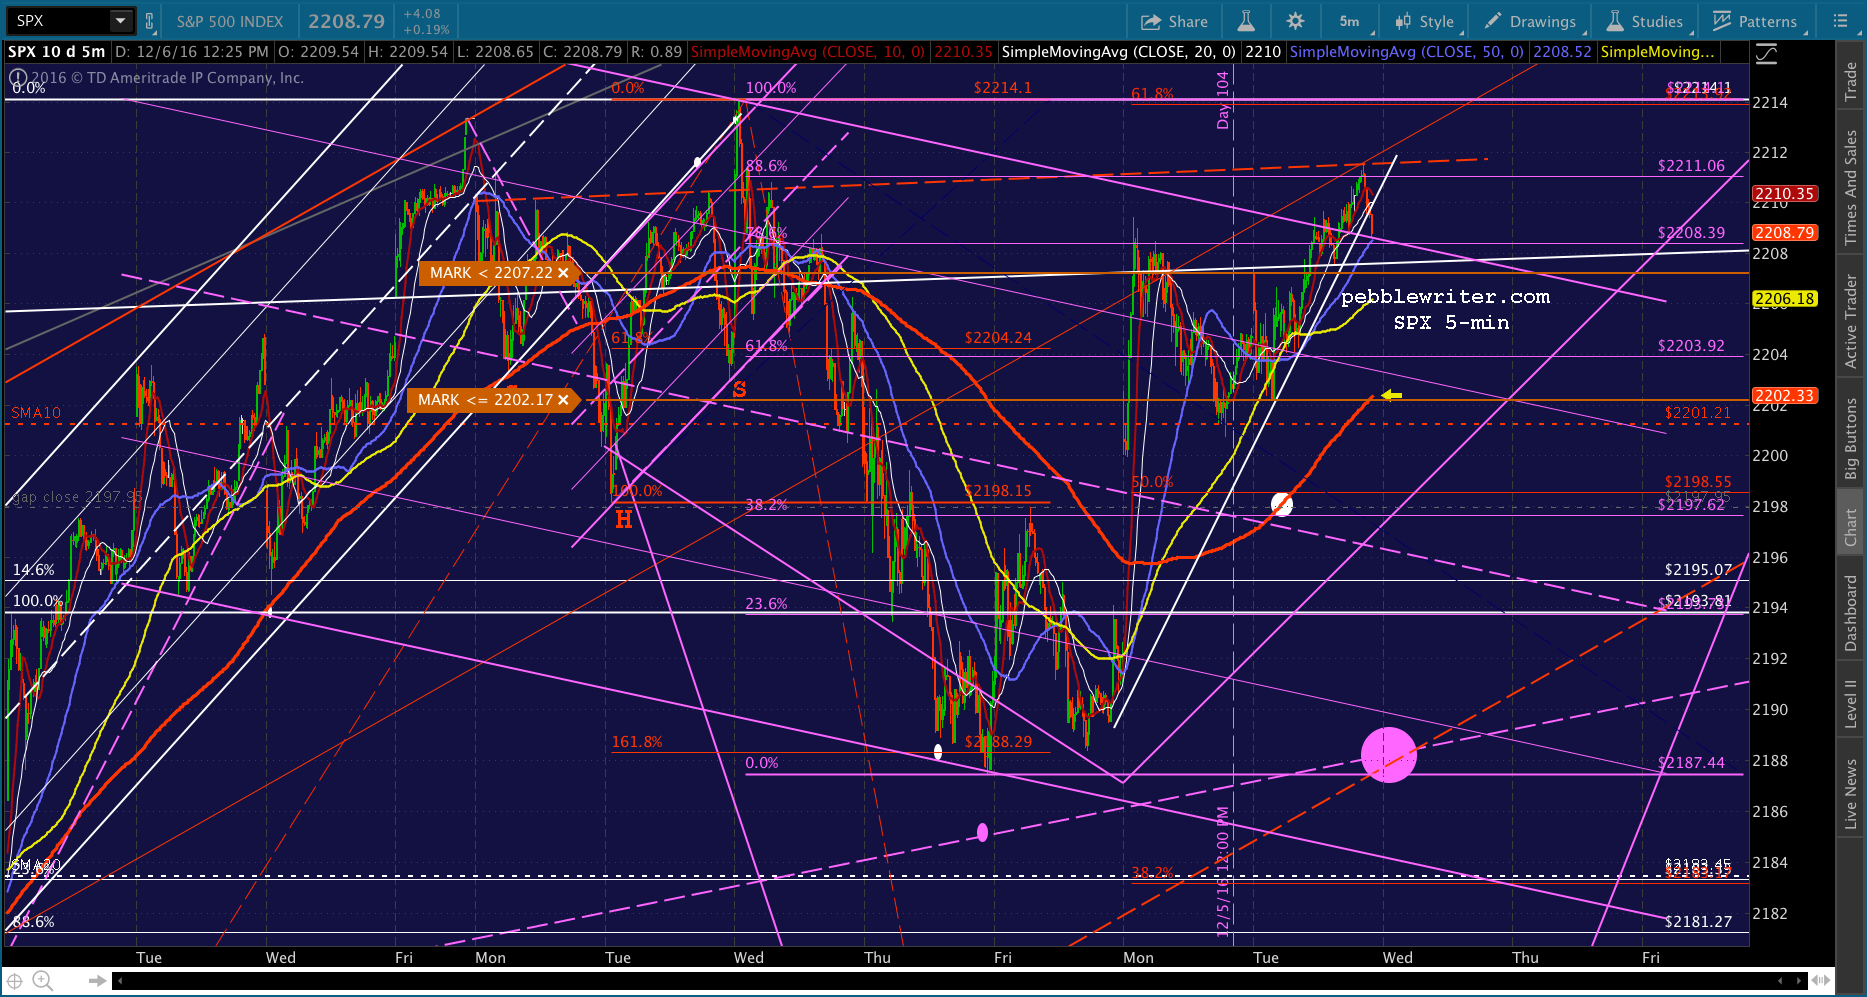
.
Comments
4 responses to “Charts I’m Watching: Dec 6, 2016”
At this point, with no volume, the machines are in control. New highs for the RUT and IWM. RUT is up 35+ points in less than 2 days on bad news. Pretty flagrant, in your face manipulation, but that is what we have.
Indeed.
PW, Fed rate hike decision is next week.
It is logical if there is “market uncertainty” for Fed to delay a rate hike.
However, with one week away, it would need a miracle to show there is “no inflation” and “market uncertainty”. (CL is still high and Dow index is sitting at all time high. And people pay attention to Dow)
Is TPTB capable for such a miracle? We will find out in one week.
I see two potential arguments for postponing a hike: (1) interest rates have already self-adjusted; and, (2) the bond market is in disarray. It would certainly strengthen the case for a postponement if SPX sold off down to 2138 on some kind of negative news related to interest rates or currencies…maybe the dollar crashing from here? I think it’s a possibility (though not a probability) so I’ll remain open to it as long as SPX doesn’t break out today. Obviously, it’s threatening to do just that.