UPDATE: 4:20 PM
Today’s action fulfilled the small Butterfly pattern’s target, reaching 1266.98 versus our target of 1267.38. This was also the .786 from the recent 1277 high, so we are probably safe in calling this latest move complete.
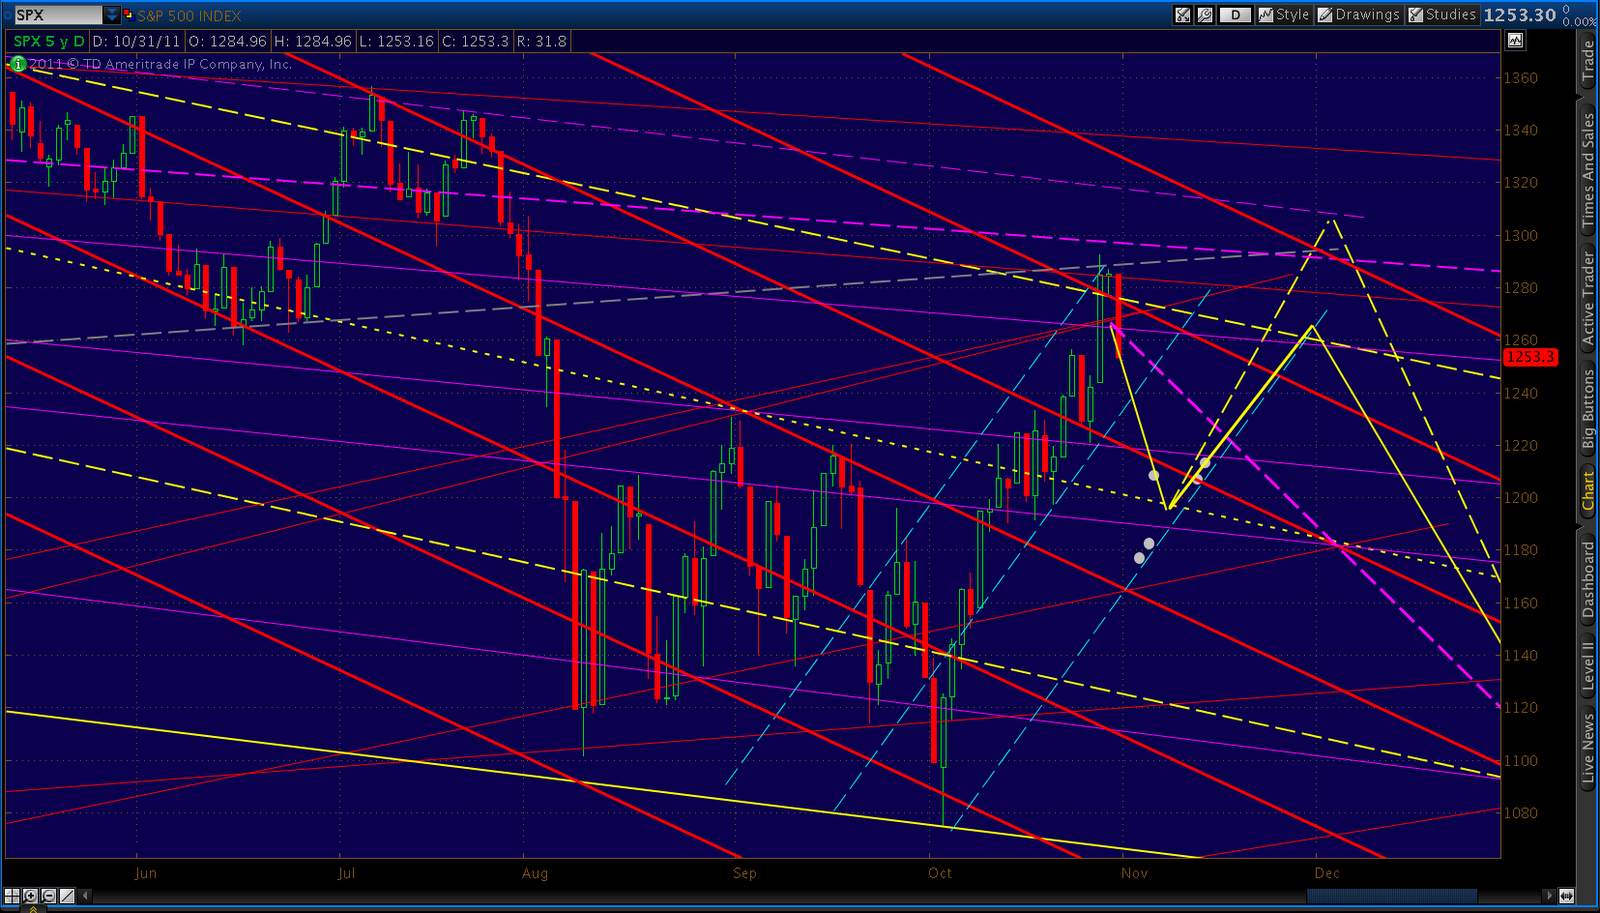
Still, there is at least a 50/50 shot at a higher high over the next two weeks. It would most likely come around the 1307-1313 level as a result of one of this jumble of harmonics patterns playing out.
 |
|
| Harmonics with Upside |
 |
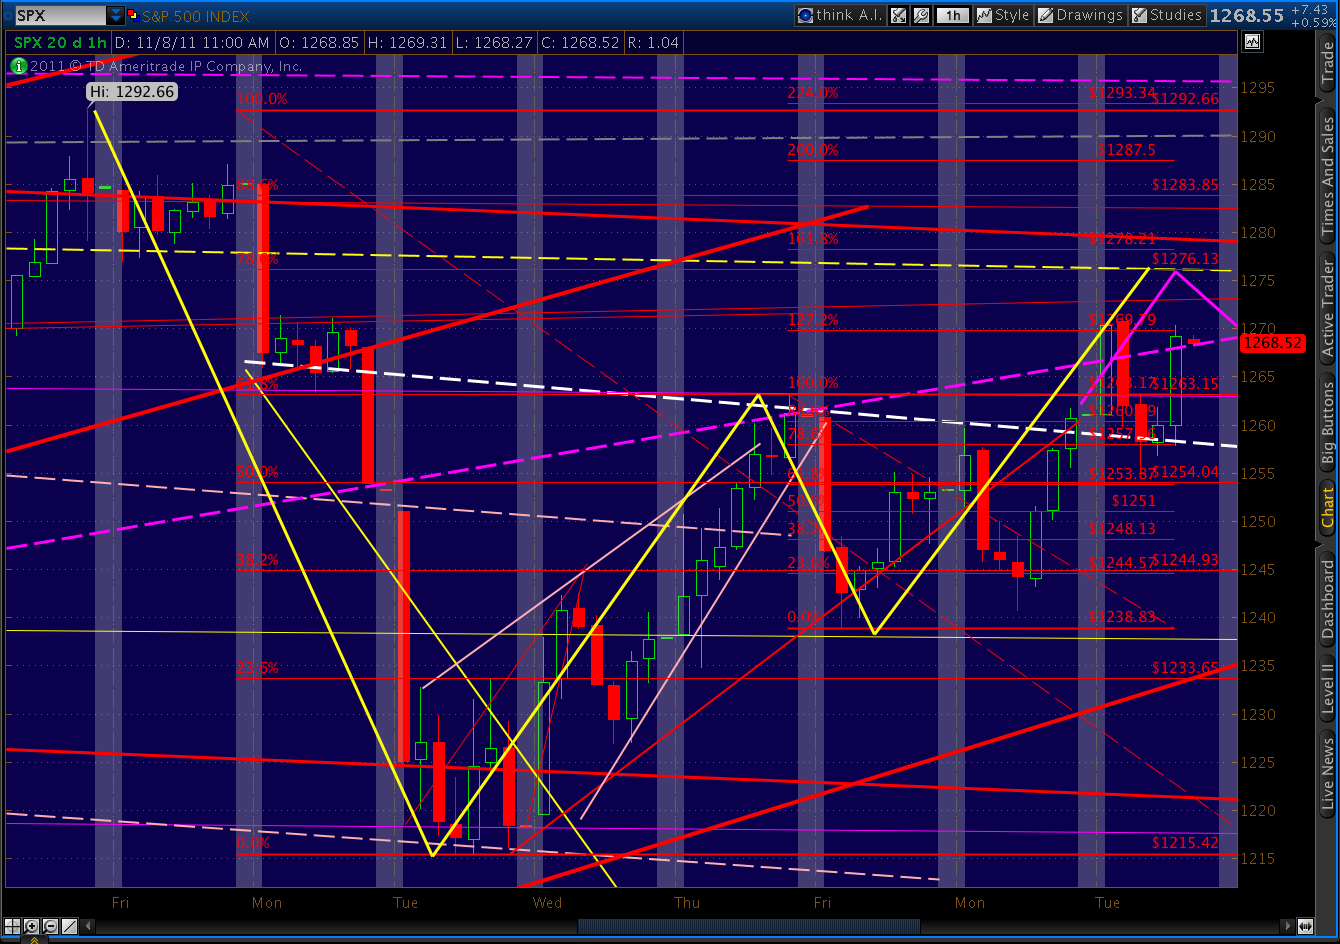
|
| Close-up of Patterns Above |
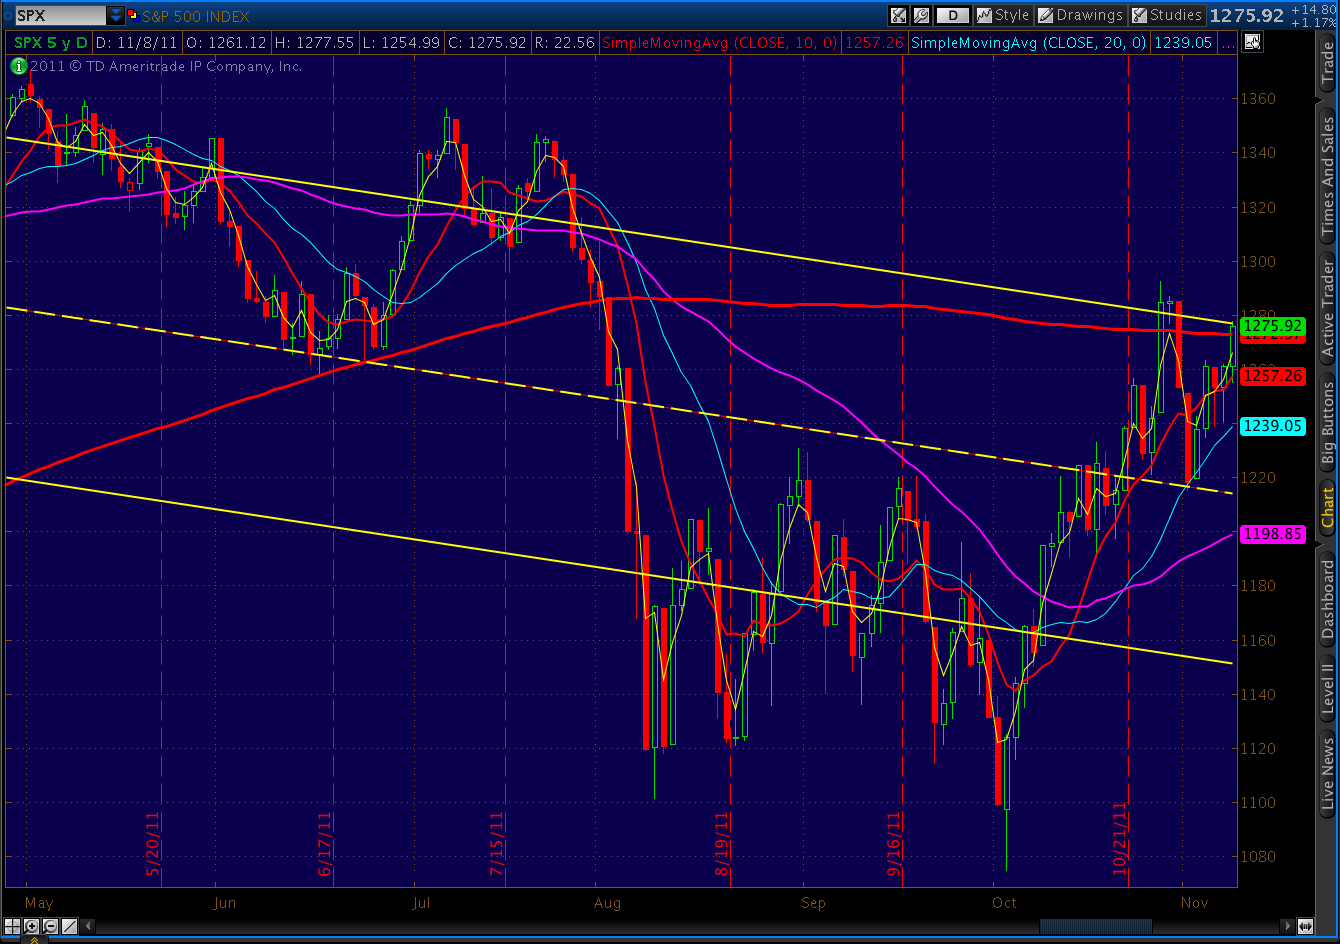
The downside case is a little less complicated. First, the big picture:

More in a few minutes…
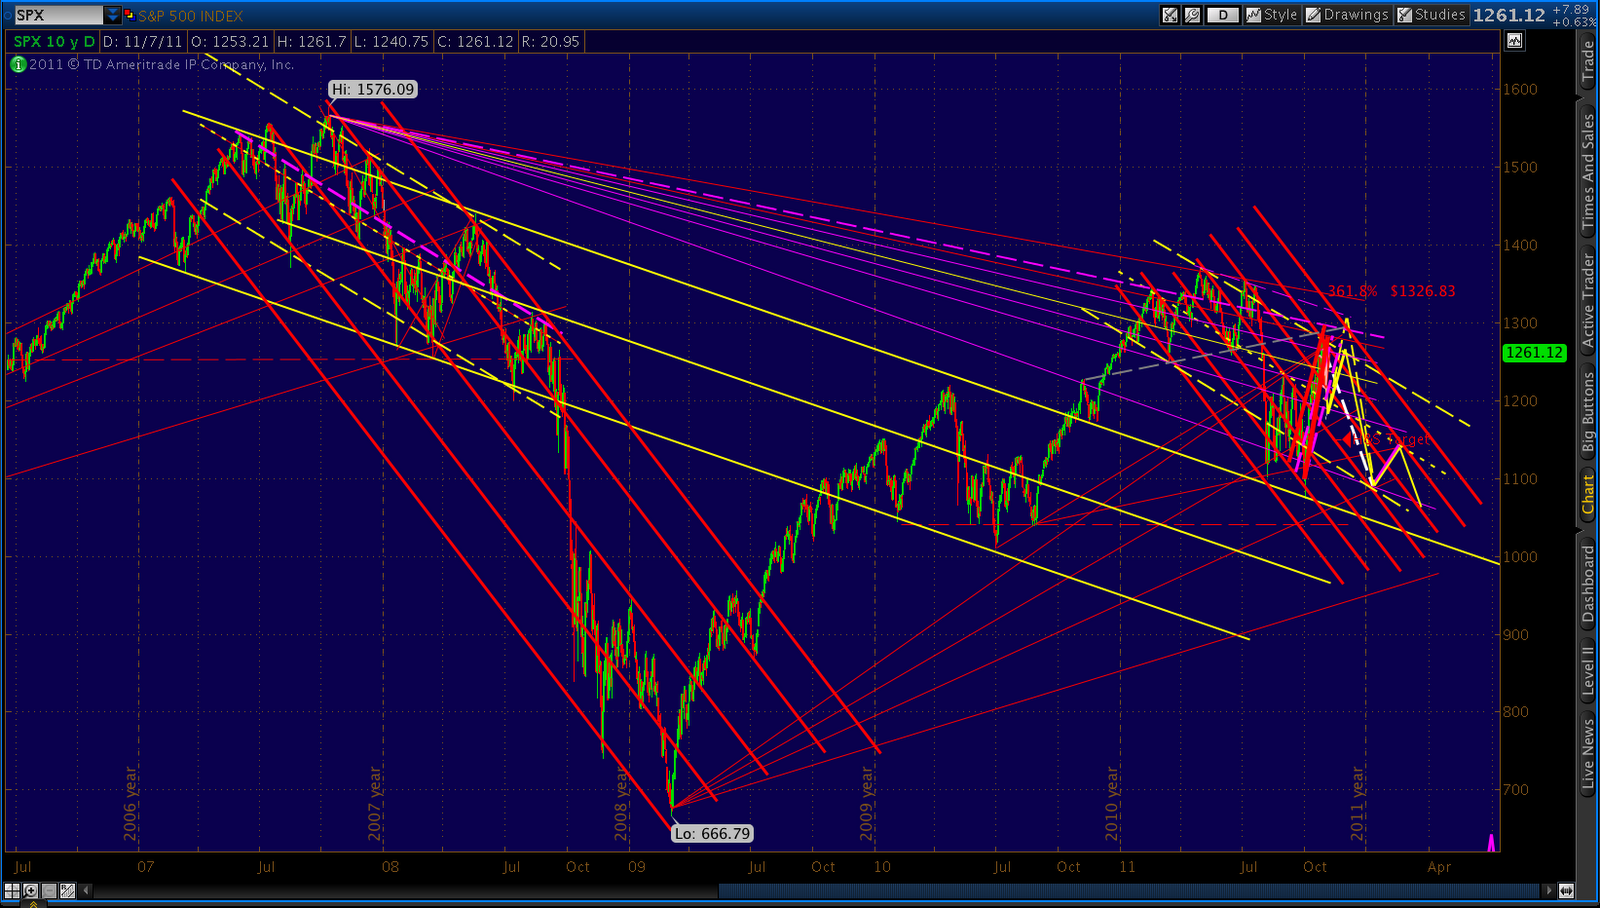
And, in the interest of staying humble…
Here’s my forecast (the purple line) from early July, complete with my view of the proper channel lines (thin red lines) way back then. I’ve taken the liberty of adding another channel line to connect the July highs with the recent peaks that I originally thought would maybe reach 1258 in September — going on to reach 1040 by November. Oh, well. Guess it could still happen…

Note the 87-day cycle lines. These date back to May, when I first noticed a weird regularity to the market’s plunges [see: Sure It Works in Practice]. I’ve since refined the cycle, which in 2011 got stretched and compressed just as it did in 2007/8. Since one of these original dates just occurred, it’s probably time to revisit the pattern. I’ll try to post more over the weekend.
ORIGINAL POST:
The Butterfly we discussed yesterday has played out perfectly at the 1.272 at 1258…so far. We also discussed it going on to fulfill the 1.618 at 1268 which, after the Michigan sentiment numbers, looks like a distinct possibility. Also, 1271 marks the .886 retrace of the recent drop from 1277.55. It could work as a Bat pattern Point D.

Personally, I’m starting to lighten up on longs and raising cash a bit more than normal (usually, if I have lunch money, I’m under-invested.) I’ll probably add to existing longer-term shorts around 1268, depending on which way the wind’s blowing. Though I’m convinced the market will be much, much lower in the next 30 days, I’m not yet convinced that we won’t see one last run at 1307-1313 before turning back down. Hence the somewhat straddled position, with longer-term shorts and near-term longs on which I’m lightening up.
But, remember, I’m almost always early. So, this course no doubt will leave some upside profits on the table and get me into shorts at too high a price. I can live with that. And, in this market, I’d much rather be early than late. Everyone has to trade at their own comfort level. Not everyone is going to be comfortable buying puts on a day when SPX is up 26.
Here’s the chart I put up yesterday, showing the competing harmonic patterns:

The larger (dashed, yellow) Butterfly could go on to tag 1313. Or, we could turn down immediately after completing the small Butterfly (solid yellow, on right) at 1268, and head down to 1199-1215 which, readers will recall, is our line in the sand — regardless of whether we head higher in the interim.