

A substantial correction seemed a little farfetched two weeks ago.
 Now, not so much…
 continued for members… (more…)
A substantial correction seemed a little farfetched two weeks ago.
Now, not so much…
continued for members… (more…)
In our last update on NKD [see: Nov 30 Update], I somewhat snarkily disparaged the index’s legitimacy.
The Nikkei 225 is less a securities index than it is a measure of how much intervention the Bank of Japan feels like throwing its way. It’s what the Dow aspires to be when it grows up.
At the time, NKD was approaching a trend line connecting five recent lows, none of which had quite backtested the obvious Fibonacci support at 26,463. It was also backtesting a TL connecting recent highs.
As the chart above shows, NKD is backtesting a TL off the Feb 16, 2021 highs. This could be all we get, as the BoJ dislikes anything smelling like a correction.
As it turned out, the low that day was all we got. NKD rallied into year end, putting in a respectable +5.1% return for 2021 versus the 1.2% losses which would otherwise have occurred. Japanese “investment” managers no doubt cheered the rally, just in time for bonus calculations.
The rally left a bad taste, though, and I left the 27,156 target where it was – partly for spite and partly because the BoJ’s pathetic manipulation has become laughably predictable. Guess where NKD just tagged?

continued for members… (more…)
Another overnight bounce, another head fake…
 continued for members… (more…)
In our last update on BTC [see: Dec 5 Update] we noted that BTC had briefly dipped below our 46,000 target and was due for a backtest.
I would expect a bounce up to backtest at least the black dashed line (51,766ish) or even the cloud bottom (54,850.) If those (now) resistance levels hold, then the next targets remain to the downside…
As it turned out, BTC’s bounce took it to 51,991, whereupon it obliged us with a backtest of the black line and began sliding to new lows. It is now off over 40% since our short call on Nov 8 [see: Out of Sync.]
While bitcoin bulls are as buoyant as ever, our charts now suggest even more downside than before.
 continued for members… (more…)
A little over a week ago, COMP made a hard bounce off its 200-DMA, gapping much higher the following day. Yesterday, it plunged below its 200-DMA and closed there – not a good sign for the bulls.
 continued for members… (more…)
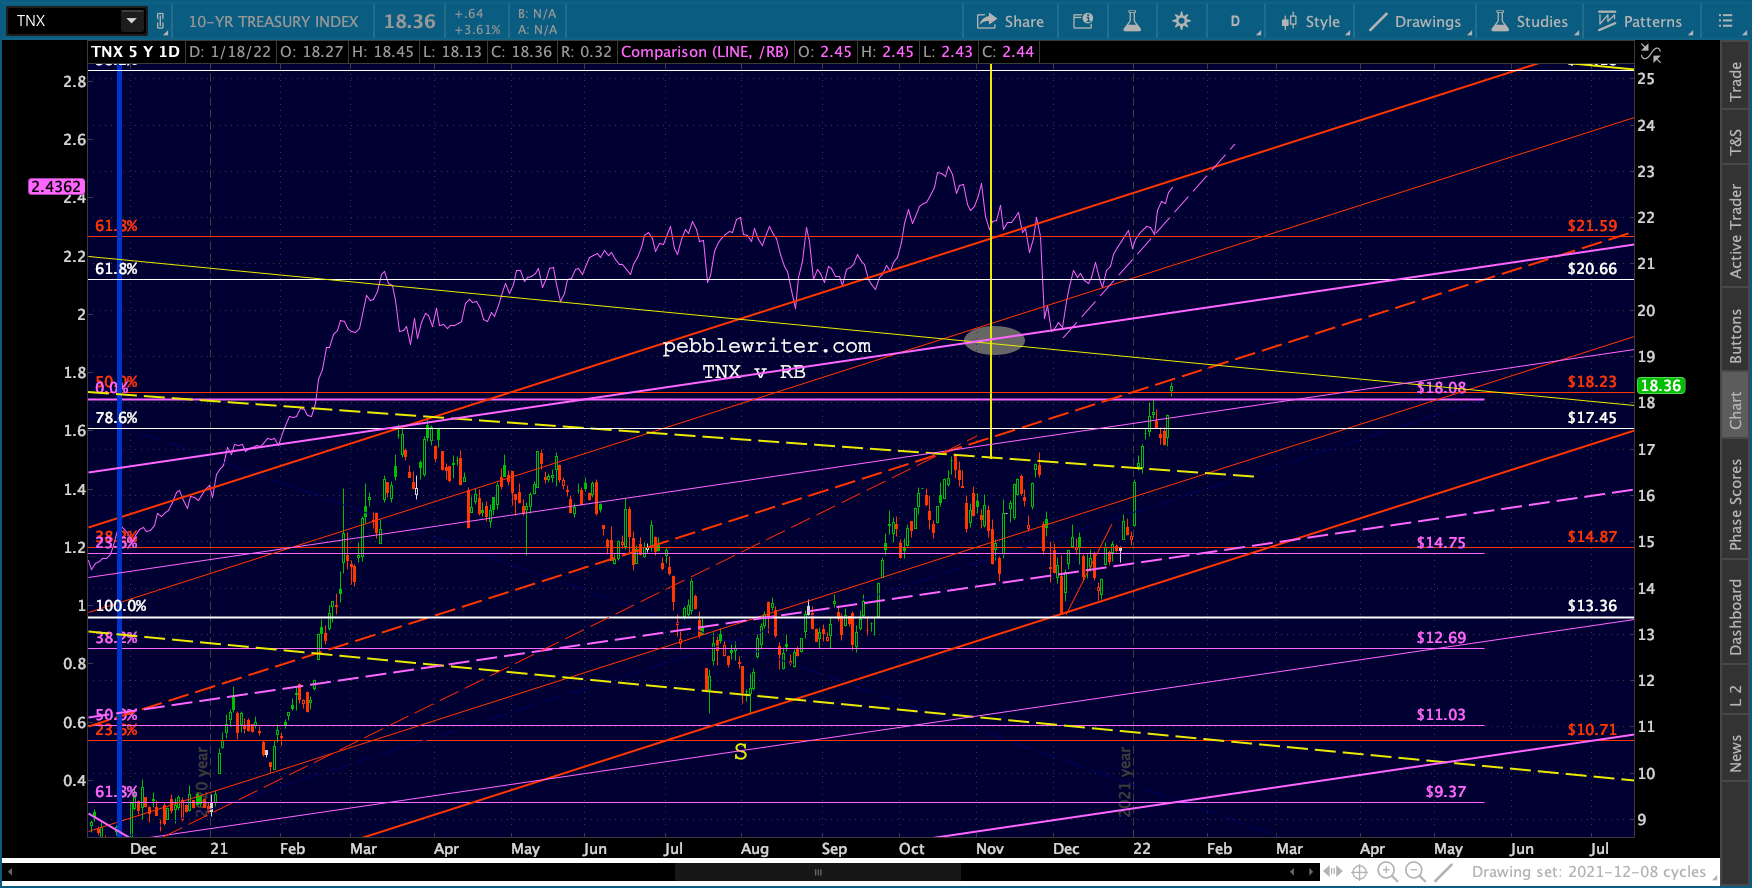
With the 10Y completing an IH&S Pattern and gapping up to 1.845%, focus on the price of oil and gas. Bottom line, rates won’t decline until oil and gas do. And, if oil and gas decline sharply, the equity selloff will only accelerate. Decision time for the Fed.
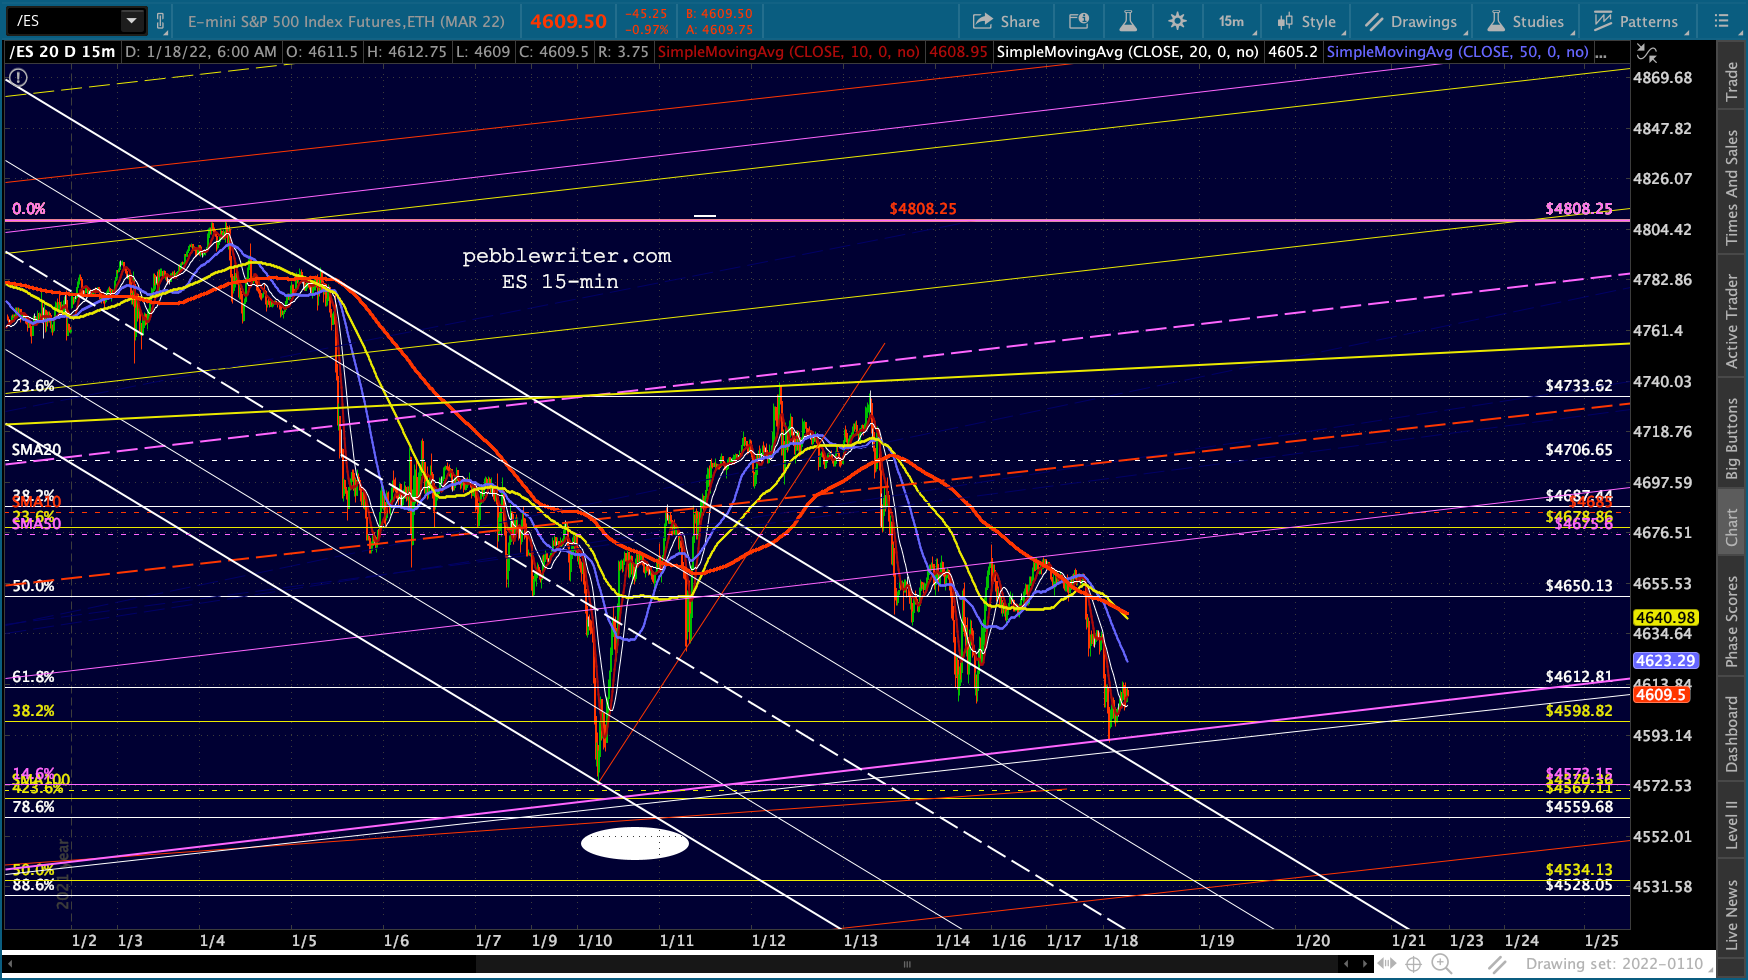
 Futures are down sharply. Our price targets remain unchanged.
 continued for members… (more…)
December retail sales disappointed, slumping 1.9% MoM and capping off a week of economic data which provided growing evidence of stagflation. The data were before nominal, meaning inflation-adjusted data were even worse. This is hardly surprising given that ever greater portions of Americans’ incomes are being consumed by rapidly rising prices.
 Futures, which were already off sharply, legged down further on the news.
 Our equity targets remain unchanged.
continued for members… (more…)
If PPI is growing at 9.8% annually (a record high) while CPI is growing at 7% annually (a 39-year high), who’s eating the difference between what producers bring in and what they must pay out? Just a hypothetical, of course, as profits – like inflation – apparently aren’t that important. Futures are higher on the news.
 Meanwhile, DXY is breaking down – which will add fuel to the inflationary fires.
 continued for members… (more…)
December headline CPI rose at 7.0% annually, its fastest rate since June 1982 when the 10Y yielded 14.44%.
 The index for all items less food and energy rose at 5.5% annually, its largest increase since February 1991. Both indices showed broad-based increases with almost all categories – most of which are sticky and not prone to declines – registering multiples of the Fed’s traditional 2% target.
 Energy continues to lead the charge, though as expected, its YoY increase continues to ebb.
 Algos, driven by the usual well-timed collapse in vol and a bump in oil/gas, are up moderately even after data that does nothing to alter the Fed’s taper and rate hike plans.
 continued for members… (more…)
The broader markets reversed sharply yesterday as soon as COMP reached our downside target – just below its 200-day moving average.  Yet, the futures are having trouble moving back above their 50-day. Long a source of support, it is now overhead resistance. Tighten your seat belts.
 continued for members… (more…)
