Author: pebblewriter

  • Analog Update: Nov 21, 2016

    It has taken a ramp job for the ages in both USDJPY and CL, but SPX came within 4 points of new highs on Friday.  2016-11-21-usdjpy-60-0600With a low-volume holiday weekend coming up, and breathless, moment-to-moment updates on the amazing, colossal, stupendous impending OPEC deal, what could go wrong?

    continued for members(more…)

  • Making Sense

    The past few years have entailed many instances of markets “not making sense.”  The latest iteration I hear about a lot is stocks’ continued rise in the face of a Fed hike, a bond meltdown, political uncertainty and an EM currency crisis.

    It’s important to understand that it has been years since stocks traded mostly on fundamentals.  At least, if not more important, are the yen carry trade, the oil-driven algos and other central bank interventions.

    And, all this has occurred against a backdrop of aggressive corporate leveraging in a historically low interest rate environment in order to buy back stock and, thus, leverage what little growth in sales/cash flow most corporations have been able to muster.

    With six weeks to go until year end, the market has a good strong whiff of the barn.  With TPTB giving it the whip, we shouldn’t be surprised that it’s seemingly picking up momentum.  The big question is whether we can get there without stumbling.

    continued for members(more…)

  • Crunch Time

    The past few years have demonstrated how easily stock prices can be manipulated higher.  Whether by direct central bank buying as is practiced by the BoJ and SNB, or indirect actions such as the Fed’s timely interventions in VIX, traders no longer question it.  “Buy the f-ing dip” has gone from a humorous quip to a legitimate investment strategy.

    Such was the case yesterday when, moments after the second strongly bearish inventory report in two days, the Russian energy minister announced that he sees “big chances” for OPEC to agree on an output deal.

    2016-11-17-cl-60-0600
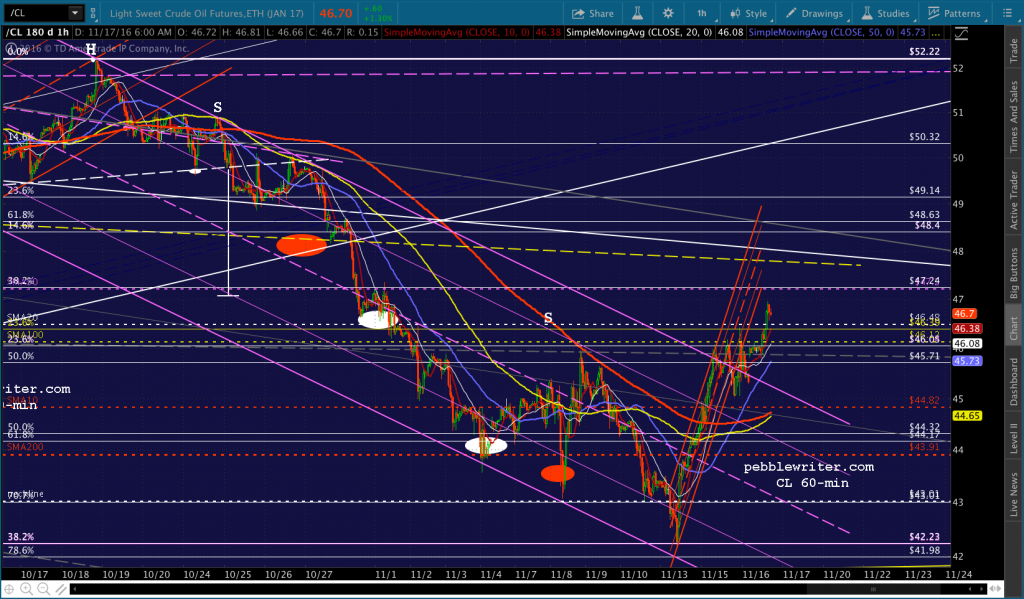
Coupled with concerted buying in the futures market — an investment — CL broke out of the falling purple channel it’s been in since mid-October where it now sits atop the SMA100 and SMA200.

    SPX, which was in the midst of a backtest of a falling channel that dates back to Brexit, popped out of the backtest and retested an important Fib level.  As seen here on the e-minis, the levitation has continued overnight on repeated rumors of an impending deal.2016-11-17-es-v-usdjpy-schizo
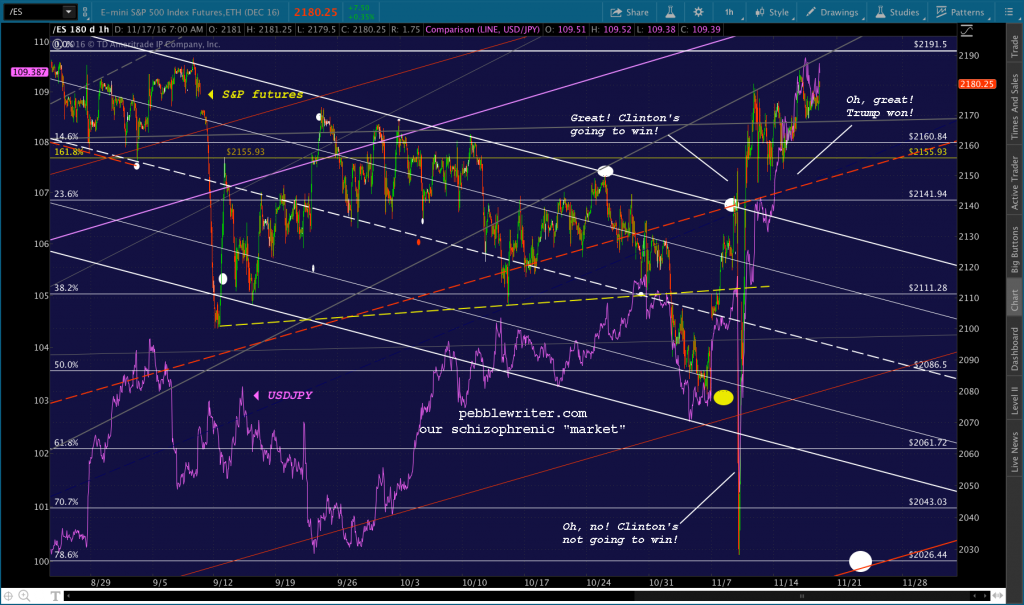
Such is the nature of today’s “market” when, once again, traders must question whether or not prices will ever again be allowed to swing freely.

    Now, it’s crunch time for the manipulators.  With the bond market melting down, and the US dollar hitting our breakout threshhold, it’s time to put up or shut up.

    continued for members(more…)

  • Update on DJIA: Nov 16, 2016

    Updated: Nov 16, 2016

    In May of 2015, SPX completed a huge Butterfly Pattern set up by the 57% drop between 2007 and 2009. It helped us call an important top [see: The Last Big Butterfly] and made for some pretty profitable shorting opportunities.

    Since then, as TPTB wrestled with a way to get SPX back above 2138, the Dow slowly worked its way higher. Just Monday, it came within 40 points of completing its own Butterfly Pattern for the same time period.

    continued for members

    Might this signal another important top?2016-11-16-dji-wkly-0620The daily picture shows a deep dedication to breaking above the 2015 highs and backtesting the falling channels established by the subsequent drop — whichever channel you happen to like.2016-11-16-dji-daily-0620Forty points is nothing to the DJIA – a measly 0.2%. So, it would take very little effort to push it on through. However, as we’ve been discussing for the past several days, SPX is currently in need of a 1.5% retracement to backtest its broken white channel and, most likely, its SMA10.

     *  *  *

    note to members: the above was originally added onto the DJIA page under the “markets” tab.  I thought it might be easier to follow the progression if it had its own post.

  • The Dow Makes Like SPX — Matters

    Monday’s Big Picture update was one of our most important posts in a while. It not only explains the past several months, but offers specific price targets going forward into next year. 

    If you’re new to pebblewriter.com or have been away for a while, we’re offering a great way to get acquainted.  Auto-renewing monthly subscriptions are available for half off the first month.  For details and to sign up now…

    CLICK HERE!

     *    *    *    *    *

    In May of 2015, SPX completed a huge Butterfly Pattern set up by the 57% drop between 2007 and 2009.  It helped us call an important top [see: The Last Big Butterfly] and made for some pretty profitable shorting opportunities.

    Since then, as TPTB wrestled with a way to get SPX back above 2138, the Dow slowly worked its way higher.  Just Monday, it came within 40 points of completing its own Butterfly Pattern for the same time period.

    2016-11-16-dji-wkly-0620Might this signal another important top?

    continued for members(more…)

  • Deutsche Bank: All Better?

    Thank God for the news cycle, eh DB?  With orange people and snowflakes and Italians hogging the spotlight, DB has slipped on a pair of dark shades and is mingling with all the other regular Joes which are rallying because… well, it doesn’t really matter, does it?

    It’s a good thing, because after bouncing 42% since our bottom call on Sep 21 [see: Deutsche Bank: Will it Survive?], DB is clearly ahead of itself.  2016-11-15-db-60-0645

    It has broken out of the falling red channel and the rising red channel and has broken above its SMA200 — all good things.  But, it has also completed a Butterfly Pattern that should see it shed at least 7%, probably back to its SMA200 — currently at 15.62.

    At some point, folks will start to wonder, again, how many trillions of unhedged FX exposure DB has.  Until that happens, this should be a corrective wave amidst an ongoing stock buyback operation rally.

    If the SMA200 doesn’t hold, there is a gap to fill at 14.87 and a forlorn red channel to flesh out at 14.61 or 13.88.  But, I wouldn’t hold my breath.

  • What Goes Up…

    ES’ levitation off its election night lows has drawn very little attention.  But, as we discussed yesterday, it was a stark reminder of the ability and willingness of the central planners to do “whatever it takes” to keep stocks on track.2016-11-15-es-60-0600Frequently, though, these stick saves are more than was necessary, and they’re left with the question of how to back fill a rally without panicking the masses.  Such is the situation this week.

    continued for members… (more…)

  • The Big Picture: Nov 14, 2016

    In our last Big Picture post on Oct 26, we focused on two key drivers of equity values.

    The problem, as noted in Welcome to Peak Oil, is inflation….  CL peaked [October 9, 2015] at 50.92 and plunged to 26.05 over the next four months.  If it doesn’t do the same thing now, we’ll get year-over-year inflation.  Since this past Feb, CL has been the primary factor in stocks moving higher.  If it can’t maintain that role, then TPTB will need to find another algo engine — or stocks will fall.2016-10-10-cl-daily-big-pictureThe yen carry trade worked from 2011 – 2015, but can it be resurrected? USDJPY has certainly changed its tune since CL’s top first became a problem.  Note that it broke out of a very well-formed falling channel dating back to Oct 2015 at the very moment that CL was testing its yellow neckline.

    Oil has now fallen 18% since our Oct 10 top call [see: Welcome to Peak Oil], and USDJPY, has risen a spectacular 6.9% since last Tuesday night’s election lows.  That’s all well and good.  But, the big surprise in preparing this post was that the analog  [what’s this?] I first advanced 3 1/2 months ago [see: A New Analog: Aug 3, 2016] continues to play out relatively well.

    continued for members(more…)

  • Update on NYSE: Nov 13, 2016

    In our last update [see: Aug 23 Update on NYSE] we noted that the index’s difficulty in pushing above the .786 Fib at 10759 would likely result in a dip to test the SMA200 near the .618 at 10369.

    The subsequent bounce has, in my opinion, been overdone.  NYSE has criss-crossed the .786 at 10,759 15 of the past 30 sessions — not a great sign for the bulls.  I think it’s more likely to break down from here and (at least) backtest the .618 at 10,369.

    It wouldn’t be a big move, but it would jibe with my views on SPX of mostly sideways action through the election.  Note that the SMA200 should continue trending higher, arriving at the .618 (also, proximate to the 2007 highs) around election time — providing additional support in case it does break down.

    As it turned out, NYSE did run out of steam shortly after that post.  After Aug 23 (the yellow arrow below) it danced back and forth across the .786 for two weeks before finally breaking down on Sep 9.  Even then, it held on for another month before the rising white channel finally broke down.2016-11-13-nya-daily-cu-2229

    As expected, the selloff was mild.  It arrived at the 2007 highs a few days before the SMA200 reached the .618.  Like everything else that wasn’t nailed down, Nov 4 marked the bottom.  It has rallied strongly since then, almost reaching the .786 again this past week.

    So, it’s an excellent time to look at next steps, especially in light of our new big picture forecast for the next two months. (more…)

  • Update on RUT: Nov 11, 2016

    In our last update [see: Sep 2, 2016 Update on RUT] I noted that the index was approaching a key Fib level that should produce a sizeable drop to backtest an important channel.

    …with the .886 within a few points, we’ll find out.  We should get a pullback at 1255.77 that would start by backtesting the broken purple channel…If it happens, the purple channel top [1174] will likely hold.

    RUT went on to test 1255 on Sep 7 and again on Sep 22 before reversing. Because the 2nd attempt to break out delayed the reversal, the channel backtest produced a slightly greater drop: an 8% drop to 1156 rather than the 1174 I originally forecast.

    As expected, the channel top held.  RUT has since rebounded by 10.2% and is approaching new highs.  What’s next for this volatile index?

    continued for members(more…)