

The past few years have demonstrated how easily stock prices can be manipulated higher. Whether by direct central bank buying as is practiced by the BoJ and SNB, or indirect actions such as the Fed’s timely interventions in VIX, traders no longer question it. “Buy the f-ing dip” has gone from a humorous quip to a legitimate investment strategy.
Such was the case yesterday when, moments after the second strongly bearish inventory report in two days, the Russian energy minister announced that he sees “big chances” for OPEC to agree on an output deal.
 Coupled with concerted buying in the futures market — an investment — CL broke out of the falling purple channel it’s been in since mid-October where it now sits atop the SMA100 and SMA200.
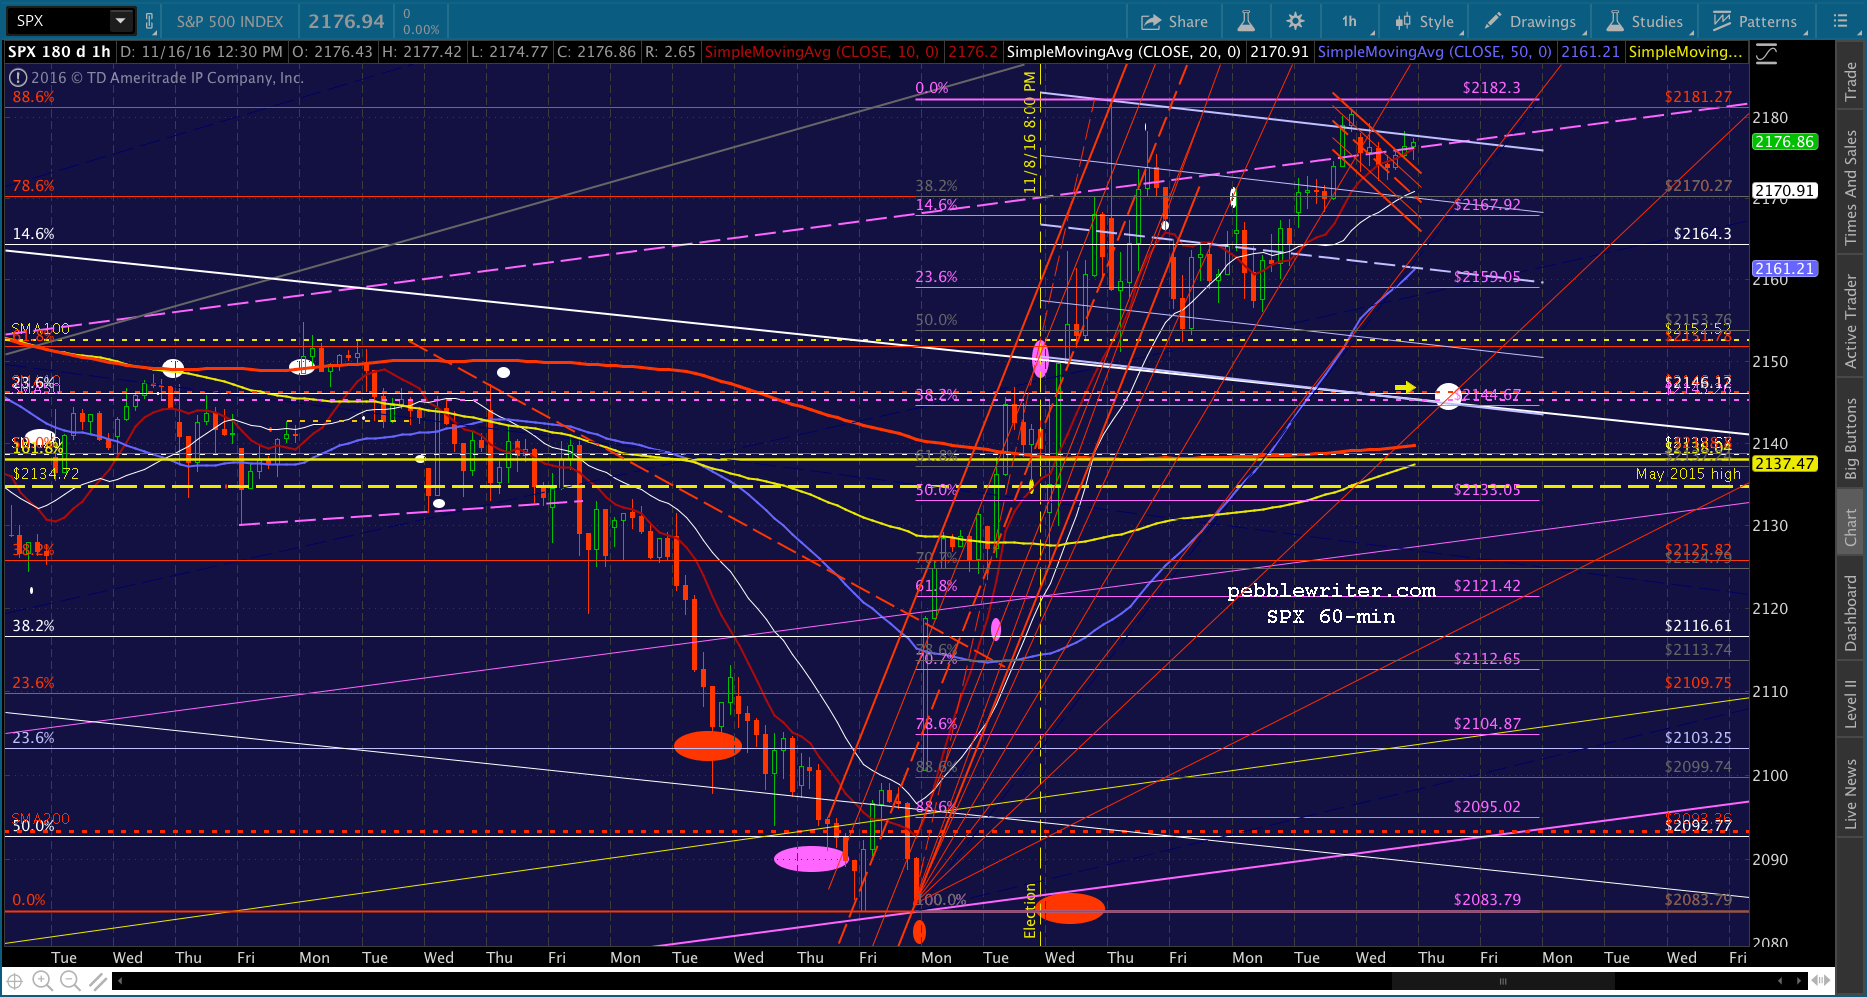
SPX, which was in the midst of a backtest of a falling channel that dates back to Brexit, popped out of the backtest and retested an important Fib level. As seen here on the e-minis, the levitation has continued overnight on repeated rumors of an impending deal. Such is the nature of today’s “market” when, once again, traders must question whether or not prices will ever again be allowed to swing freely.
Now, it’s crunch time for the manipulators. With the bond market melting down, and the US dollar hitting our breakout threshhold, it’s time to put up or shut up.
continued for members…
The backtest and SMA10 seem miles away, now. And, it’s getting more difficult to imagine a drop of the magnitude that would be required to accomplish it.
 VIX is certainly in position to facilitate such a drop.
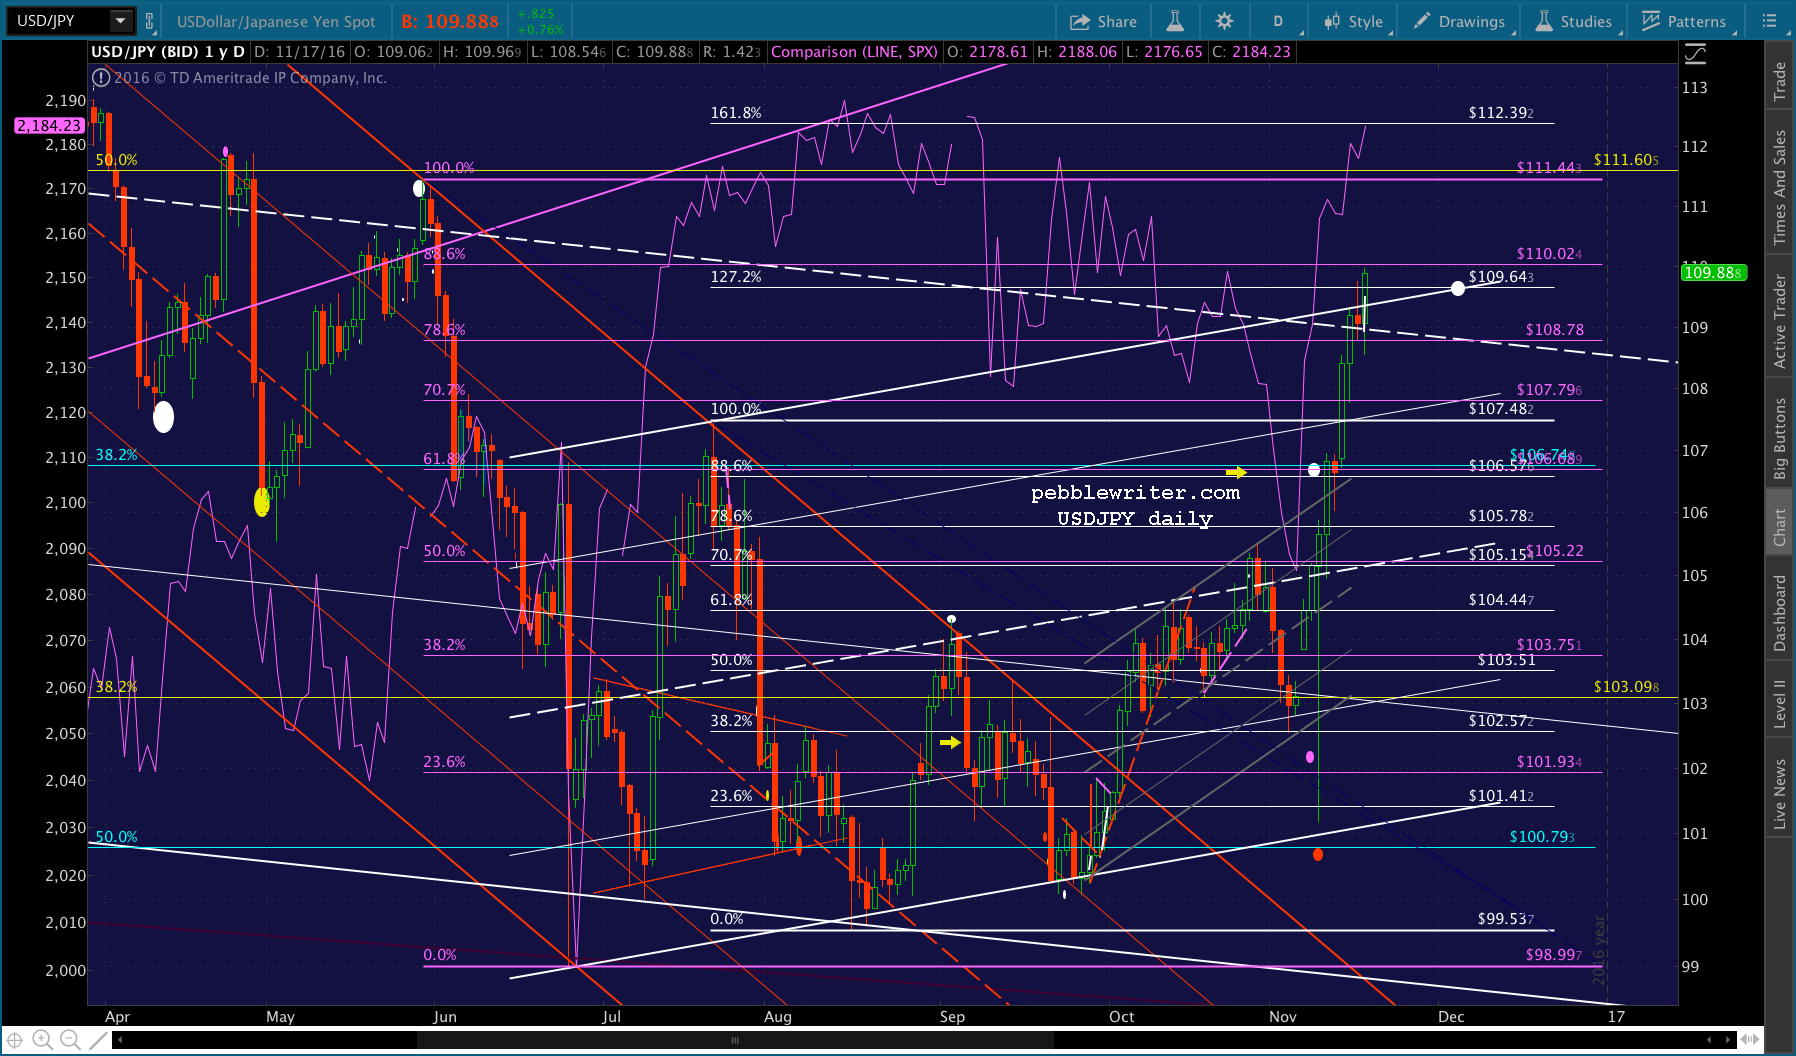
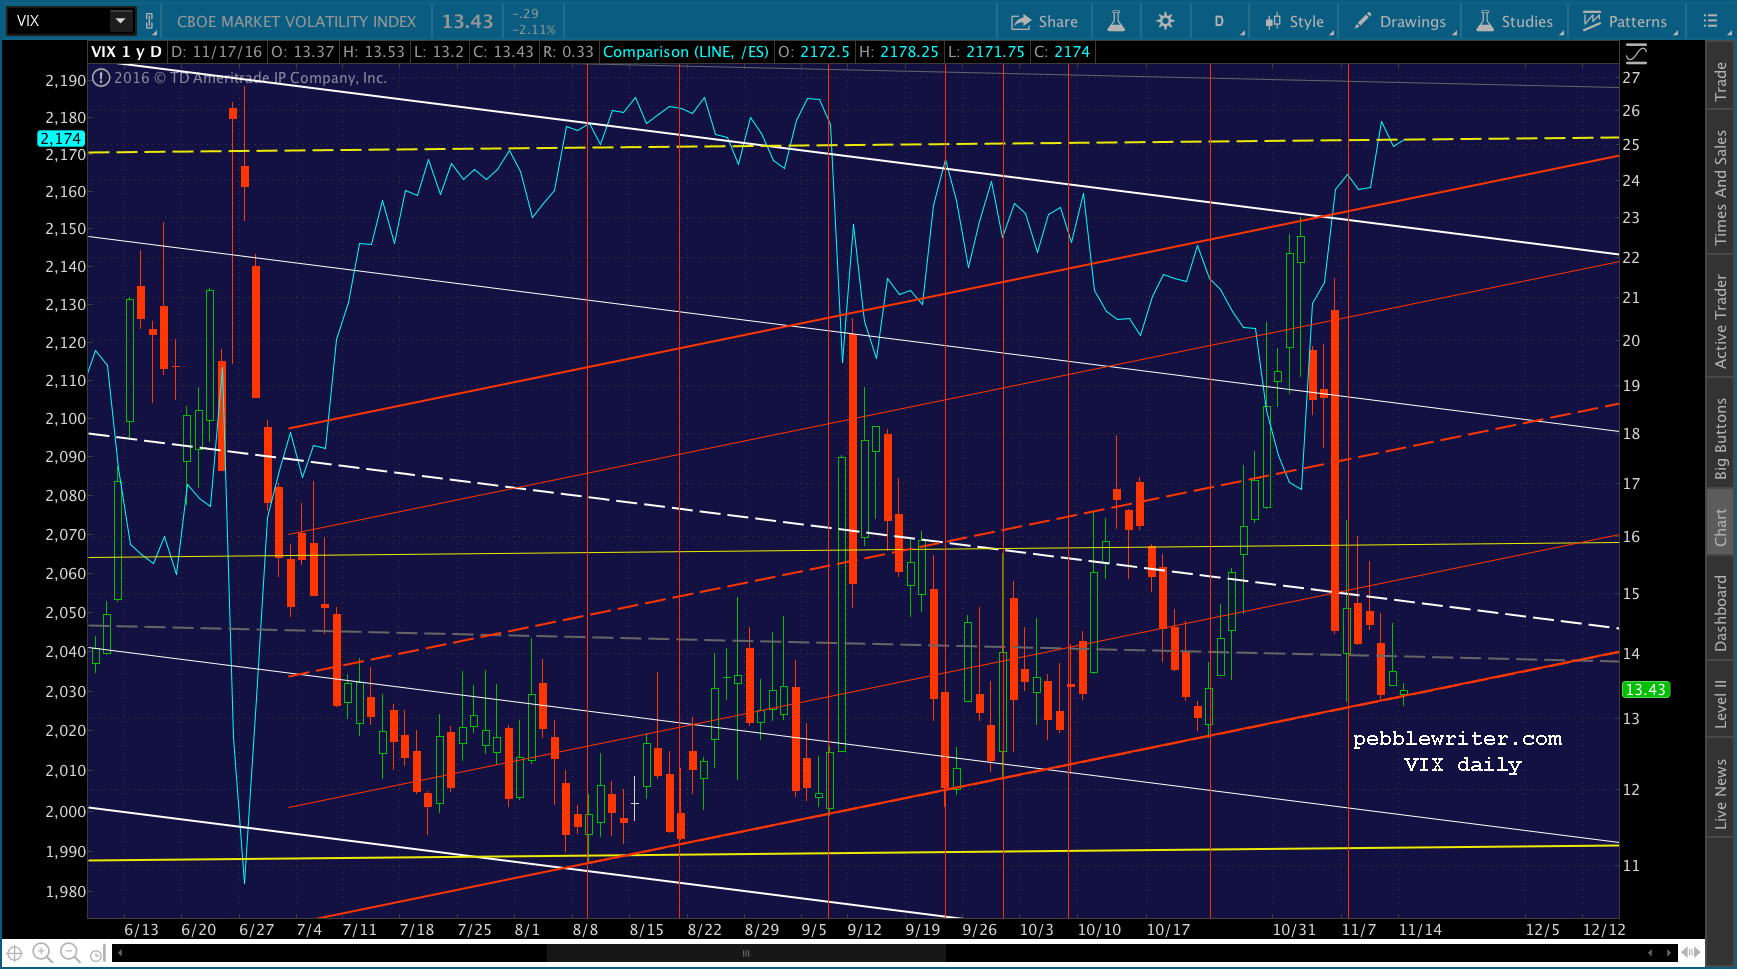 USDJPY is, too.
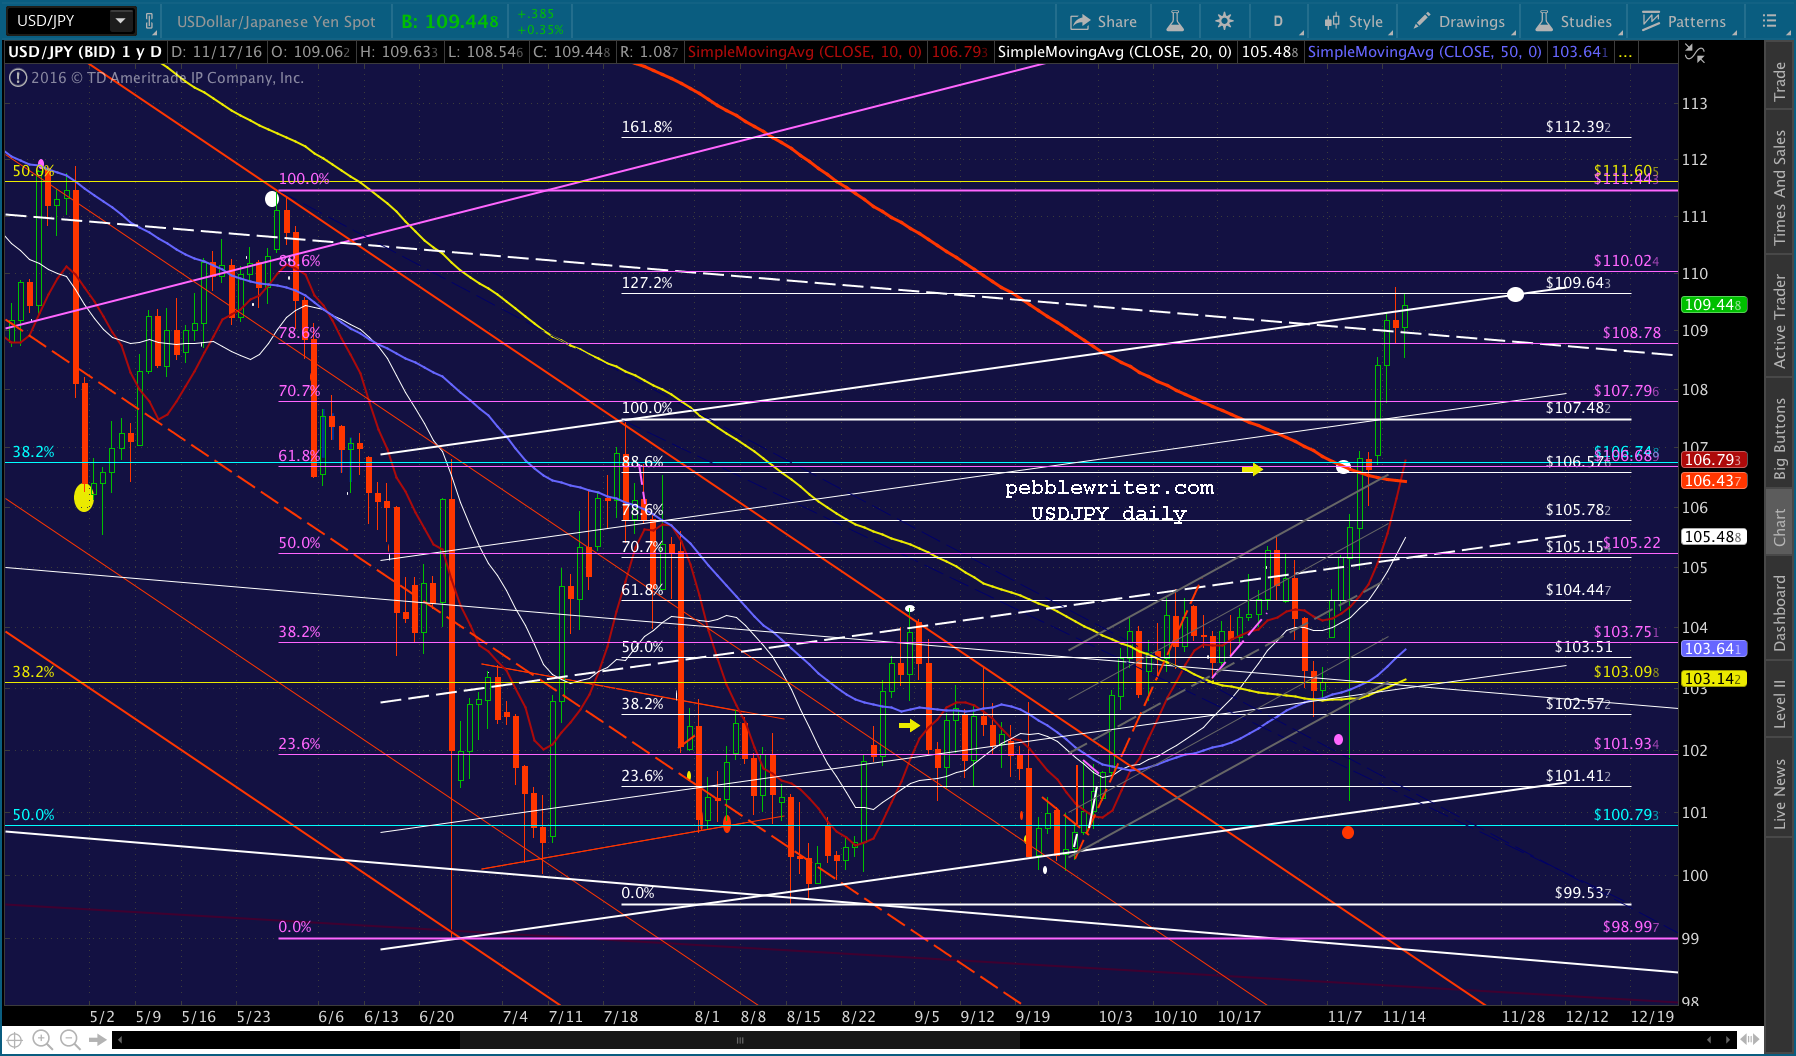 Perhaps most importantly, DX has reached its Mar 2013 and Dec 2015 highs. When it backed off this level on Mar 13, 2013, SPX bumped along sideways for a gut-wrenching five months before tumbling 240 points. After Dec 3’s tag, it vacillated wildly until year end before plunging 250 points.
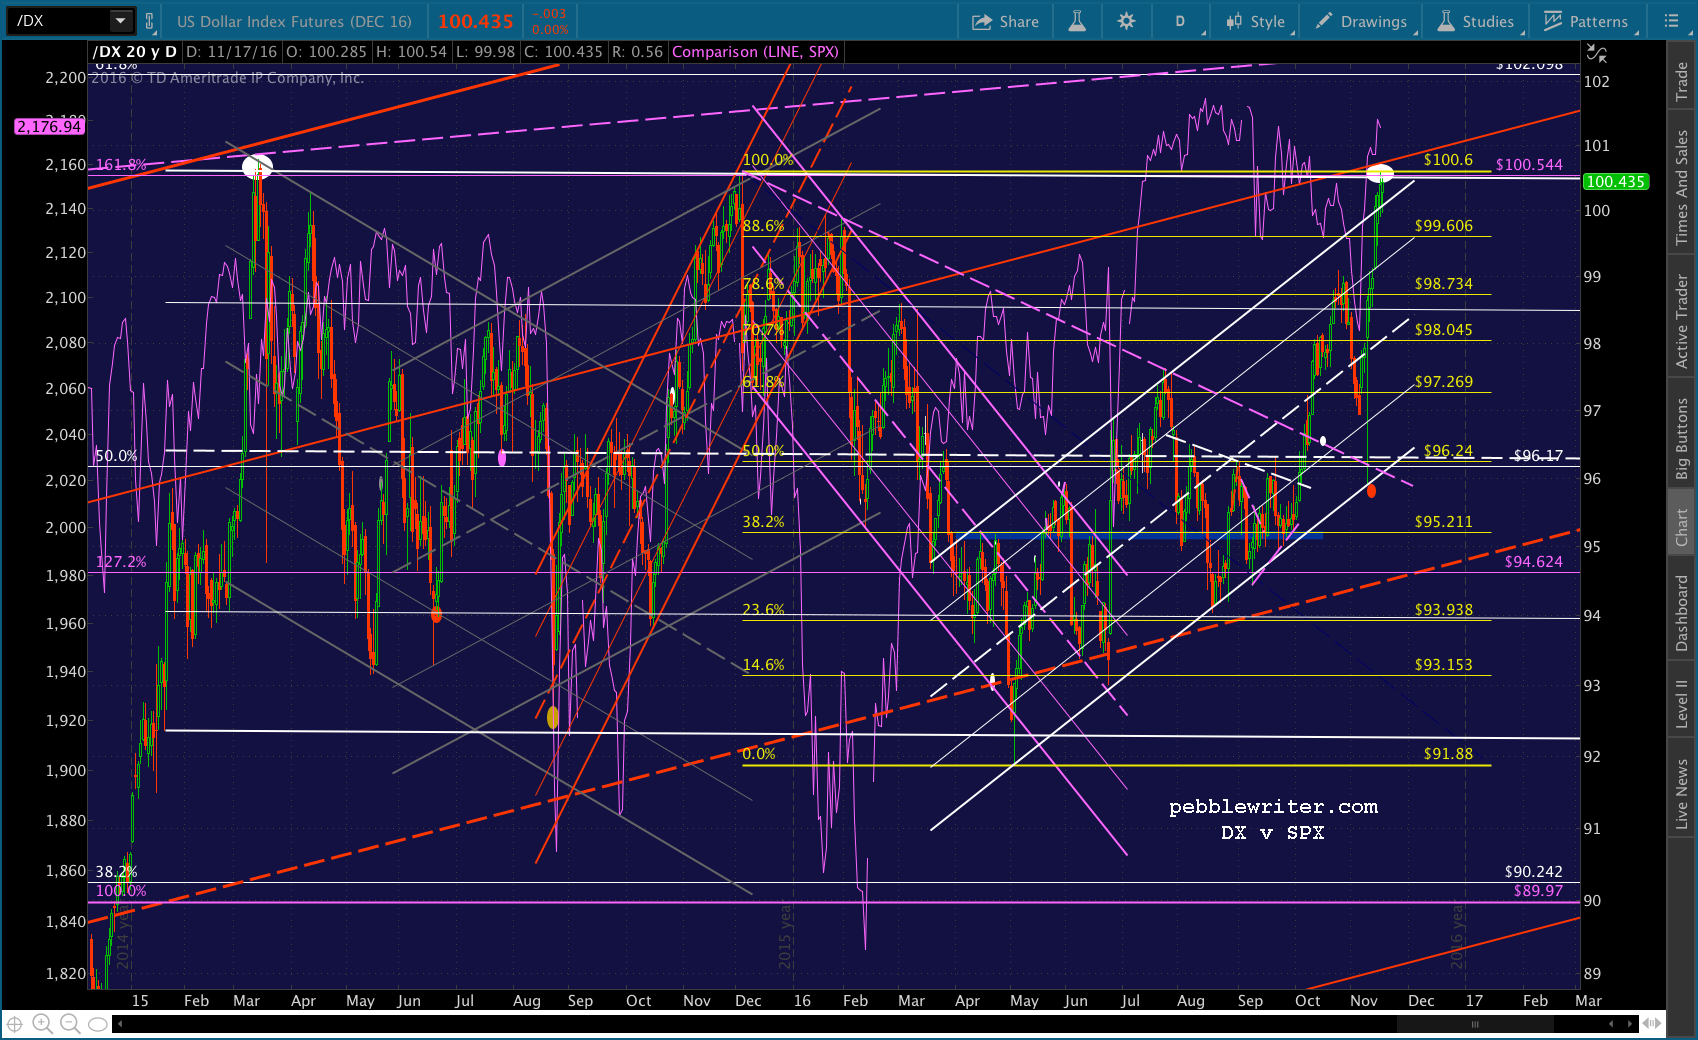 UPDATE: 1:45 PM
Rarely have I let my stops run as loose as 1%. But, this feels like a good time to make an exception. I’ve been thinking about the dollar all day. With the euro and the yen off so much, Japan and the EZ are going to have inflation problems — especially if oil doesn’t crash right back down where it belongs.
Higher oil and lower yen/euro = inflation. Inflation and no growth = stagflation.
A higher dollar and higher oil prices works for the US, but we rely on the BoJ and ECB to help prop up markets. So, I don’t think the current situation is sustainable.
Having said that, DX has been going sideways for two long years. If rates really do stay higher and the FOMC raises as they say they will, then a breakout seems almost certain.
What could halt such a move? In the past, it was “market conditions” or, as we like to call it, a correction. The Dow’s chart suggests a decline might be in the offing. I know it didn’t quite tag its 1.618, but neither did SPX before it starting sell off by hundreds of points.
USDJPY is on the brink. It could break out here or reverse at the .886 Fib.
 CL is already breaking down, but could play the fake breakout game for weeks on end as it has before (break out during “market” hours, reset overnight; rinse and repeat.)
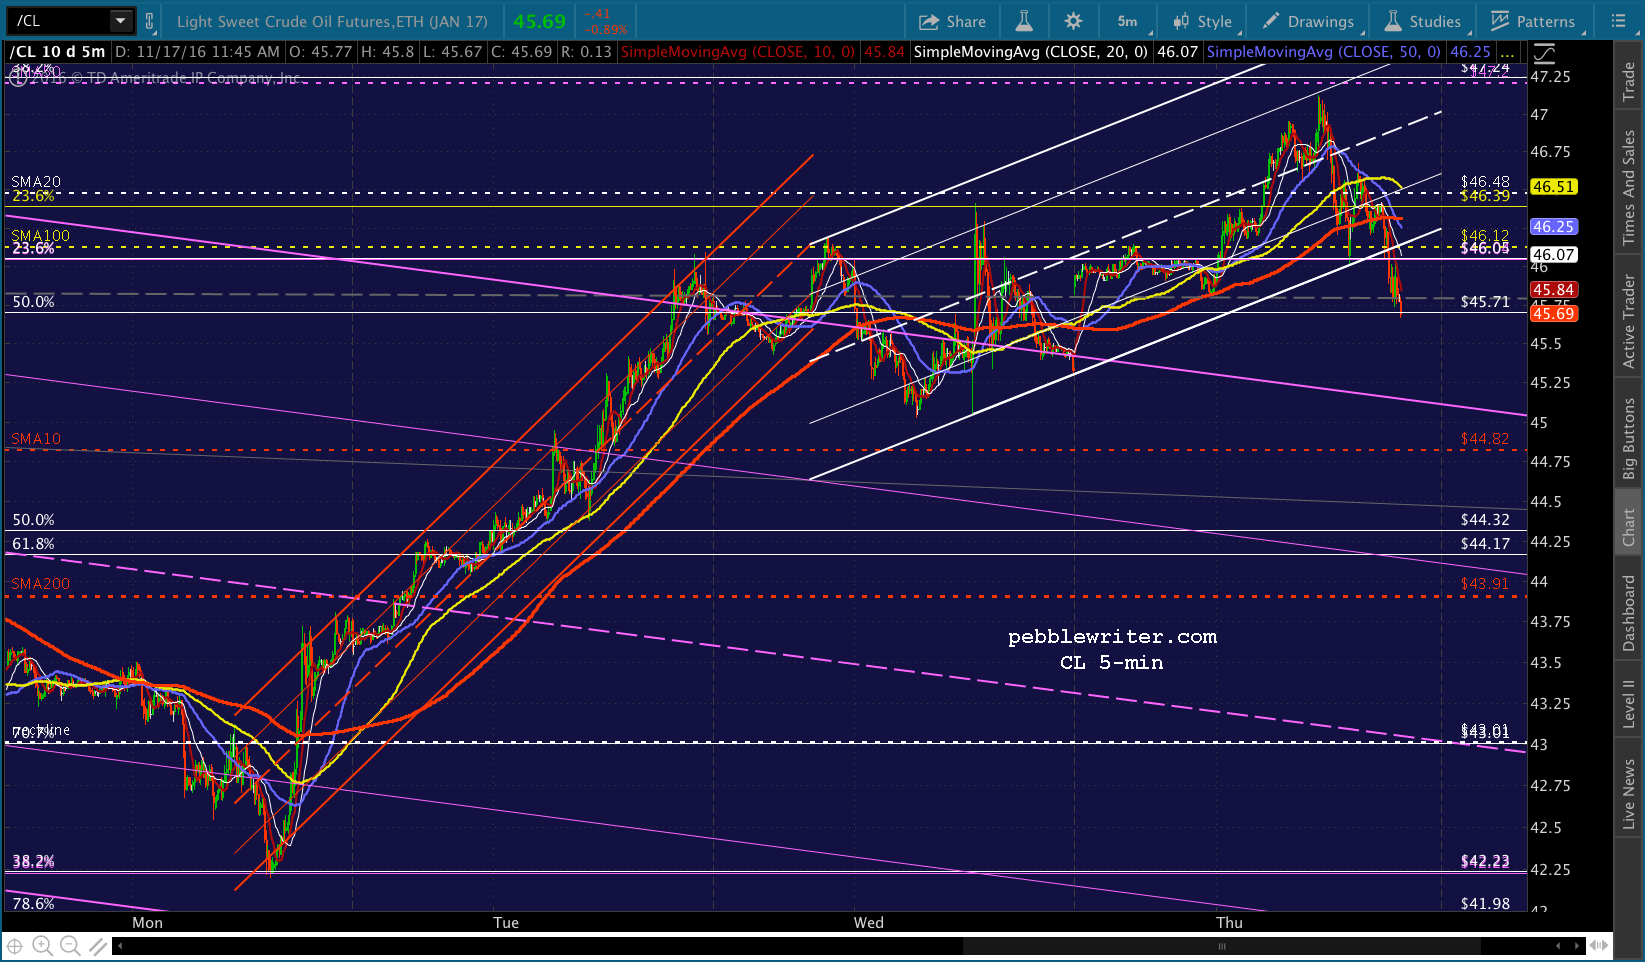 SPX seems unlikely to backtest to 2146 at this point. As the SMA continues higher, so does our backtest target. It’s currently about 2186, up about 10 points since yesterday.
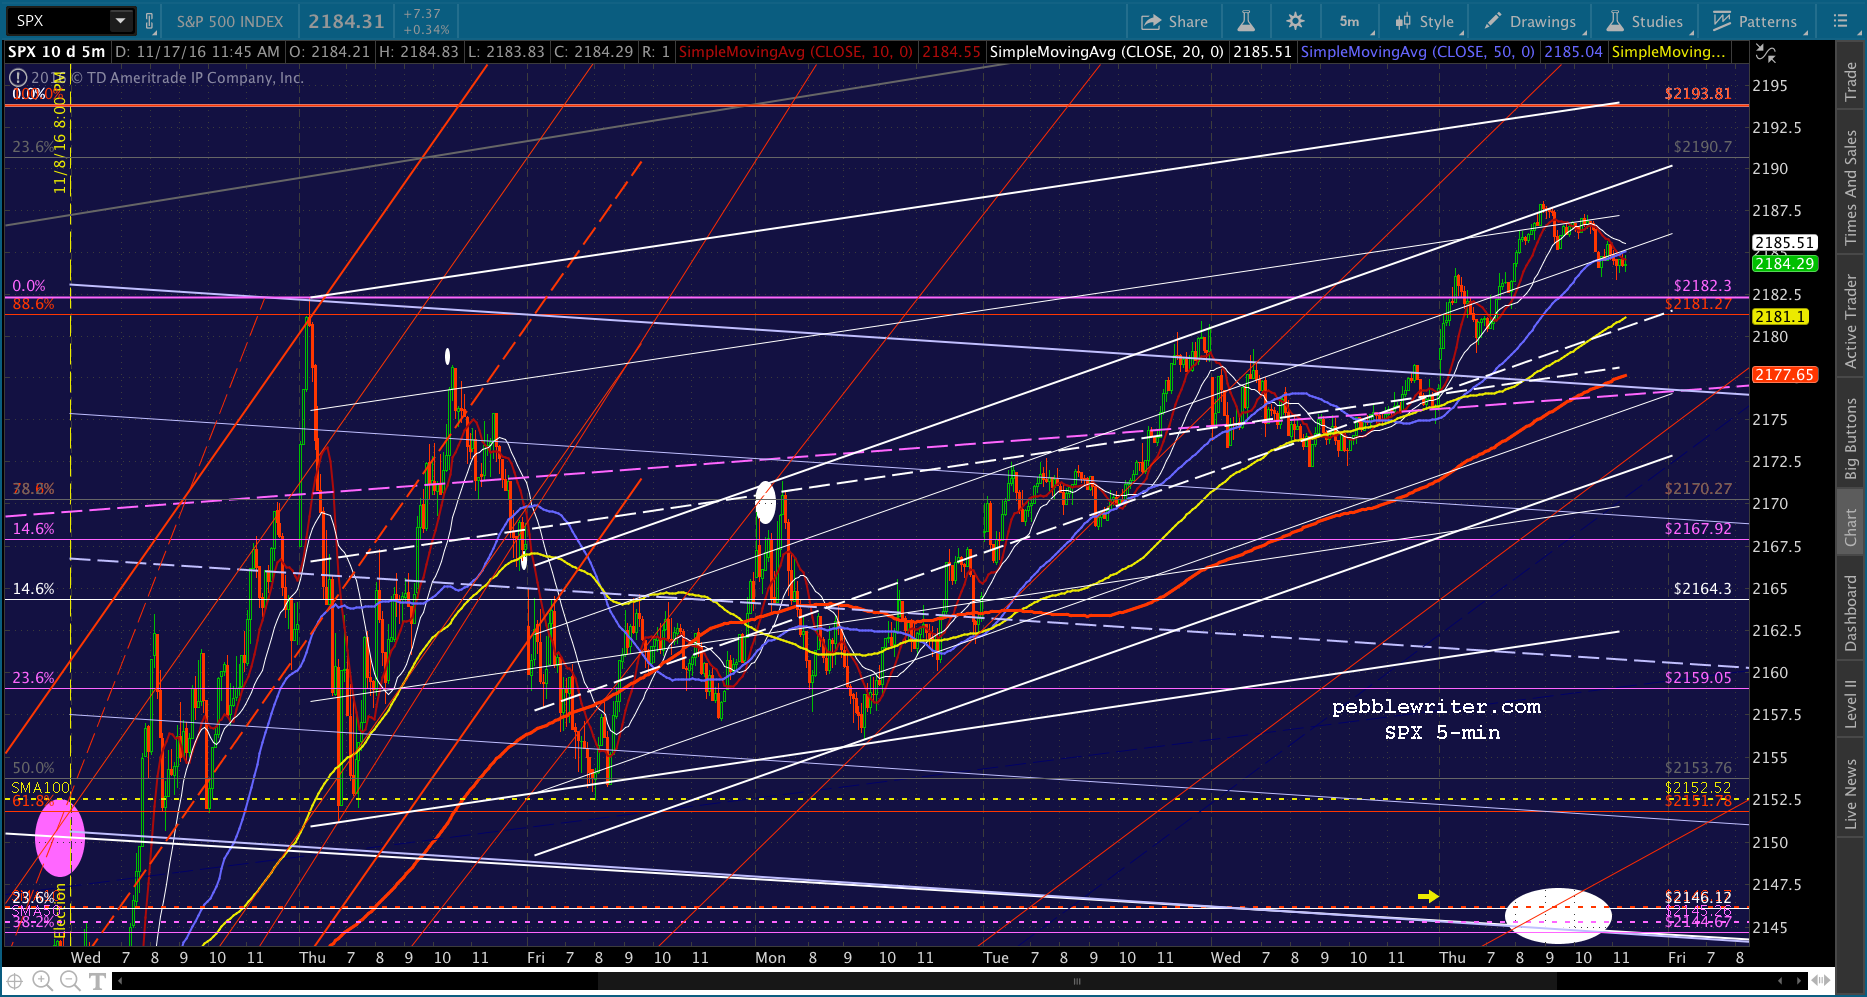 Someone asked yesterday about the SPX analog showing higher highs and DJIA running into its Butterfly target resistance. I don’t see any inconsistency here. SPX is trying to make a higher high, while DJIA would love to simply break out.
Here’s an example of how binary the situation is. At 7.49%, Goldman Sachs is the biggest component of the Dow.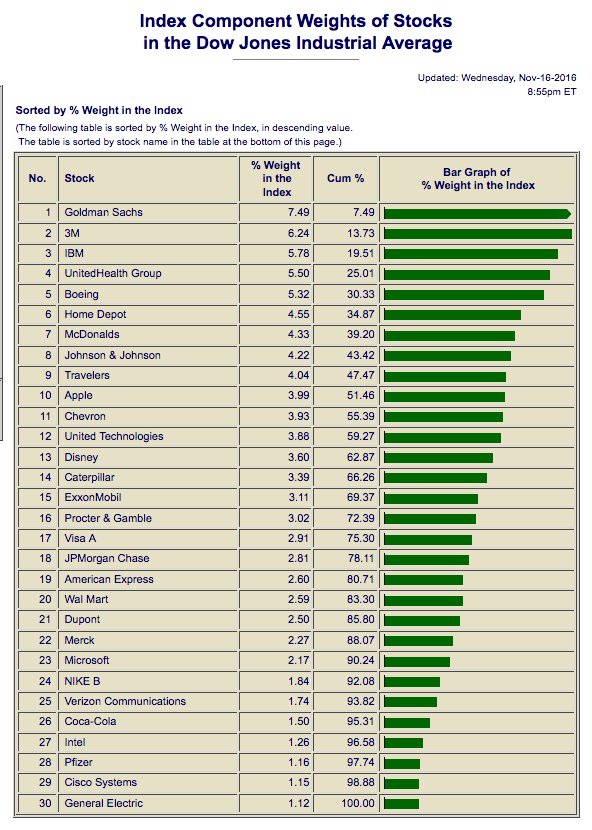 Goldman is at a critical point in its chart where it must either break out or break down. You might think, them being Masters of The Universe and everything, the stock had done at least as well as the S&P. Not so. After all this time, it climbed briefly above its .786 retrace even as SPX was approaching its 1.618 extension.
 If we look at a close-up since SPX’s 2015 highs, we can see that GS only recently started making a big comeback (looking at the rise from mid-October, I wonder if they had a massive short going on oil.)
But, in so doing, it has merely backtested a TL from the 2009 lows and completed a Bat Pattern. In other words, it’s at stiff resistance right now. And, it’s the biggest part of the Dow. MMM, which is #2 on the list, has fared much better — popping nearly to the 2.618 extension and going strong. Of course, it might be related to 3M’s $10BB buyback program approved last Feb. It’s pretty sizeable, considering the $104BB market cap, and just might be the reason behind 3M’s 22 PE ratio.
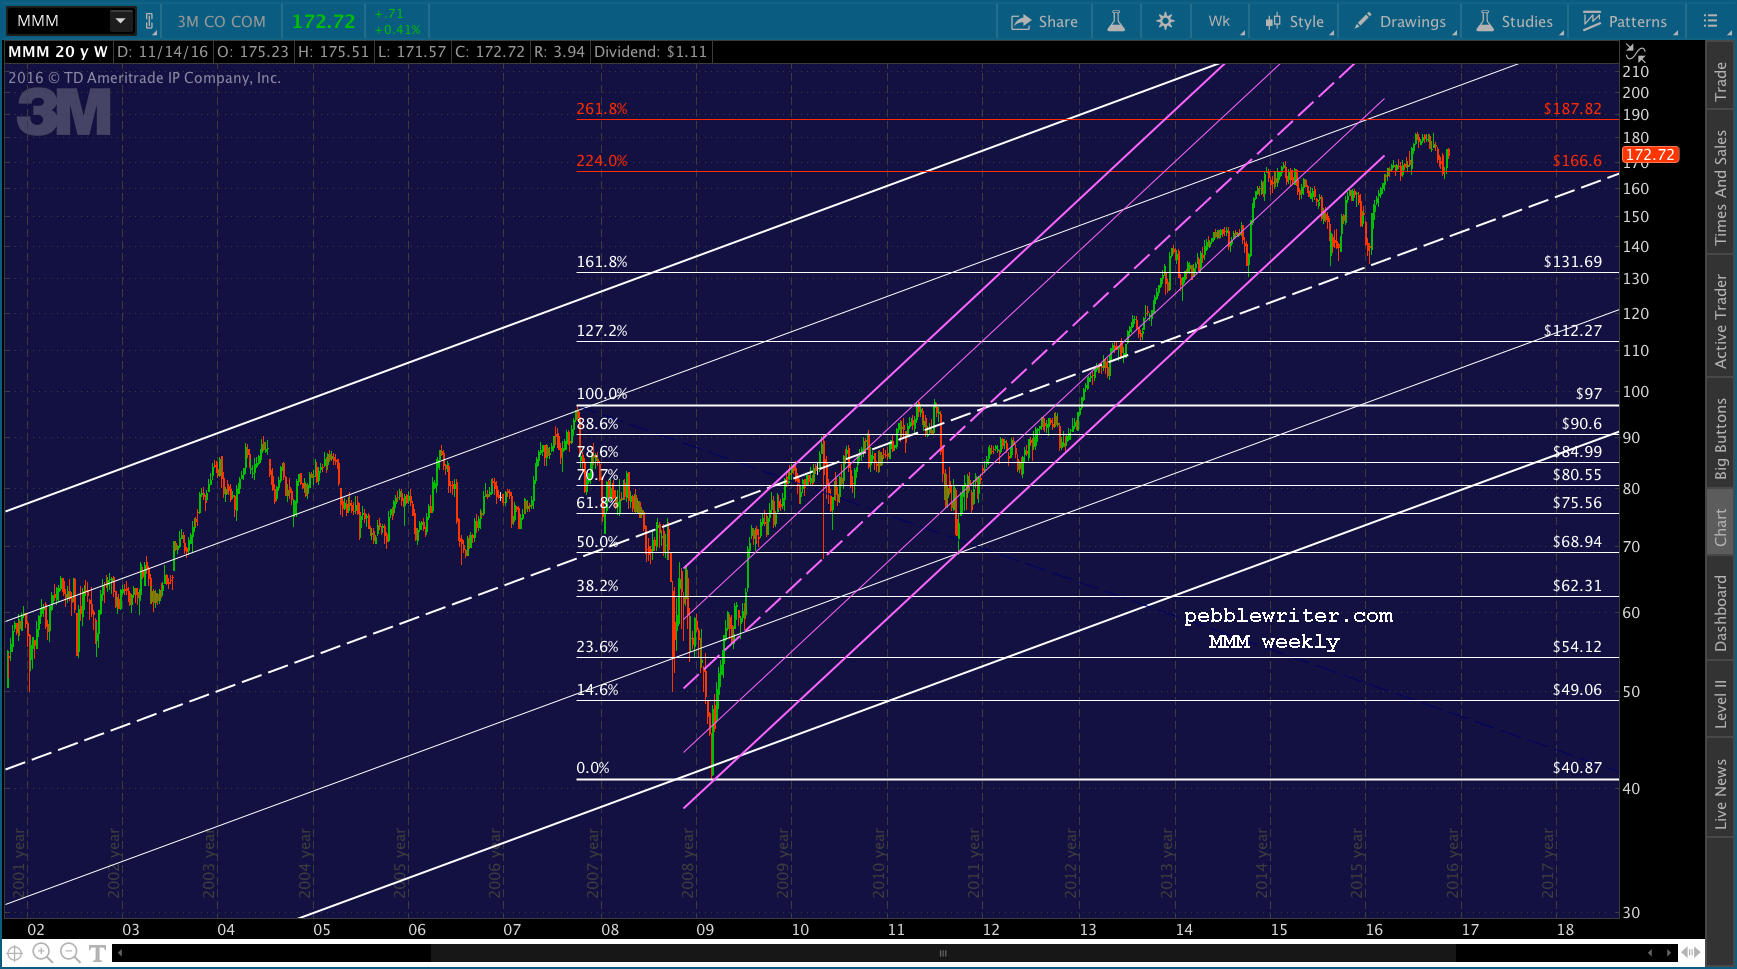
Comments
6 responses to “Crunch Time”
if Yellen is talking rate hike then why is the market happy
I think “happy” is a gross exaggeration. More like following the USDJPY higher. It was up another 1.06 today.
PW,
Credit Suisse is delisting DWTI & UWTI as of Dec 8th. That ‘might’ be a significant date. We shall see.
Very interesting. Thanks for pointing that out.
What does this delisting imply?
Judging from the performance, neither was likely to attract much money. UWTI is down 51.70% YTD and DWTI is down 61.72%. Hard for triple leveraged ETFs not to lose money, anyway. But, when the underlying is so volatile…