Author: pebblewriter

  • Ready, Set…

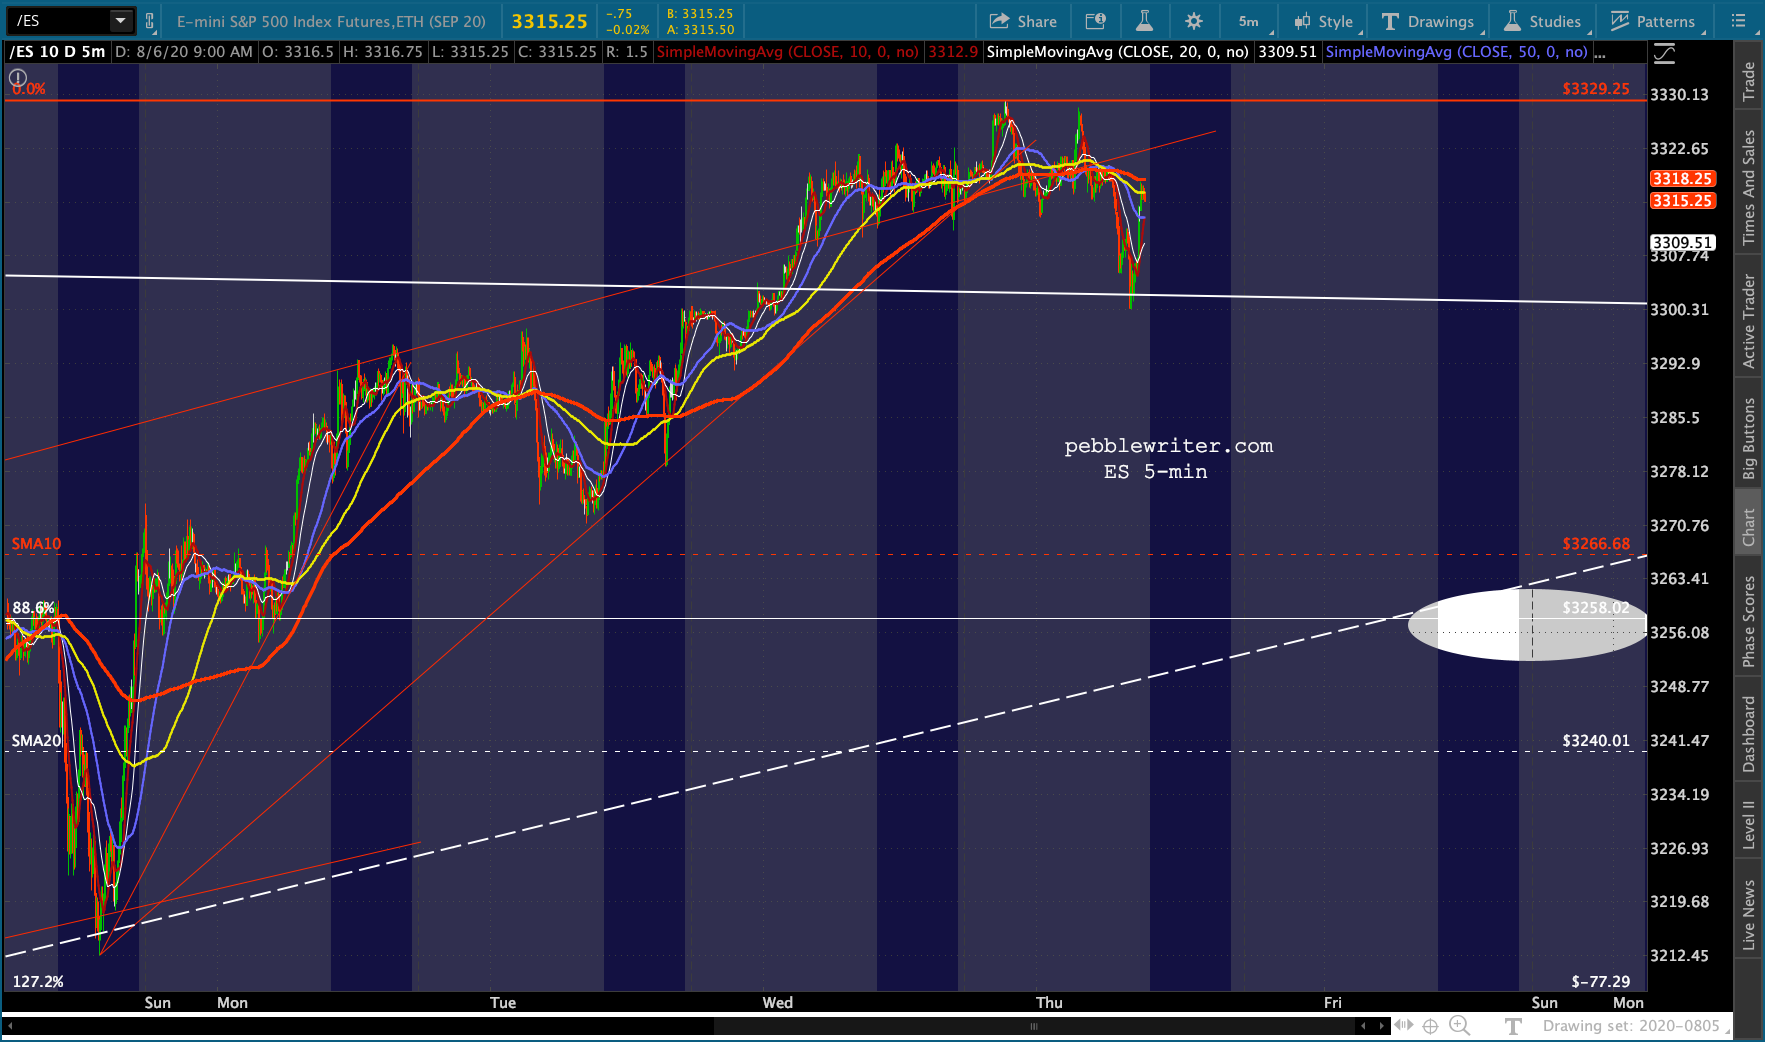
    In the latest 30-pt ramp job, ES ran out of juice at a backtest of its 10-day moving average – not exactly a bullish move. This would leave SPX with a backtest of its own, suggestive of the additional downside Friday’s session left on the table.

    It also suggests a nice little Head & Shoulders pattern that could finally get a correction rolling. Should we be concerned about the breakdown in the dollar and breakout in gold?  Or is the yen’s breakdown the more serious threat to stocks?

    continued for members… (more…)

  • More Where That Came From

    In yesterday’s A Failure to Capitulate we chided the market for its failure to make good on the downturn signaled by our numerous bearish charts. For once, the market gods were listening. Futures are off 85 points from recent highs and teasing us with the notion of a — brace yourself — drop below the 10-day moving average. While we await the next breathless vaccine announcement or congressional handout, note that VIX popped up to our first upside target……and USDJPY is finally breaking down.Don’t look now, but AAPL is even making nice progress following its Fib tag. Is there more where that came from?

    continued for members… (more…)

  • A Failure to Capitulate

    Futures have given up all their Tesla gains and are pointing to a slightly lower open for the S&P this morning.Apparently, a threatened breakdown in VIX just isn’t as effective as it used to be.

    What we have here is a failure to capitulate (apologies to Cool Hand Luke for the cheap rip-off of a great movie.)

    continued for members… (more…)

  • Currencies: A Turning Point

    Lots going on this morning, with currencies joining VIX in leading the equity circus. EURUSD smashed its March highs and is closing in on one of two levels of overhead resistance as DXY tests an important channel bottom. The next moves for each will have important implications for the economy and for algo-driven equities.

    ES has recovered 23 points of its overnight losses after failing to hold our .886 Fib target.  It’s one vaccine headline away from recovering 3258.

    continued for members… (more…)

  • Shades of 2015

    SPX reached our Fibonacci .886 retracement target yesterday. It’s a level I never imagined seeing after stocks reached important support back on March 23. But, then, I never imagined $5 trillion in liquidity  – equal to the nation’s Q2 economic output according to the Atlanta Fed – being pumped into the economy in the second quarter.

    We’ve always known there would be a fundamental battle between another round of QE (remember when Powell insisted it wasn’t QE?) and the realities of the worst pandemic in over 100 years, spawning unemployment that would exceed the GFC and deaths in the hundreds of thousands if not millions. But, this market cares little about fundamentals. It cares about liquidity and a steady diet of the right signals being fed to the algos.

    Central bankers and governments have delivered on both counts – with WTI having risen $59/barrel and VIX plunging 72% and with liquidity injections purportedly intended to bolster employment which, in many cases, went into stock buybacks.

    Nevertheless, here we are. In Harmonics, the .886 Fib represents an 88.6% retracement, or rebound, of a significant drop.  It’s typically as large a rebound as you’ll see unless stocks test their former highs (a potential double top) or push past them to new highs. Unfortunately, it’s not always clear cut.

    In May 2015, SPX tumbled 12.5% after coming within 3.32 points of our 2138.04 target. By Nov 2, it had retraced 88.6% of those losses, at which point we looked for a pullback. Instead, it spent the next several sessions pushing above the .886, no doubt stopping out plenty of shorts before finally succumbing and making new lows – the 1.272 Fib extension at 1823.42.With the pandemic picking up steam – at least in the US and many lesser developed countries – the fundamental picture is looking iffy at best. The technical picture, on the other hand, is flashing plenty of warning signals. Can we count on it mattering?

    continued for members… (more…)

  • Charts I’m Watching: Jul 20, 2020

    Another day, another VIX plunge in the minutes before the open – and futures, which were off 35 points overnight, are suddenly back in the green. continued for members… (more…)
  • When All Else Fails

    As expected, VIX is leading algos by the nose into another pre-opening ramp job on OPEX. Note the timely drop through the red TL, the yellow TL and, for good measure, the 200-DMA. Meanwhile FAANG member and COVID-19 darling NFLX did reverse at its channel top (the white dot below) as we expected [see: FAANG Update.]  It came within 5 points of our 444 target before bouncing. Keep an eye on it, as there’s much more downside if this support doesn’t hold.continued for members… (more…)

  • What’s Going On?

    Despite approaching OPEX, it’s getting harder and harder for stocks to find a reason to rally. So, last night, they didn’t.

    On the other hand, a 20-point drop isn’t enough for bears get excited about, let alone pile onto…at least yet. With so many algo inputs suggesting we’re at or near a turning point, what’s really going on with this market?

    Perhaps Linda Perry had it right…

    And so I wake in the morning and I step outside
    And I take a deep breath and I get real high
    And I scream from the top of my lungs
    “What’s going on!?”

    continued for members… (more…)

  • Frontrunning the Fed

    Ultra low interest rates don’t do much for traditional banking earnings, but they’re pretty fantastic for highly leveraged banks such as Goldman that are only too happy to front run the tsunami of Fed liquidity injections.

    Between GS and more positive vaccine news (Moderna) the futures have pushed to higher highs, settling the question as to which of the deep retracements is the ultimate upside target.  Note that the yellow channel midline served as a springboard yet again… …as did VIX’s daily drop to/through trend line support.continued for members… (more…)

  • FAANGs: Jul 14, 2020

    Note: CPI came in right on target: +0.6% unadjusted over the last 12 months. The MoM figure also rose 0.6% – driven, as expected, by the 12.3% increase in gasoline prices.

     * * *

    The last time I wrote a post including all the FAANG stocks was in November 2018 [see: FAANGs – Now or Never.]  Several of them FB, AAPL, AMZN, NFLX and GOOGL were in trouble from a technical standpoint.  GOOGL, for instance, had just completed a death cross and the stock had broken down from a 10-year old rising wedge.The S&P 500 itself was also in a bind, having dropped through its 200-DMA and struggling to remain above its 2.24 Fibonacci extension at 2703. As it turned out, it couldn’t. It shed another 14% (20% from the Sep 2018 highs) before being rescued by the Plunge Protection Team.  Most of the FAANGs had similar troubles.

    GOOGL, at 1071.05 at the time, dropped 24% from its July 2018 highs and tested its March 2018 lows and completed a huge H&S Pattern targeting 707 before magically finding its footing. It has since piled on another 500 points, with two  downturns along the way turning the rising wedge into a rising channel [it just needed a global pandemic and a horrible recession to help it along] which is once again offering overhead resistance. What about the rest of the FAANGs? Any other warning signs that we should be watching?  Glad you asked.

    continued for members… (more…)

