Year: 2018

  • Once More, With Feeling

    While SPX has pushed above its 2.24 Fib extension multiple time over the past two months, and has remained safely above the critical support for the past seven sessions.  ES, on the other hand, has really struggled.  Following a failed rally on Mar 21, ES didn’t even tag its (2728.79) again until May 11.  Since then, it has made numerous failed attempts to hold support.

    Will this latest attempt hold?  Or, is it simply the latest effort to stave off a coming decline? Those with razor sharp memories might remember May 21, 2015 was an important day for SPX.

    Keep an eye on the dollar.  If USDJPY — which has nearly reached our upside target — is any guide, it might have run out of steam.

    continued for members

    And, with a little over a week left before May’s CPI is written in stone, it’s time for CL and RB to implode — at least to their initial backtest targets.The lower targets would put CPI back at 2%, but could be a drag on stocks.

    A reversal candle for DXY…

    …and, a failure of VIX to break down yet…

    …means SPX’s pop on the opening might mean a slightly higher high for (ii), but it might not hold.  By all means, play along if it does.  But, I wouldn’t be surprised if it fails.We’re been wondering for a long time whether SPX has been clinging to 2703 in order to mark time.  Today, we should finally get our answer.  The line in the sand for SPX is 2742.10 — the May 14 high.

    It would be much easier to feel confident about the COMP SMA200 dip if there were an obvious point where the SMA200 would intersect with a chart pattern – a channel line, etc.UPDATE:  10:50 AM

    Decision time…  For those who want to take a shot at a downdraft, this is it.  Mind your stops. Obviously, VIX could spoil things for the bears with a drop through the TL. UPDATE:  12:20PM

    So far, so good.  VIX hasn’t broken out, but it got a nice bounce off the red TL. COMP looks very unlikely to break out.SPX is hanging in there, but the .886 is safe for now. And, as an aside, GC has still not broken down.  Should be a safe entry point for those not already long – objective 1380ish with stops around 1250ish.And, as another aside, TSLA is backtesting its neckline. So much negative news on this stock, it’s a wonder it hasn’t deflated already.I have to run out for a meeting.  More later if anything significant pops up.

    GLTA.

    (more…)

  • Bonds and Value

    As the 10-year pushes past 3%, we’re left to wonder whether flows will begin to favor bonds again.  In a world of 2.5% inflation, bonds might seem like a sucker’s bet.  In a world of 8-10% inflation, even more so.Yet, we often buy instruments with little long-term value but plenty of short- or medium-term appreciation potential.  The 10-year is at an important inflection point, poised between a strong rebound and a significant selloff.  Its next moves are critical not only from an investment standpoint, but in terms of what to expect from the broader economy.continued for members(more…)

  • Charts I’m Watching: May 17, 2018

    TNX reached 3.11 this morning, but DXY isn’t buying it.  We asked rhetorically, yesterday, whether “investors algos [will] even care about the stagnation which, abetted by inflation-driven higher interest rates, has ensnared the economy in its razor sharp talons?  Or, will a tumbling ‘risk indicator’ and copious share buybacks be enough to ward off a correction?  …hey, VIX is off 8%! Everything must be awesome!”

    As it turned out, VIX dumped 11.4%, which is all the algos needed to ensure a bounce off the SMA100 and, more importantly, the 2.24 extension at 2703.62.  The game continued overnight.

    With futures off 12 points from yesterday’s highs — about half of the session’s gains – someone decided to dump a boatload of VIX futures — just enough to break VIX’s uptrend and ES’ downtrend.  The timing was perfect.USDJPY, meanwhile, is taking the opportunity to rally on higher interest rates and is nearing our next upside target.  And, RBOB and CL hit new highs.  Are the algos really so easily fooled?  Have carbon-based investors — who have certainly done the math on the economic damage higher rates and rising inflation are already doing — become irrelevant?

    In the midst of VIX dumping and USDJPY, CL and RBOB pumping, futures are still off 4 points.  Perhaps even the algos are tiring of the charade…

    continued for members(more…)

  • No Free Lunch

    While a higher dollar might help mitigate inflation, higher interest rates are starting to bite. Both mortgage refinancing and housing starts and permits tumbled in April.

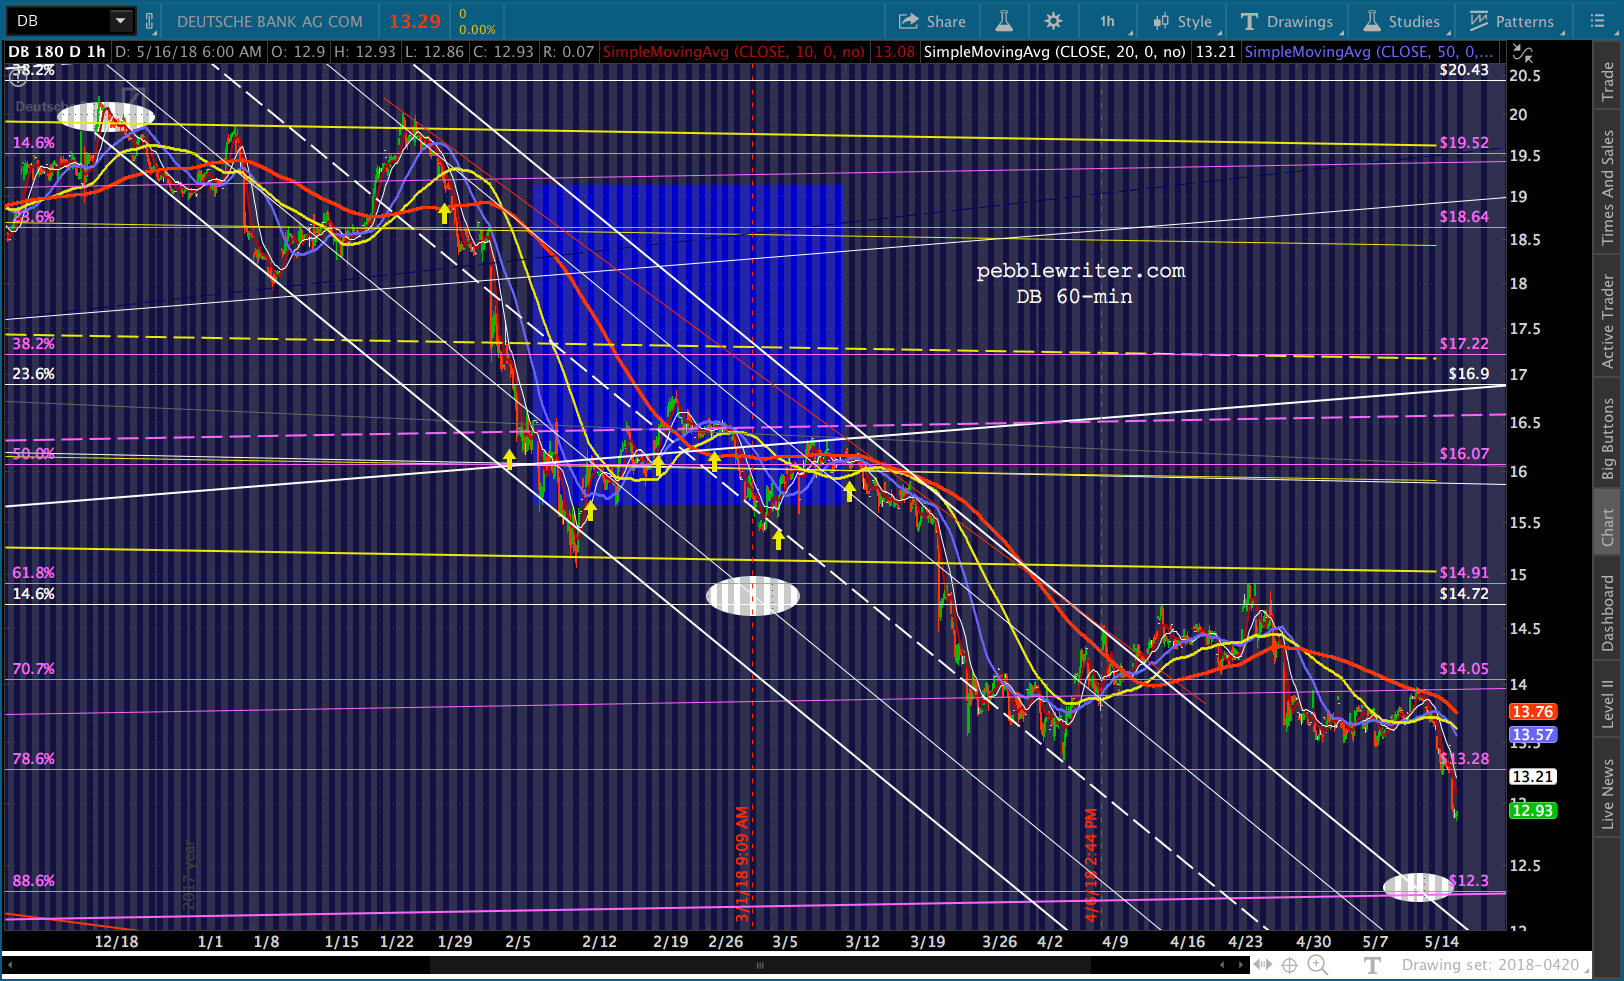
    Futures tumbled about 5 points on the news.  But, even that was a problem, as SPX is perched precariously atop the critical support of its 2.24 Fib extension at 2703.62 (not exactly a random walk…)It should come as no surprise to readers that VIX has already begun its nosedive.Meanwhile, Deutsche Bank — the third largest bank in the eurozone with $1.8 trillion in assets and $40 trillion in derivatives — continues its meltdown, closing in on our target from Feb 7 [see: What is Deutsche Bank Trying to Tell Us?But, hey, VIX is off 8%!  Everything must be awesome!

    Will investors algos even care about the stagnation which, abetted by inflation-driven higher interest rates, has ensnared the economy in its razor sharp talons?  Or, will a tumbling “risk indicator” and copious share buybacks be enough to ward off a correction?

    continued for members(more…)

  • Update on RUT: May 15, 2018

    In our Mar 8 update [see: RUT – How it Got Here, Where it’s Going] we noted that VIX had been particularly sensitive to VIX’s machinations.  In the throws of an analog at the time, we suggested RUT might be nearing a turning point.

    At some point, probably around Mar 14, VIX will plunge below [support], thereby driving RUT up to or through the .886 at 1595 or to new highs.  If the analog holds, it might run out of steam [there.]

    As it turned out, RUT topped out on Mar 13 at 1609.05, slightly above the .886 at 1595, and dropped back to the support of its 200-day moving average.  It enjoyed the journey so much, it has made two more runs — each within about 1% of the January high.With SPX backtesting critical support today, could RUT be coiling for a breakout?  Or is it about to run out of steam again?

    continued for members(more…)

  • Not so Fast…

    Higher interest rates and inflation, but falling retail sales?  Not a great combination for equities.  In fact, it feeds right into our base case of stagflation.Not even the venerable VIX gimmick was able to paper over the implications.Back on May 3 [see: Decision Time] we identified the 15-16th as a potential new low.  The next day, of course, the massive VIX dump sent stocks scurrying higher.  Though we had a nice bounce, ES and SPX reversed course, yesterday, at the lines in the sand we had drawn for them — meaning, the downside case is still in play.

    The key, of course, will be whether the damage can be limited to SPX 2703.62.  A bounce there at the 2.24 Fib extension would suit bulls just fine.  A drop through it would expose stocks to new lows.

    continued for members(more…)

  • Can Tesla Avoid a Crash?

    Take a look at Tesla’s bonds, and you might wonder if the company is careening towards that Great Center Divider in the Sky.  Yet, TSLA stock has held on to some important levels of technical support.  Setting aside the considerable, robust debate and analysis, what do the charts say?

    I’m a big believer in logarithmic charts, especially for stocks like TSLA which have increased in price so dramatically.  The logarithmic scale chart portrays a stock which has struggled to remain above a channel midline, and has plenty of downside potential should it ever drop to the channel bottom.

    The arithmetic version, on the other hand, illustrates a stock which has successfully bounced at critical points along its channel bottom.  Its channel bottom is much closer, but the risk entailed in even a mild selloff is also considerable.

    Regardless of which perspective one chooses, the stock has traded in a broad band since late 2013 — crisscrossing its 200-day moving average dozens of times.

    IMO, the most important chart feature has been the horizontal line at roughly 290.  It served as resistance between Sep 2014 and Apr 2017, when TSLA pushed up through it and it became support.The support didn’t hold, however.  After several backtests, TSLA finally plunged through it (also, the neckline of a large H&S Pattern) on Mar 27.  From the next morning’s post:  More Where That Came From…

    The following morning, TSLA gapped even lower — threatening a breakdown before genius Elon Musk inexplicably did something very stupid.

    Rudy Giuliani Public Relations?

    In perhaps the most ill-advised April Fools joke since United Airlines announced their new concierge deplaning service, Musk tweeted that the company had gone bankrupt.

    Despite intense efforts to raise money, including a last-ditch mass sale of Easter Eggs, we are sad to report that Tesla has gone completely and totally bankrupt.  So bankrupt, you can’t believe it.”

    I can only surmise that Rudy Giuliani must have surreptitiously been brought on board to direct Tesla’s public relations.  Needless to say, investors weren’t amused.

    The stock gapped lower the next day.  For all intents and purposes, it had broken down — along with many other indices and market leaders.  It was a dangerous moment for the market, which explains what happened next.

    SPX had closed below its 200 DMA on Apr 2.  On the 4th, SPX (and virtually every major index) benefited from a coordinated (Bullard and Kudlow) effort to prop up stocks [see: The Market’s Latest “Lucky” Bounce] on the 4th.

    TSLA joined in, rallying 14% that day and another 6% the following day — putting it safely back above the H&S neckline and horizontal support.

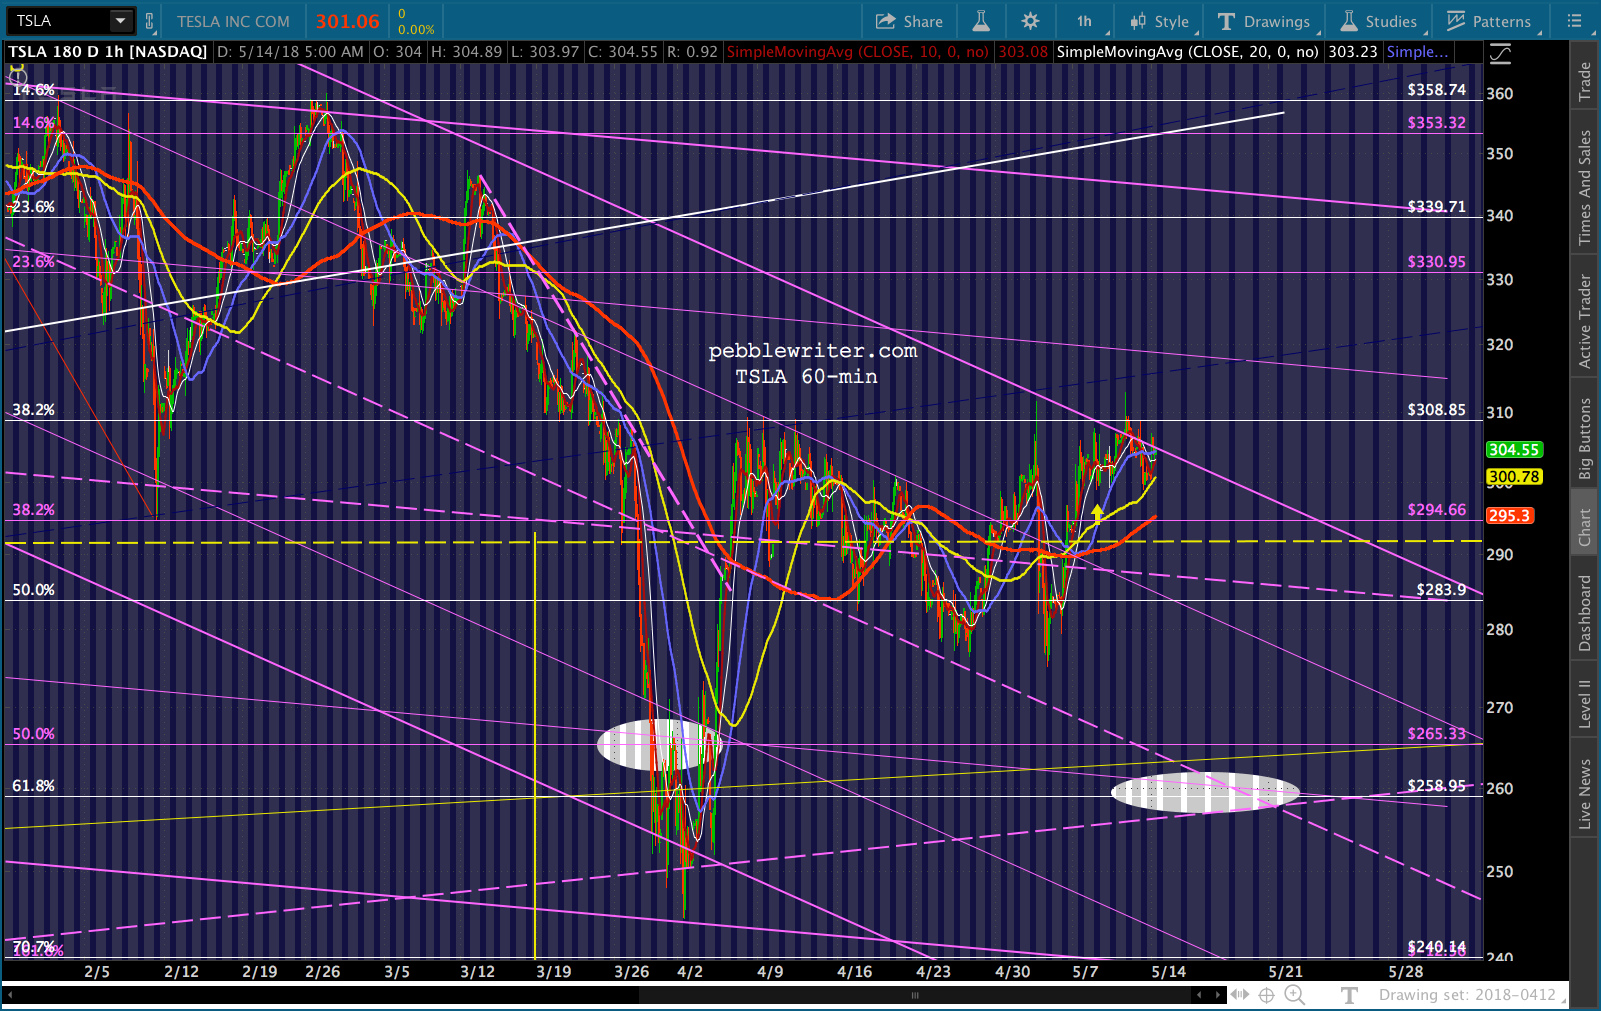
    But, the autopilot is clearly malfunctioning.  The stock has gone sideways for five weeks, repeatedly dropping back through its neckline and conspicuously failing to break out.  Today, it reinforced the notion that it’s in trouble by failing to follow through on the latest bounce (inspired by Musk’s $10 million open market purchase – the yellow arrow.)Perhaps TSLA will join AAPL, AMZN, FB and countless other stocks which have have driven their shares higher by promising to give you some of your own money back.

    It has neckline support at 290 and trend line support at 270ish.  Unless it drops below that support, resist that urge to short it.

    But, if it fails (again) to hold, nothing will have changed since that Mar 28 chart targeting 193 — a deep retracement of the post-Trump election lows.  Stay tuned.


  • VIX Dumps: Stocks Jump

    There are very few charts which tell the story of this market as dramatically as does VIX’s. The most noticeable pattern is the falling purple channel which accurately signaled its highs and lows between Nov 2015 and Jan 2018.  But, this falling channel conflicted with a much larger rising yellow channel.

    In the wake of the US election, VIX had a decision to make: bounce off the yellow channel bottom again (meaning stocks had peaked) or continue following the purple channel lower (supportive of new highs.)

    The bulls won out, as VIX spent more than a year dipping below the yellow channel bottom (arrows), occasionally setting new lows whenever stocks were in trouble.  Suddenly, in February 2018, VIX exploded out of the falling purple channel and retraced a Fibonacci .886 of its drop from the Aug 2015 highs — resulting in an 11.8% correction for SPX in only 6 trading days.  SPX would go on to test its 200-day moving average — something it hadn’t done since the US election — eight times between Feb 9 and May 3. VIX was supportive, settling lower in waves.  But, SPX remained mired in a downtrend, unable to break out of a falling channel it had been in since its January highs.  Finally, after SPX tagged its SMA200 on May 3, VIX plunged dramatically from 16.92 to 10.91 in one day.  Actually, the plunge lasted a matter of minutes.  But, it was a very powerful signal to the algos (and, any carbon-based traders paying attention) as it dipped back into the purple channel and below the yellow channel bottom.

    Three sessions later, VIX dropped through its SMA200, something it hadn’t done since Jan 23.  SPX loved it, and quickly broke out of its falling channel.

    As stocks approach our next upside target, it would be prudent to keep a very close eye on VIX.  After reaching the purple channel again, it has a fresh choice to make: re-enter the falling purple channel and resume violating the yellow channel bottom to make new lows, or bounce off it and give stocks an opportunity to properly correct.

    continued for members(more…)

  • The Big Picture: May 11, 2018

    With the algos firmly back in control of stocks, it seemed like a good time to take a step back and look at the big picture.  The Iran matter changes a few things — with potentially much bigger changes to come.

    We’ll start with VIX which, as expected, continues to get hammered — particularly when ES or SPX faces a specific hurdle such as SPX’s Fib 2.24 extension at 2702.78.

    There’s a fairly well-formed channel guiding it lower, but the real action comes when it drops below previously established horizontal support — even if it’s only a brief shot across the bow.

    continued for members(more…)

  • CPI: The Games Continue

    Everyone who drives knows that gas prices increased more than 3% month-over-month  – the official, seasonally adjusted numbers from the BLS in this morning’s CPI report.  Data put together by non-governmental sources confirms it.But, folks like GasBuddy and AAA aren’t responsible for cost of living adjustments for millions of Americans.  So, unlike the BLS, they have no incentive to fudge the numbers. Maybe they’re also aware that gas stations don’t allow customers to pay the “seasonally-adjusted” price.

    Using the EIA’s (also fudged) numbers, gas prices were up 6.2% for April — more than twice BLS’ goal-seeking 3%.  So, the BLS was able to report 0.2% instead of the 0.3% expected for April CPI.Similar games are played, of course, with respect to shelter (+3.4% YoY,) medical care (+2.2%) and vehicles (-1.6% new, -0.9% used.) I’ll pick on vehicle data this morning, as it illustrates another shortcoming of the BLS approach.

    Consumers buy food and gas every few days, while they tend to hold on to vehicles for several years at a time.  Even if vehicle prices were to drop, that savings wouldn’t flow through to a consumer until they purchase a vehicle.  When they did, of course, they’d be hit with higher interest rates than were in place last month or last year.

    The algos don’t care much about the veracity of the numbers.  Futures are up 8 points ahead of the open — another overnight VIX bashing that has it below the SMA200 and about to test the .886 Fib and channel midline at 13.23ish.  While it’s nice to nail a forecast, it’s distressing to see how easily the algos can be manipulated. The flip side of under-reporting inflation, of course, is the effect it has on currencies and interest rates. With “no” inflation pressure, interest rates have receded from 3% — sapping some of the dollar’s strength. continued for members(more…)