

With the algos firmly back in control of stocks, it seemed like a good time to take a step back and look at the big picture. The Iran matter changes a few things — with potentially much bigger changes to come.
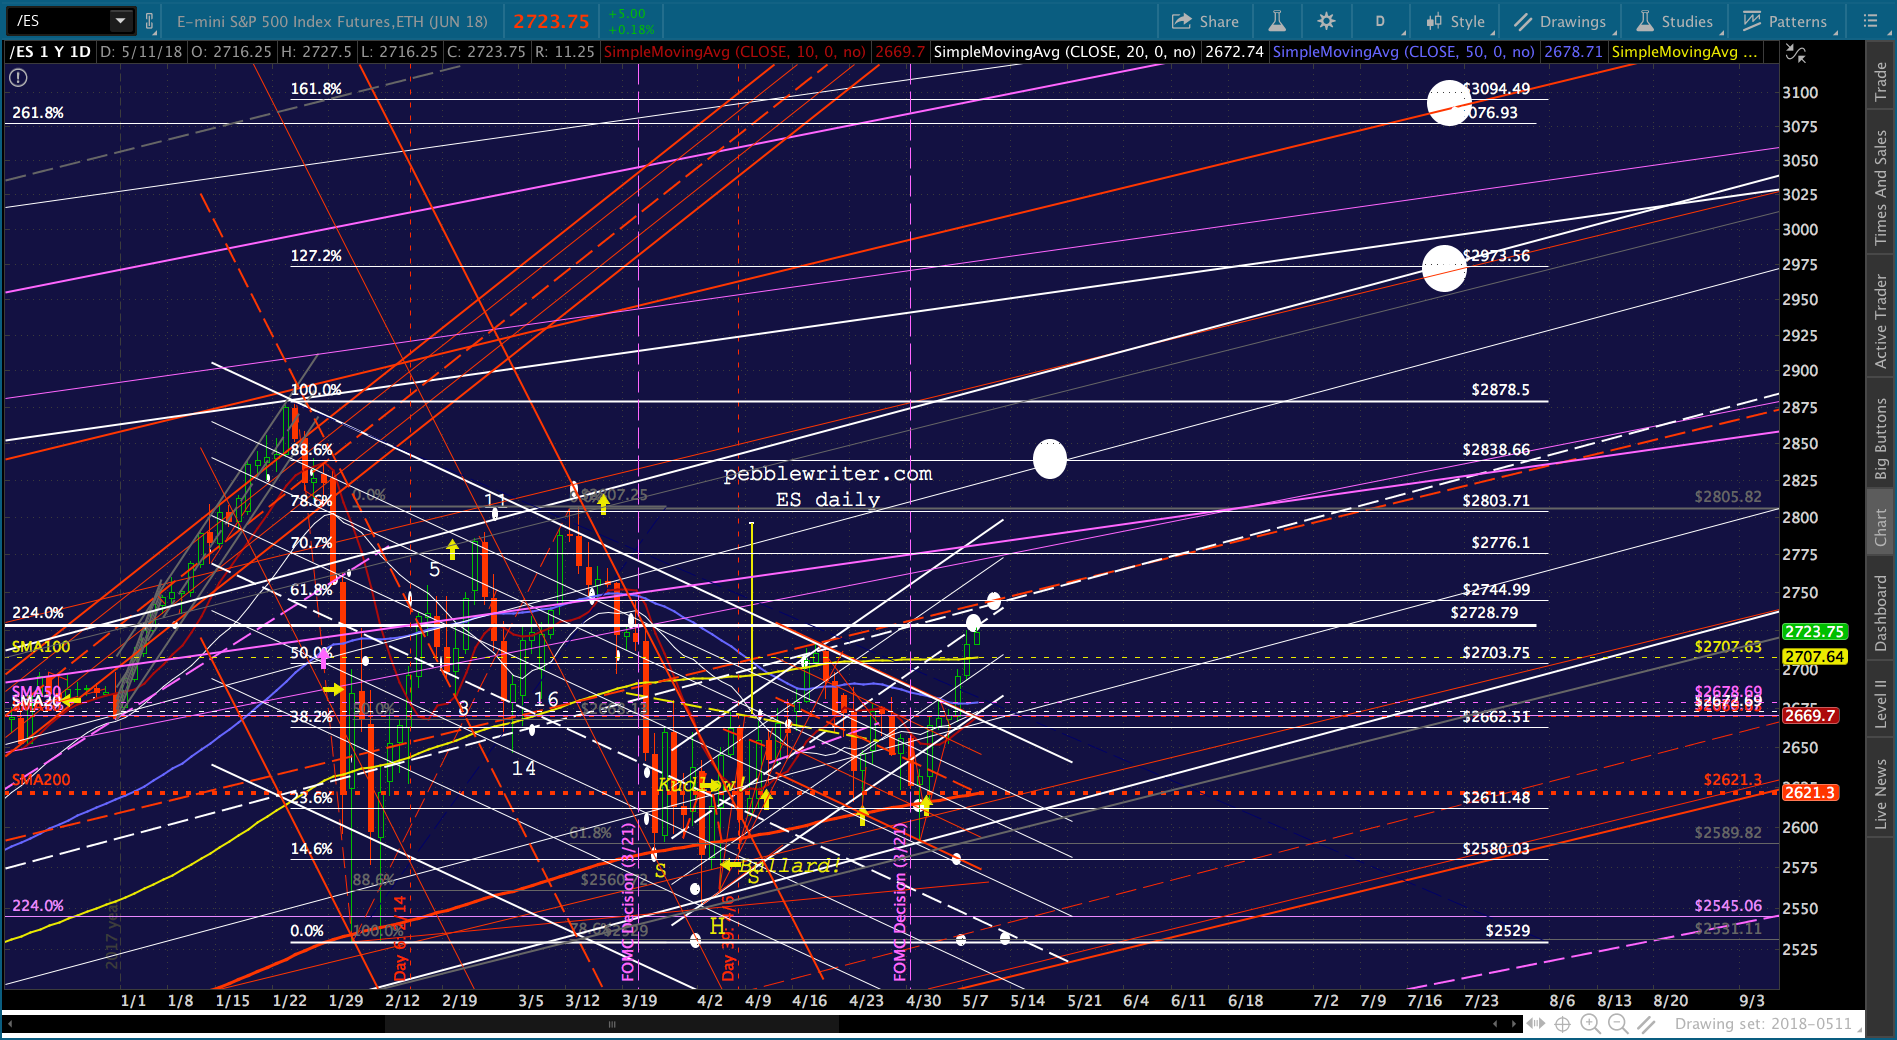
We’ll start with VIX which, as expected, continues to get hammered — particularly when ES or SPX faces a specific hurdle such as SPX’s Fib 2.24 extension at 2702.78.
 There’s a fairly well-formed channel guiding it lower, but the real action comes when it drops below previously established horizontal support — even if it’s only a brief shot across the bow.
continued for members…
Note that after all the little moves that have helped SPX break out, VIX has again reached stiff support — the top of the falling purple channel above which it broke out and started the fireworks in January.
This has left SPX just north of its 2.24 extension (2702.78) and ES just south of its (2728.79.) Both have now broken out of their falling channels.
 It’s safe to say that VIX should be able to get ES past its 2.24. At that point, they should both zero in on their .618s Fibs at 2742.92 and 2744.99.
But, there’s nothing special about the .618. Both already reached their .786 retracements back in March — meaning that if they’re able to make new highs, the next Fib targets would be the 1.272 or 1.618 extensions shown below (pay no attention to the timing at this point, still working on that.)
 Is a push to new all-time highs a done deal? No. There are a number of issues markets must overcome. For instance, DJIA still needs to break out past its wedge top and previous high at 24858.97.
I don’t see this as a big problem, as DJIA is generally much easier to manipulate than SPX. But, it’s absolutely necessary in order for stocks to break out again. A failure would be devastating to the bulls.

 I should mention that DJIA’s Apr 2 lows were lower than its Feb 9 lows — not by much, but lower all the same. SPX/ES didn’t manage to make lower lows, so one of these is off.
Also, the wave form looks wrong for new highs. The downturns look more impulsive than the rallies — which look corrective to me. To me, this latest push looks more like a wave C of 2 of 3 — meaning a 3rd of a 3rd would be next. But, I’m hardly an EW expert. And, besides, since when has proper wave structure mattered to TPTB?
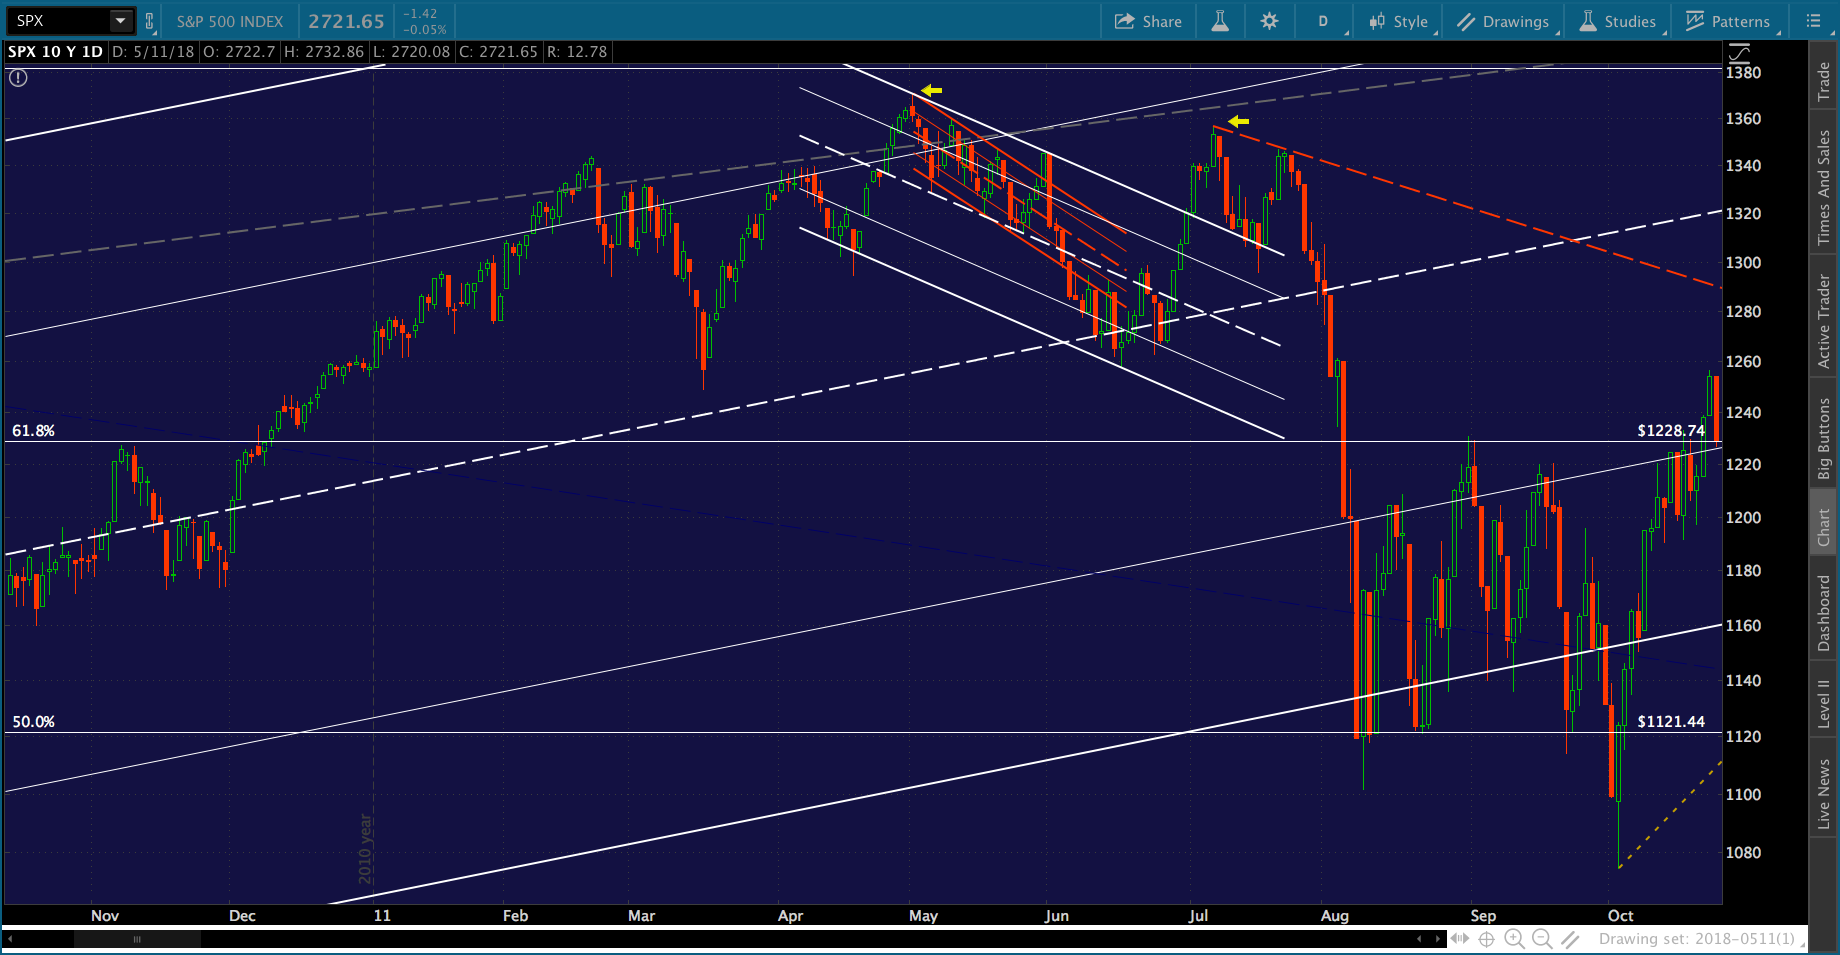
From a channel standpoint, there isn’t a lot to go on. The most important channel at the moment seems to be a relatively short-term one that dates back to late 2011. Aside from showing plenty of room for downside, there’s no channel resistance at this point.
 I don’t see the dollar as being particularly helpful to stocks. While it could nudge a little higher to tag the channel top, I don’t see it breaking out. I think rates are due for a drop, which will likely result in this latest rally unwinding and the purple channel bottom being tagged — even if at a higher low than we saw in Feb.
 However, USDJPY looks like it could backtest some more — certainly to the SMA200 and potentially through it to the white channel intersection at 111.60 in late May/early June.
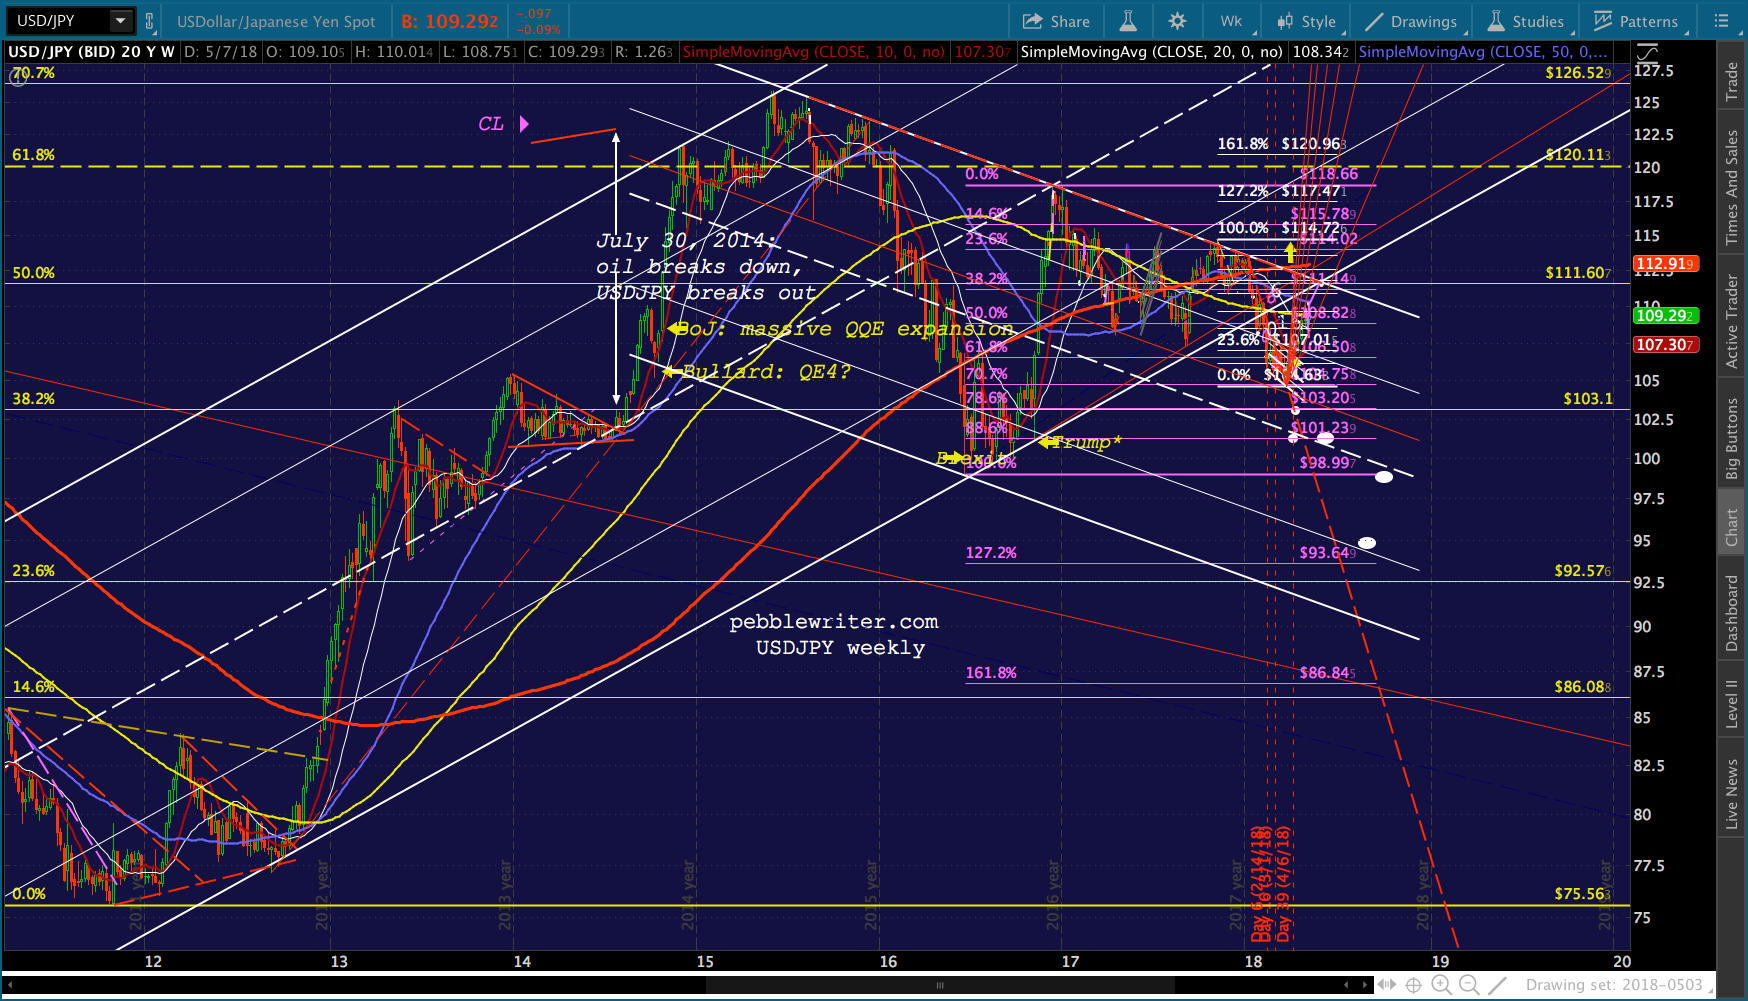
 EURUSD has dropped further than I originally expected. But, it’s interesting that it has backtested the .236 line of the rising white channel.
 I still look for it to rally up to the .618 line and red channel top, if not right away then soon.
 From a fundamental standpoint, I have a hard time getting excited about dollar weakness — especially versus the euro. It’s simply what the charts suggest.
Now, the last major factor in equities’ potential rally: oil and gas. I’ve written so much about this, but I continue to feel TPTB have no choice but to whack it back down to a level where inflation and higher interest rates won’t be a problem.
RB has broken out of a channel which broke out of another channel. The May YoY rise is huge, and June’s is even worse. A stronger dollar has kept CPI from going completely crazy, but IMO things are getting out of control. CL is in a similar position. Note the overboughtness on considerable negative divergence — not to mention channel resistance on the daily RSI.
 A couple of other odds and ends…
GC got a solid bounce off its SMA200 last week – reinforcing the idea that DXY has further to drop. If it plunges through its SMA200, then obviously it’s a short. But, at this point, it seems more likely to rebound up to the 1377-1380 neckline. And, I commented on NKD yesterday. NKD has been uncharacteristically weak, but managed to break out of its falling channel yesterday. Interestingly, it broke out up to the .618 and seems undecided about going any further.
  A more bearish reversal would have occurred at the .500 and channel midline. But, I think it’s worth keeping an eye on the .618 anyway. A failure to break out here would find support at the SMA200 at 21660ish — not much of a drop. A break out would be bullish.
 If this push above ES 2728 and SPX 2703 should fail, then the push will have been a pretty good headfake. We don’t see failed breakouts very often. The last one that threw most people [not us, as we were following our analog] for a loop was in 2011. First, the short-term red channel broke out and then broke down; then, the white one did the same thing.
 The structure, timing, etc. this time is nothing like then. But, that doesn’t mean it won’t do the exact same thing.
Summary: I’m not quite ready to give up on the downside case. Sure, we have a couple of breakouts and a rise above a key Fib level. But, we had four previous pushes above the 2.24 which failed. This could well be the 5th.
Sitting at an important inflection point, the risk is higher than usual that it could go against you. With oil and gas prices rising so quickly, the risk is that inflation is about to go out of control and the USD and interest rates will rise to compensate.
This could send stocks higher. I think it would be a colossal mistake for the economy…but, no one asked me. And, Mnuchin doesn’t seem the brightest bulb in the pack anyways. If the FOMC remains as hawkish as they insist they are, things could get ugly in the next few weeks.
I’m knocking off a little early this weekend, going to pick up my daughter from college. I wish everyone a good one!
Comments
3 responses to “The Big Picture: May 11, 2018”
It gives a complete correction with an ABC structure. Just my thought.
Look at the chart of 2011. I have recently changed my mind on the EW count. The correction started in February. A wave down in March followed by an irregular B wave top the end of April. Followed with a 5 wave C down to October.
So, 2/18 to 3/16 as wave A? Curious as to why have it starting in Feb? Something to do with the wave structure leading to that point?
I’ve always been struck by the very clear IH&S from 2/22 to 4/26. Decent form, completed, but little follow through as SPX was approaching its .786 at 1380.