Month: January 2018

  • FOMC Day: Jan 31, 2018

    Today is the final day of our membership promotion. For a great opportunity to do well by doing good, CLICK HERE.

    *  *  *


    SPX and ES both closed below their SMA10s yesterday — the first time that’s happened in 2018.  Although futures rebounded strongly overnight, the current gain of 9 points is only enough to prompt a backtest on the open for SPX.

    Today should be interesting as we have not only the FOMC rate decision/statement, but pending home sales and EIA inventories.  I’m still looking for overshoots from our currency pairs and DXY, oil and gas are tumbling, and VIX is nearing our next upside target.  All in all, it should be an interesting day.continued for members(more…)

  • Where’s the Bounce?

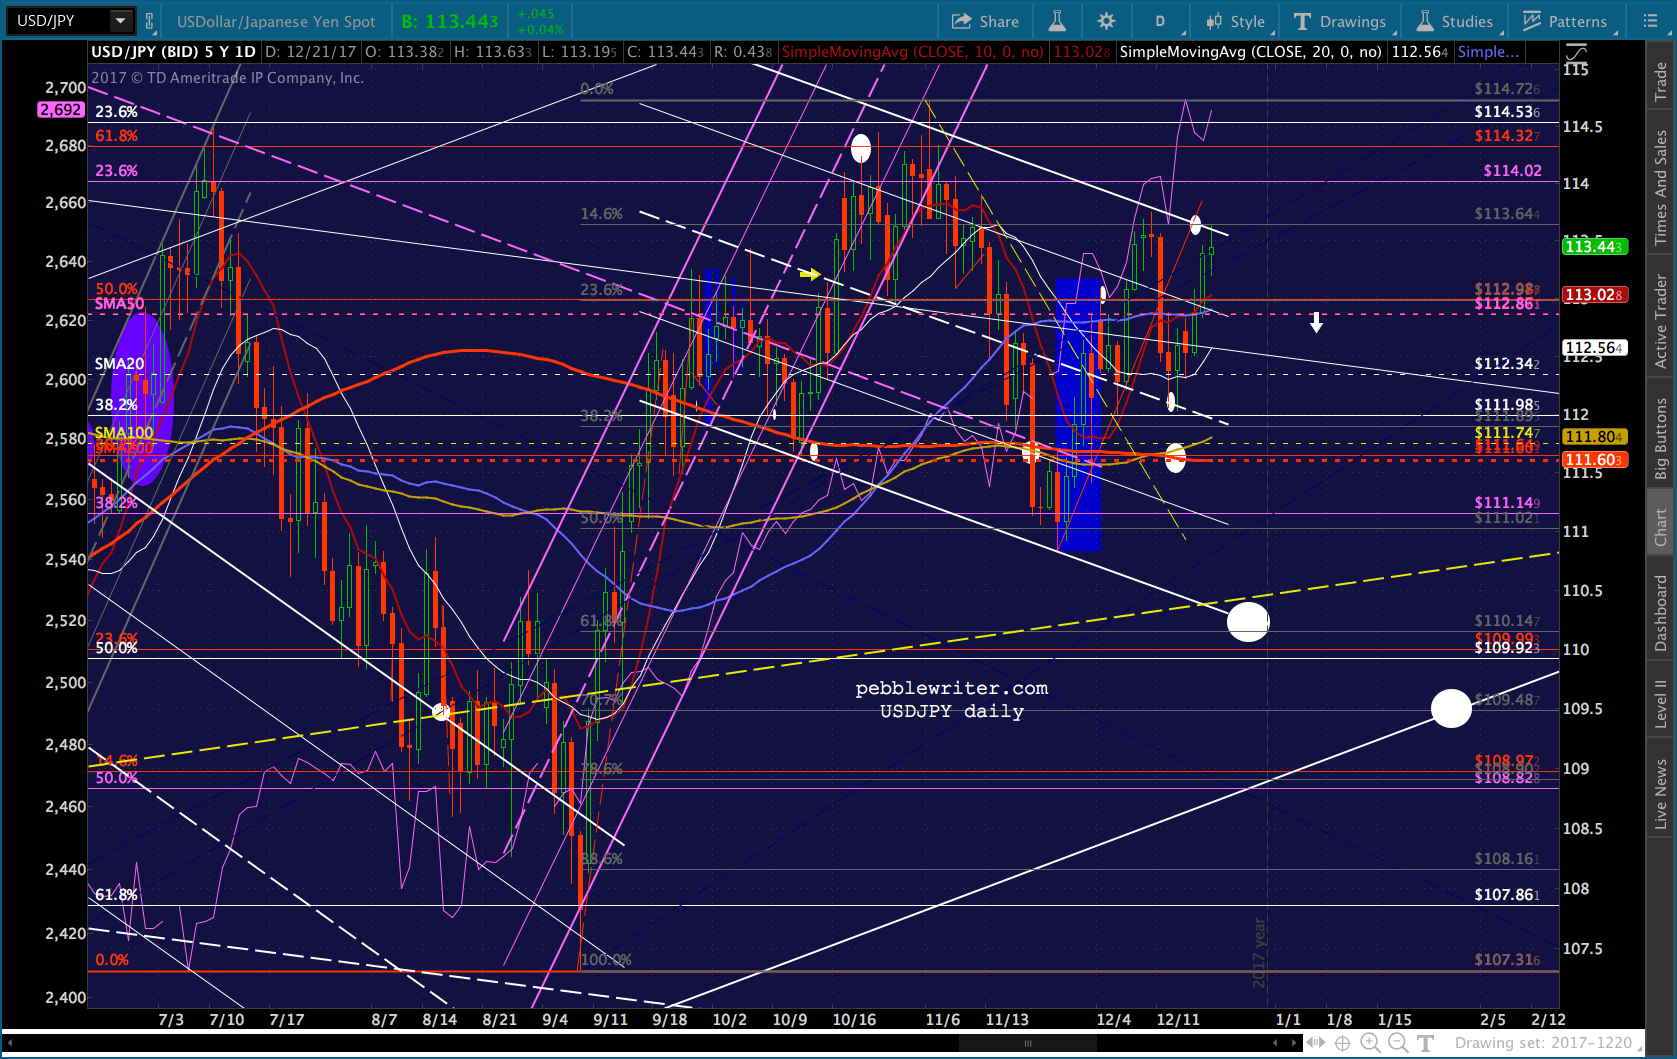
    If you’re looking for a scapegoat for this morning’s slide, look no further than USDJPY.  After reaching initial channel support on the 24th [see: Jan 24 Update on USDJPY] it slid down for a near tag of the .886 retracement at 108.16.

    Instead of a nice, big bounce back above the channel bottom, however, it appears to be coming back for more.  ES, which finally saw its rising white channel break down yesterday, is not amused.  It has now re-entered the rising red channel from which it broke out on Jan 22.Almost all of our currency pairs, commodities and indices have landed right where we expected. But, they have yet to take the next step.

    After months of almost immediate, V-shaped recoveries, traders might be forgiven for wondering “where’s the bounce?”

    continued for members(more…)

  • Update on VIX: Jan 29, 2018

    VIX just reached 13.84, just a smidge away from our 13.93 target dating back to several weeks ago.  From China: It’s Not Me, It’s You:

    VIX jumped up and tagged its SMA200. For those still sitting with a long position at 9.33, this is the easy money — a second chance for those who wished they’d sold last week. For diehard bears, the most likely upside target is 13.93 (ideally Wednesday, Jan 17) with a reach target of 16.13.

    continued for members(more…)

  • Update on Bonds: Jan 29, 2018

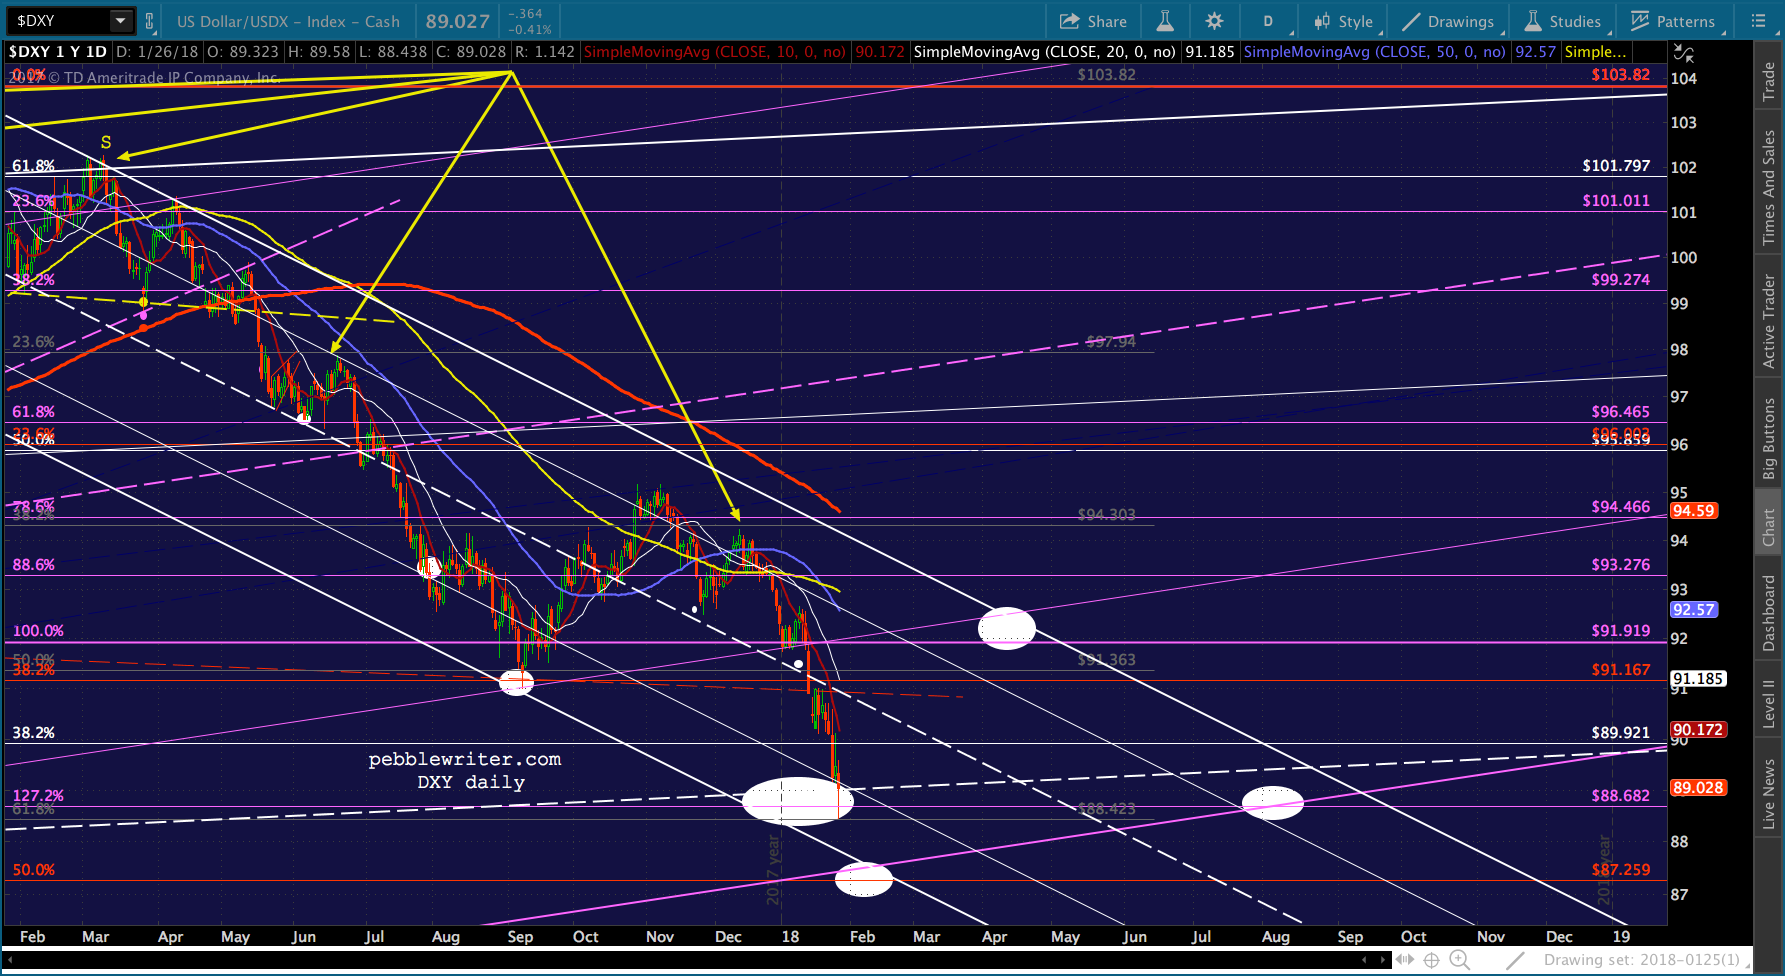
    The good news is that TNX tagged our next upside target this morning — the neckline of a fairly large IH&S Pattern that we first detailed back on Jan 9 [see: China – It’s Not Me, It’s You.]  The bad news is that this isn’t shaping up as a clean reversal.To see why, we must examine DXY — which also isn’t shaping up as a clean reversal.  Recall that DXY tagged our downside target range last Thursday [see: US Dollar – Capitulation.]  It was a precise tag of our range (88.438 versus 88.423-88.682) but it stopped just short of an important channel bottom.

    Likewise, TNX has resistance just overhead that could come into play in (a) an overshoot, (b) a reversal and later thrust higher, or (c) never.  Fortunately, the upside potential from here is relatively limited, enabling traders to get out ahead of it.  Ignoring cries of “the sky is falling” might prove to be the tougher challenge.

    continued for members…
    (more…)

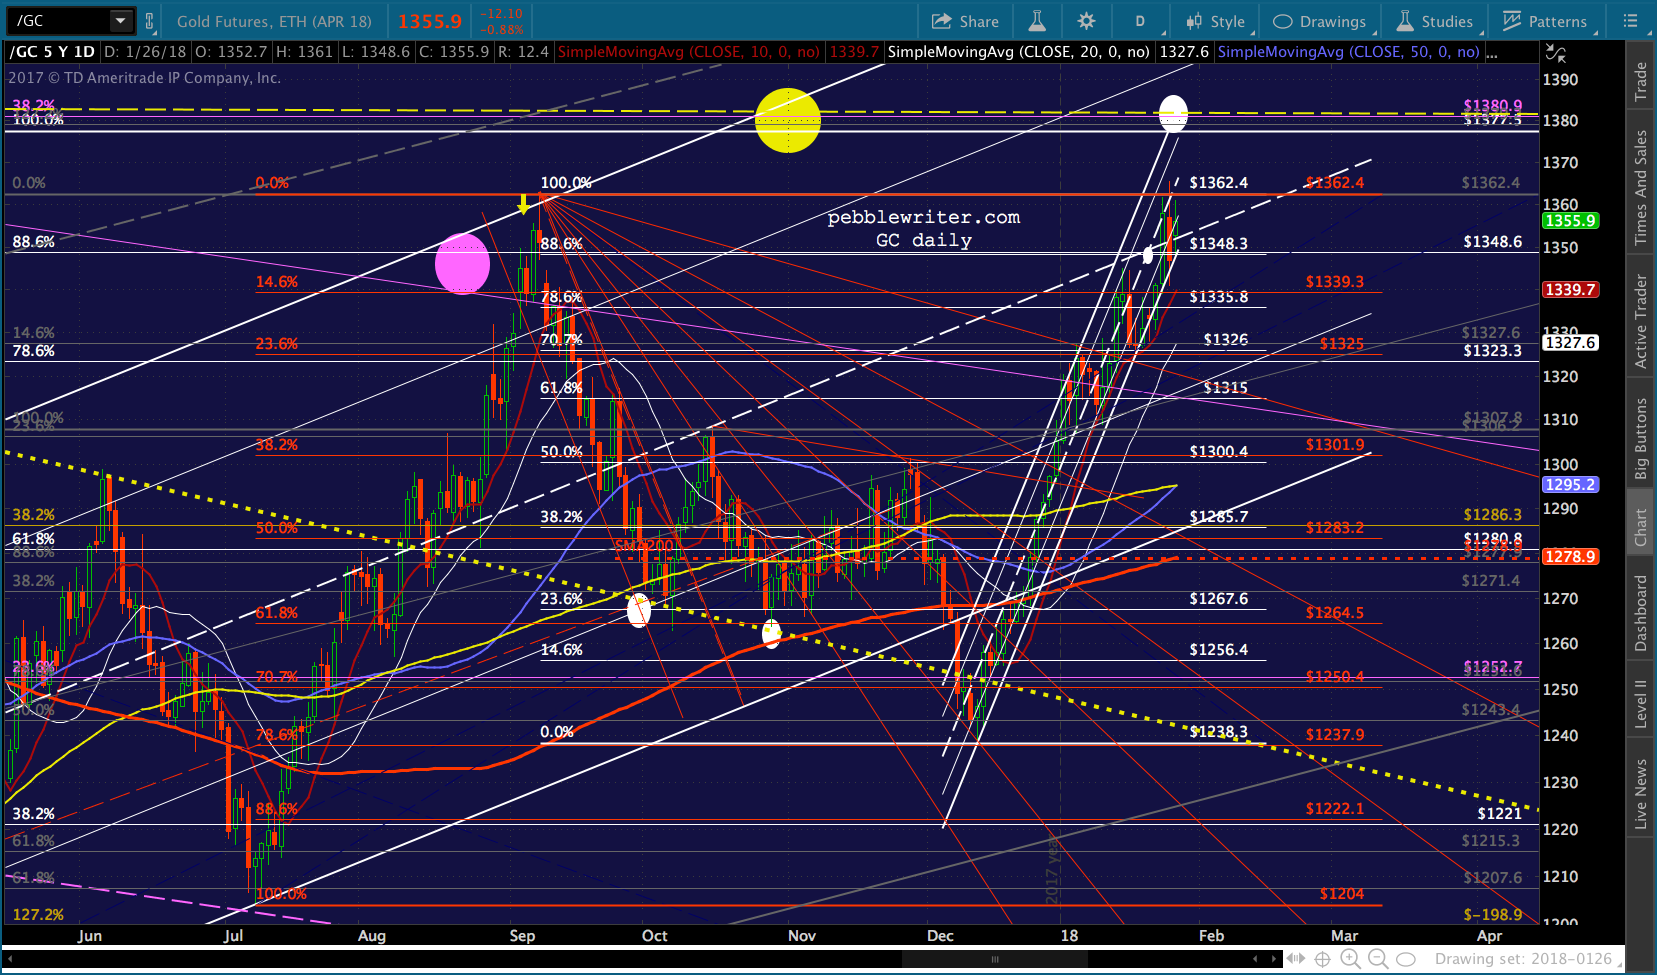
  • Update on Gold: Jan 26, 2018

    If you don’t believe in chart patterns and technical analysis, good luck trading gold.

    GC has been buffeted by bad guys, bullied by Bitcoin, and bolstered by central bankers.  Yet, despite massive manipulation, it has behaved in very predictable ways — though not without plenty of headfakes.

    Most recently, GC popped back above a critical trend line that represented a clear separation of bullish and bearish paths.  The long call was made easier by the USD behaving as expected.  From 1250 to 1365 (yesterday) is a nifty 9.2% gain.  Score one for the chartists.

    continued for members…

    As I noted the past few days, GC is sitting just below the neckline of the huge IH&S that could result in a significant breakout.  The fly in the ointment: I don’t think TPTB will let it break out.  So, you should either take profits here in the 1348-1365 range, or at least set your stops at this level.

    There’s a 50:50 chance that it pops higher, but only if DXY can reach its channel bottom at 87.50ish. Since DXY tagged our 88.423 target earlier today, I suspect it’s due for at least a bounce.

    Therefore, my gut tells me that GC will suffer the same fate as in September, when it reversed at the very same .886 Fib.  If so, look for it to pull back to at least the .236 channel line, currently around 1315, with secondary support at the rapidly rising SMA50/SMA100 (1295).Stay tuned.

  • US Dollar: Capitulation?

    When it comes to trade, there is no free lunch.  A lower US dollar helps US exporters.  But, for the US – a net importer by a huge margin – it raises the price of imports.

    So, it was really interesting to watch Treasury Secretary Mnuchin step in it explain that a lower USD would be “beneficial to our trade imbalances” without mentioning the offsetting, and more troubling, inflation and interest rate repercussions.

    If we didn’t have $21 trillion in debt (multiples of that off-book) in a rising interest rate environment, it probably wouldn’t matter.  But, the CBO’s numbers, which assume 10-yr rates top out just over 3% (half the historical average), argue otherwise.

    Mind you, I’m not complaining.  I’ve been bearish on the USD for a very long time.  In May 2017 [see: May 1 Update on US Dollar] we noted that DXY had broken below a long-term trend line and was susceptible to more downside.

    …if DXY drops through the SMA200 and the yellow TL, then we have some very obvious Fib targets including the .786 at 97.583, the .886 at 96.789 and the purple .618 where it intersects the purple channel midline at 96.465 in July or August.  If the purple midline breaks down, the next major support isn’t until 91 in early September and 87-88 as early as the end of the year.

    We’ve seen plenty of worrisome bumps along the way, with a couple of timely rallies in Q4 to support stocks.  But, our charts have remained bearish even as the Fed, with its ineffectual rate hikes, struggled to argue otherwise [see: Will the FOMC Minutes Save the Dollar?]

    DXY just tagged our 87-88 target, reaching 88.438 moments ago with its eye on the rising purple channel bottom around 87.423.As we discussed in yesterday’s updates on EURUSD and USDJPY, the big question is what now?  The charts offer a compelling answer.

    continued for members(more…)

  • How Bad is Today’s Sell Off?

    As long as the rising white channel isn’t broken, then we still have a breakout on our hands.  And, remember, this is a breakout of a breakout.  Channel support is around 2625.There are plenty of downside targets is 2625 doesn’t hold.  But, since VIX is already being beat back from its earlier highs, I wouldn’t hold my breath.  A bounce by DXY and USDJPY would also do the trick.  Given that USDJPY has reached our channel target, a bounce (at least interim) seems likely.Note that EURUSD has reached our next upside target.  And, DXY is closing in on our downside target… GC has reached our next upside target — a good place to switch sides, as TPTB are unlikely to allow the run up to 1377 in such an environment.The question on everyone’s mind: can the politicians (and Draghi) keep their mouths shut long enough for the bounce to take hold?

    If the white channel breaks down, the red channel bottom is down around 2790.  If the red channel breaks down, the next major support isn’t until the 2.24 at 2728.79 — nearly a 4% drop, the likes of which we haven’t seen since 2016.

    Stay tuned.


  • Update on EURUSD: Jan 24, 2018

    Just a quick update to point out that EURUSD just reached our next upside target of 1.24.  In our last major update [see: Jan 18 Update on EURUSD] we identified this as the backtest of an alternate IH&S Pattern neckline as well as the top of the rising white channel which has guided the pair higher since the previous rising broke down in October 2016.But, it’s been on our radar since EURUSD broke out of a falling channel on Dec 29 [see: A Good Start?]

    Same caveats as USDJPY:

    (1) DXY isn’t quite to our target range of 88.423-88.682, and it has the potential to drop to 87.4 if the Fed doesn’t panic right on schedule.

    (2) With all the rhetoric surfacing in the White House and at Davos, an overshoot is a distinct possibility.  And, with Draghi scheduled to pontificate tomorrow, anything could happen.

    continued for members(more…)

  • Update on USDJPY: Jan 24, 2018

    USDJPY finally pays off.  Recall we turned negative on the pair on Dec 11 when it appeared its breakout had run out of steam [see: PPI tops 3%]:

    For those playing the USDJPY, this is a good entry for a short position with tight stops. The initial target is the SMA200, currently at 111.64, followed by the .618 at 110.14 and channel bottom currently around 109.

    A second spike ten days later tested our resolve but, in the end, merely offered another nice entry point for a great short [see: VIX – New Lows.]

    With USDJPY now sitting at key channel bottom support, have we reached an important turning point?

    continued for members…

    (more…)

  • Congratulations!

    Tip of the hat to central bankers, who have now officially pushed risk appetite to the highest level ever on record.Analysts might argue over whether it was the new administration, the tax plan, the loosening of regulations, etc.

    I’m partial to the notion that algos, driven by the manipulation of currencies, oil prices and VIX, have exerted outsized influence on a market dominated by passive, follow-the-leader “money managers.”

    I’ve watched the effects slowly creep into the markets, gaining momentum over the past 7 years since I first founded pebblewriter.  At first, it was the occasional stick save — big moves in USDJPY drove the yen carry trade between 2011-2015.After the USDJPY flamed out, a doubling of oil prices kept stocks on the rise.  When CPI started accelerating and the twin shocks of Brexit and the US election threatened to kill off equities’ rally… …USDJPY took over again, registering its steepest spikes in recent history.  And, when the yen fell so sharply that oil priced in yen almost doubled YoY (Jan 2016 – Jan 2017)… …the yen magically started strengthening again and VIX took over the job of triggering the algos, beginning an historic plunge below long-term support that has become a regular daily occurrence.  It has truly been an artful exercise in price manipulation which, ironically, has landed markets right back in the middle of another bubble.  Yes, that’s me talking.  But, there’s a growing chorus of like-minded academics, traders and investors who view the exuberance as irrational.

    As the chart at the top of this post shows, markets exhibiting exceptionally high risk appetite rarely get a pass.  There has almost always been a reckoning.  But, it’s clear that central bankers and those who ride on their coattails have become really, really good at propping up stocks.

    Toss in the corporations which are buying back their own stock hand over fist, facilitated by historically low interest rates, and you have a rally that’s hard to love.  Consider the fact that prices have grown 70% since the 2007 highs, while GDP and sales have risen only 10%.  The price:sales ratio recently eclipsed the 2000 highs.How long can this go on?  As we discussed last week, the wild cards are inflation and interest rates.

    Oil prices broke out in December.  Gas prices are currently threatening to do the same.  While core CPI, which ignores such trivial items, is flat… …CPI shows every sign of having broken out.Bond markets are taking notice and are also threatening to break out……which is probably prompting a fair amount of hand-wringing amongst central bankers tasked with coping with the consequences.

    For better or worse, these assumptions continue to drive our price targets for oil and gas, currencies, VIX and gold.

    continued for members…
    (more…)